Abstract
Hereditary hemochromatosis (HH) is mostly caused by mutations in the iron-regulatory gene HFE. The disease is associated with iron overload, resulting in liver cirrhosis/cancer, cardiomegaly, kidney dysfunction, diabetes, and arthritis. Fe2+-induced oxidative damage is suspected in the etiology of these symptoms. Here we examined, using Hfe−/− mice, whether disruption of uric acid (UA) homeostasis plays any role in HH-associated arthritis. We detected elevated levels of UA in serum and intestine in Hfe−/− mice compared with controls. Though the expression of xanthine oxidase, which generates UA, was not different in liver and intestine between wild type and Hfe−/− mice, the enzymatic activity was higher in Hfe−/− mice. We then examined various transporters involved in UA absorption/excretion. Glut9 expression did not change; however, there was an increase in Mrp4 and a decrease in Abcg2 in Hfe−/− mice. As ABCG2 mediates intestinal excretion of UA and mutations in ABCG2 cause hyperuricemia, we examined the potential connection between iron and ABCG2. We found p53-responsive elements in hABCG2 promoter and confirmed with chromatin immunoprecipitation that p53 binds to this promoter. p53 protein was reduced in Hfe−/− mouse intestine. p53 is a heme-binding protein and p53-heme complex is subjected to proteasomal degradation. We conclude that iron/heme overload in HH increases xanthine oxidase activity and also promotes p53 degradation resulting in decreased ABCG2 expression. As a result, systemic UA production is increased and intestinal excretion of UA via ABCG2 is decreased, causing serum and tissue accumulation of UA, a potential factor in the etiology of HH-associated arthritis.
Keywords: ABCG2, hemochromatosis, hfe-null mouse, hyperuricemia, iron/heme overload, p53
Introduction
Uric acid (UA), the ubiquitous end-product of purine catabolism, is an intriguing molecule whose biochemical and pathological effects are dictated by its concentration and the surrounding microenvironment. UA is one of the major endogenous antioxidants whose action is directed towards prevention of lipid peroxidation and inactivation of nitric oxide synthase [1]. In addition, UA is a potent iron chelator; it minimizes iron-mediated redox reactions and generation of reactive oxygen species (ROS) [2]. However, this is true only when UA is present in physiologic concentrations, which is 3.5–7.2 mg/dl in adult males and postmenopausal females and 2.6–6.0 mg/dl in premenopausal women [3]. However, the antioxidant capacity of UA is overshadowed by detrimental effects when its concentration exceeds its maximal solubility (6–7 mg/dl) [4]. In this scenario, UA precipitates and crystalizes as monosodium urate (MSU), which gets deposited in joints, leading to inflammation and gouty arthritis [5]. Since there is an overlap in UA concentrations that define hyperuricemia and that dictate MSU crystal formation, and both have pathological implications, recent discussions continue to emphasize the need for reduction in this ‘healthy' UA range [3].
Origin of inflammation caused by MSU crystals is multifactorial. MSU crystals in synovium are engulfed by neutrophils/monocytes where they initiate ROS production and cell death [5]. In addition, they communicate with resident macrophages; upon encounter, MSU crystals trigger the assembly of NLRP3-inflammasome in macrophages and stimulate production and secretion of the proinflammatory cytokine interleukin-1β [5]. Ultimately, the proinflammatory cytokine storm, accumulation of ROS, and acute (later chronic) flares and excruciating joint pain constitute the pathophysiology of gout [4]. The levels of UA in circulation are dictated by the balance between the rate of its production and the rate of its excretion, and genetics is an important determinant in this phenomenon. Recently we reviewed the genetic defects in various transporters that play a critical role in UA homeostasis, consequently leading to either hypouricemia or hyperuricemia [6].
An additional risk factor for arthritis is iron [7] because free iron participates in redox reactions by acting as an electron donor and receptor, ultimately leading to production of hydroxyl radicals and oxidative damage [8]. If that occurs in synovium, arthritis-like symptoms appear [9,10]. Hereditary hemochromatosis (HH) is considered to be the most prevalent disease associated with iron overload; it affects 1 in 250 individuals in certain populations [11]. It is usually referred to as a ‘silent disease' because iron loading and iron-elicited damages occur gradually, and detrimental symptoms appear only at 50–60 years of age [12]. In ∼80% of cases, HH is caused by autosomal recessive mutations in HFE gene, with C282Y being the most prevalent mutation [13]. HFE, a major histocompatibility class-I-like plasma membrane protein [14], is a critical component of iron-sensing and iron homeostasis-regulatory complex. Its action is mediated by promotion of the synthesis of hepcidin, a hepatic hormone that regulates the amount of iron that enters circulation from diet and tissue-resident macrophages [15]. Missense mutations in HFE disrupt the iron-sensing complex and leads to ablation of hepcidin production [16]; this causes systemic iron overload and iron deposition in multiple organs [17]. As a result of iron deposition and iron-induced oxidative damage, the disease manifests with dysfunction of multiple organs, causing liver cirrhosis and liver cancer, nephropathy, cardiomegaly, diabetes, and pituitary insufficiency.
Arthropathy is commonly seen in patients with HH [18–23]. Iron accumulation and consequent oxidative damage are believed to be the principal cause of joint damage in HH. Calcium pyrophosphate dihydrate crystals are found in affected joints, imitating pseudogout [24] and free iron reduces the clearance of these deposits from joints [25]. There are no published reports linking HH to dysregulation of UA homeostasis; this is intriguing given the well-established role of excess UA in arthritis. This critical knowledge gap renders our current understanding of arthropathy in HH incomplete. Therefore, we examined UA status in HH using a mouse model of HH, namely Hfe−/− mouse. These studies demonstrate that Hfe−/− mice have hyperuricemia and that decreased excretion of UA in the intestine via down-regulation of the UA exporter ABCG2 is likely to be the principal contributor to this phenomenon.
Materials and methods
Animals
Hfe−/− mice on C57BL/6 background were purchased from Jackson Laboratory (Bar Harbor, ME, U.S.A.) and C57BL/6 Abcg2−/− mice were purchased from University of California Davis Knockout Mouse Project (KOMP) Repository (Davis, CA, U.S.A.). The mice were maintained at the animal facility of Texas Tech University Health Sciences Center (TTUHSC) in a temperature- and light-controlled environment, with water and laboratory rodent diet provided ad-libitum. Male and female mice older than 7 months were used in this study. The control mice matched the background strain, age and gender of the experimental groups. All experimental procedures were approved by the TTUHSC Institutional Animal Care and Use Committee (IACUC—protocol number 18005) and the Institutional Review Board (IRB). For tissue collection, mice were killed by cervical dislocation under CO2 anesthesia in accordance with the guidelines from the American Veterinary Medical Association.
Cell culture
Normal human colonic epithelial cell line, CCD841, was purchased from American Type Culture Collection (ATCC, Manassas, VA, U.S.A.). The cell line was cultured in RPMI 1640 (Corning, Corning, NY, U.S.A.) supplemented with 10% FBS (Fisher Scientific, Pittsburgh, PA, U.S.A.) and 1% penicillin/streptomycin (Corning, Corning, NY, U.S.A.). Viral packaging cell line, HEK293FT, was purchased from ATTC (Manassas, VA, U.S.A.) and maintained in DMEM 4.5 g/L glucose, l-glutamine, sodium pyruvate (Corning, Corning, NY, U.S.A.) supplemented with 10% FBS and 1% penicillin/streptomycin. HEK293FT cells were used for transient transfection experiments where they were cultured for three passages in the presence and absence of excess iron in the form of ferric ammonium citrate (FAC) (Sigma, St. Louis, MO, U.S.A.) [26] and then used for ectopic expression of p53.
Antibodies
Anti-ABCG2 (D5V2K XP®, #42078) and anti-p53 (1C12, #2524) monoclonal antibodies were purchased from Cell Signaling Technology (Danvers, MA, U.S.A.). Anti-β-actin (C4, sc-47778) and anti-β-tubulin (D-10, sc-5274) monoclonal antibodies were purchased from Santa Cruz Biotechnology (Dallas, TX, U.S.A.). Anti-xanthine oxidase monoclonal antibody (EPR4605, ab109235) was purchased from Abcam (Cambridge, MA, U.S.A.) and anti-GLUT9 polyclonal antibody (PA5-22966) was purchased from Thermo Fisher Scientific (Waltham, MA, U.S.A.). Horseradish peroxidase-conjugated goat anti-rabbit (#1706515) and goat anti-mouse (#1706516) were purchased from Bio-Rad Laboratories (Hercules, CA, U.S.A.).
Measurement of UA
The UA content of the intestinal tissue and serum was measured by the fluorimetry-based Uric Acid Assay Kit (Abcam, Cambridge, MA, U.S.A.), as described by the manufacturer. The UA concentration of the tissue was recorded as nmol of UA per milligram of protein, while the serum concentration was recorded as nmol of UA per ml of serum.
Measurement of serum creatinine
Creatinine concentration in serum was measured by the fluorimetry-based Creatinine Assay Kit (Biovision, Milpitas, CA, U.S.A.) as per manufacturer's protocol. The creatinine concentration was recorded as mg/dl of serum.
Measurement of uricase activity
Uricase activity in liver and colon was measured by the fluorimetry-based Amplex® Red Uric Acid/Uricase Assay Kit (Thermo Fisher Scientific, Waltham, MA, U.S.A.) as per manufacturer's protocol. Uricase activity was recorded as mU/mg protein. One unit is defined as the amount of enzyme that will convert 1 µmole of uric acid to allantoin per min at pH 8.5 and 25°C.
Measurement of XO activity
XO activity in liver and jejunum was measured by fluorimetry-based XO Activity Assay Kit (Sigma, St. Louis, MO, U.S.A.) as per manufacturer's protocol. XO activity was recorded as nmol of H2O2 generated per minute per milligram of protein.
RNA isolation and quantitative PCR
Total RNA from animal tissues and cultured cells was extracted using TRIzol reagent (Thermo Fisher Scientific, Waltham, MA, U.S.A.). RNA purity and concentration were quantified using NanoDrop Spectrophotometer 2000 (Thermo Fisher Scientific, Waltham, MA, U.S.A.). An amount of 2 µg of RNA was reverse transcribed into cDNA using the SuperScript III First-Strand cDNA synthesis kit (Thermo Fisher Scientific, Waltham, MA, U.S.A.). Relative mRNA levels were measured with StepOne Plus real-time PCR system (Applied Biosystems, Foster City, CA, U.S.A.) using the SYBR® Green supermix (Bio-Rad Laboratories, Hercules, CA, U.S.A.), and were normalized to the housekeeping gene HGPRT (hypoxanthine/guanine phosphoribosyl transferase). The PCR primer sequences are given in Supplementary Table S1.
Protein isolation and Western blot
For whole tissue/cell extract preparation, tissues and cells were lysed in Pierce™ RIPA buffer (Thermo Fisher Scientific, Waltham, MA, U.S.A.) supplemented with Halt™ Protease and Phosphatase Inhibitor Cocktail (Thermo Fisher Scientific, Waltham, MA, U.S.A.). Homogenates were centrifuged, and supernatants were used for protein measurement via Pierce™ BCA Protein Assay Kit (Thermo Fisher Scientific, Waltham, MA, U.S.A.). Western blot samples were prepared in Laemmli Sample Buffer (Bio-Rad Laboratories, Hercules, CA, U.S.A.). They were loaded onto a 10% SDS–polyacrylamide gel electrophoresis (SDS–PAGE) gel and transferred onto a PVDF membrane (Bio-Rad Laboratories, Hercules, CA, U.S.A.). The membrane was blocked, and antibodies diluted in 5% nonfat dry milk (Bio-Rad Laboratories, Hercules, CA, U.S.A.) or in 5% bovine serum albumin (Irvine Scientific, Santa Ana, CA, U.S.A.) were used. Protein bands were visualized using Pierce™ ECL Western Blotting Substrate (Thermo Fisher Scientific, Waltham, MA, U.S.A.) and developed on the autoradiography film (Santa Cruz, Dallas, TX, U.S.A.).
Isolation of ileal and colonic mucosal epithelial cells
Ileum and colon were cut open longitudinally, washed with ice-cold phosphate-buffered saline and placed on an ice-cold glass surface with the lumen side facing up. The epithelium was mechanically detached and collected by scraping with the glass slide. Samples were centrifuged and the pellet was used for further analysis.
Lentiviral transfection
Construct for shRNA to degrade p53 mRNA (pLKO-p53-shRNA-427; Addgene plasmid # 25636) was created by Todd Waldman laboratory and purchased from Addgene plasmid repository (Watertown, MA, U.S.A.) [27]. pLKO.1 empty vector was used as a control. To generate transient virus stock, HEK293FT cells were plated in 10-cm dish and allowed to reach 100% confluency. An amount of 7.5 µg of control, shRNA vector, and packaging plasmids (PLP1, PLP2, and VSVG) were delivered to the cells using Lipofectamine-2000 reagent (Thermo Fisher Scientific, Waltham, MA, U.S.A.). Forty-eight hours after transient transfection, the virus-containing medium was harvested, centrifuged and filtered to generate virus stock. CCD841 cells were seeded in six-well plates; they were at 50% confluency on the day of the infection. Virus stock contained 8 µg/ml of polybrene to increase the transduction efficacy. Forty-eight hours after infection, desired clones were selected by administration of puromycin (1 µg/ml).
Chromatin immunoprecipitation assay
ChIP assays were performed using EZ-Magna ChIP A/G kit (Millipore, Burlington, MA, U.S.A.) according to the manufacturer's instructions. Briefly, cells were cross-linked with 1% formaldehyde, collected in phosphate-buffered saline supplemented with Halt™ Protease and Phosphatase Inhibitor Cocktail (Thermo Fisher Scientific, Waltham, MA, U.S.A.) and lysed in nuclear lysis buffer. The lysate was then sonicated using BioRuptor Plus (Diagenode, Denville, NJ, U.S.A.) to shear DNA into fragments of ∼200–1000 base pairs. DNA concentration was measured using NanoDrop Spectrophotometer 2000 (Thermo Fisher Scientific, Waltham, MA) and 25 µg of DNA was used for immunoprecipitation with anti-p53 antibody or normal mouse IgG. Before immunoprecipitation, 1% of the supernatant was removed as an input. DNA was isolated on the column and relative enrichment of p53 on hABCG2 gene promoter was assessed via real-time quantitative PCR. The PCR primer sequences are provided in Supplementary Table S1.
Transient transfection
Construct for wild-type p53 (pcDNA3 p53 WT; Addgene plasmid # 69003) was purchased from Addgene plasmid repository (Watertown, MA, U.S.A.) [28]. pcDNA3 empty vector was used as a control. HEK293FT cells were cultured first for three passages in the absence or presence of FAC (250 μg/ml) and then used for transient ectopic expression of p53. Control and iron-overloaded cells were plated in six-well plates and allowed to reach 80–90% confluency. An amount of 2.5 µg of control and p53 WT plasmids were delivered to the cells using Lipofectamine-3000 reagent (Thermo Fisher Scientific, Waltham, MA, U.S.A.). Ferric ammonium citrate was absent during the transfection step, but was added to the culture medium after that step. Forty-eight hours 48 h later, RNA and protein lysates were prepared.
Statistical analysis
Experiments were repeated at least three times. The data shown are representative results of the means ± SEM. Statistical analyses and graphing were performed using GraphPad Prism 7.01 software. Statistical differences between control and experimental groups were analyzed by a two-tailed, unpaired Student's t-test for single comparison. Differences were judged statistically significant when the P value <0.05.
Results
Hfe−/− mouse exhibits hyperuricemia
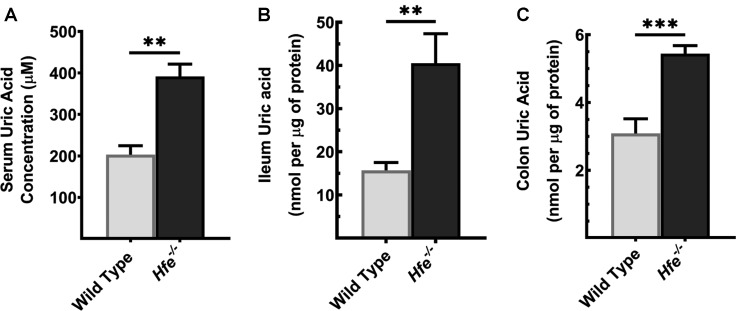
To assess if HH leads to the development of hyperuricemia, we measured systemic and organ-specific UA concentration in Hfe−/− mice. We found that, when compared with the wild type, Hfe−/− mice had elevated UA in the circulation (Figure 1A). As the large intestine and mid-to-distal parts of the small intestine are involved in UA homeostasis, contributing to at least 40% to total UA excretion, we monitored UA levels in Hfe−/− intestine. Compared with the control, Hfe−/− ileum (Figure 1B) and colon (Figure 1C) had a significantly higher accumulation of UA.
Figure 1. Systemic and organ-specific accumulation of UA in Hfe−/− mice.
UA concentration was measured in (A) serum, (B) ileum, and (C) colon in Hfe−/− mice and their wild-type counterparts using UA Assay Kit. Mice used in the study were 14-months old. Data show mean values of three mice per group ± SEM. **P < 0.01, ***P < 0.001.
Besides the intestinal tract, UA is excreted by the kidneys [29]; as such, renal dysfunction is also a significant determinant of circulating levels of UA. Therefore, we investigated if the observed UA accumulation in serum was due to the impaired glomerular filtration in HH. We estimated the glomerular filtration rate in wild-type mice and Hfe−/− mice in an indirect manner by measuring the concentration of creatinine in circulation. If the body weight is comparable between the two groups, creatinine levels in blood serve as a surrogate for glomerular filtration rate. For this, we used only male mice; mice in both genotype groups had comparable body weight (Supplementary Figure S1A). We found that the serum creatinine levels did not differ between the two groups (Supplementary Figure S1B), suggesting that there is no difference in glomerular filtration rate between wild type and Hfe−/− mice (males, 7-month-old).
Uricase expression and activity in wild type and Hfe−/− mice
The hyperuricemia in Hfe−/− mice can be due to overproduction, degradation, or underexcretion of UA, or a combination of some or all. To discern the underlying mechanism of UA elevation, we first investigated the expression and activity of uricase (also called urate oxidase), an enzyme that oxidizes UA into allantoin in rodents, but is absent from humans and other higher primates due to the non-functional pseudogene [30]. Quantitative PCR analyses showed no significant difference in the mRNA expression of uricase between two genotypes (Supplementary Figure S2A). In addition, deletion of Hfe gene did not alter uricase activity (Supplementary Figure S2B).
Increased enzymatic activity of xanthine oxidase in Hfe−/− mouse
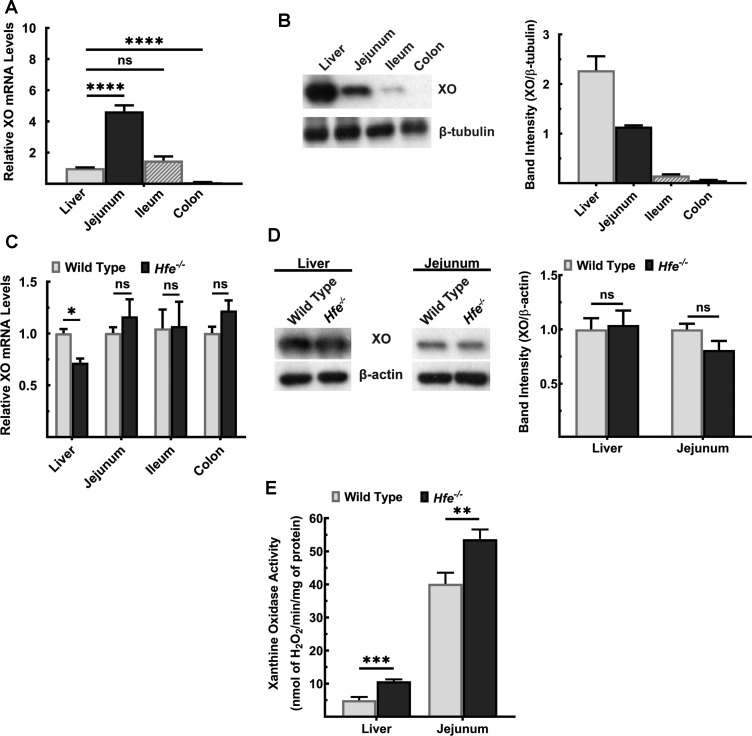
Next, we investigated the expression levels and the activity of xanthine oxidase (XO), the enzyme that catalyzes the terminal reaction in UA synthesis [31]. XO is expressed in mouse liver and small intestine, with the highest levels present in jejunum (Figure 2A). On the protein level, however, XO was most abundant in liver; its levels were much less in the intestinal tract and it decreased aborally (Figure 2B). This expression pattern did not differ between wild type and Hfe−/− mice, except for liver, where XO mRNA decreased in Hfe−/− mice (Figure 2C,D). Since XO active site contains molybdenum and iron as cofactors [32], we pondered whether excess iron alters XO enzyme activity. We measured XO enzymatic activity in liver and jejunum of wild type and Hfe−/− mice. We found a significant increase in XO activity in Hfe−/− liver and jejunum (Figure 2E).
Figure 2. Activity of XO, but not its expression, is significantly increased in Hfe−/− mouse liver and small intestine.
(A) Quantitative PCR analysis of XO mRNA in liver and intestinal segments of wild-type mouse. Data show mean values ± SEM relative to liver, which is taken as 1. ****P < 0.0001; ns, not significant. (B) Western blot for XO protein levels in liver and intestinal segments of wild-type mouse. Western blot band intensities were estimated using ImageJ software and the band intensities were normalized to the respective β-tubulin band intensities. Please see Supplementary Figures S4 and S5 for full blot images. (C) Quantitative PCR analysis of XO mRNA in liver, jejunum, ileum, and colon of Hfe−/− mice and wild-type mice. Data show mean values of three mice per group ± SEM relative to control mice. *P < 0.05. (D) Western blot for XO protein levels in Hfe−/− and wild-type liver and jejunum. Western blot band intensities were estimated using ImageJ software and the band intensities were normalized to the respective β-actin band intensities. Please see Supplementary Figure S6–S9 for full blot images. (E) XO activity in wild type and Hfe−/− mice. Data show the mean of three mice per group ± SEM. **P < 0.01; ***P < 0.001.
Glut9 and Mrp4 expression in Hfe−/− mouse
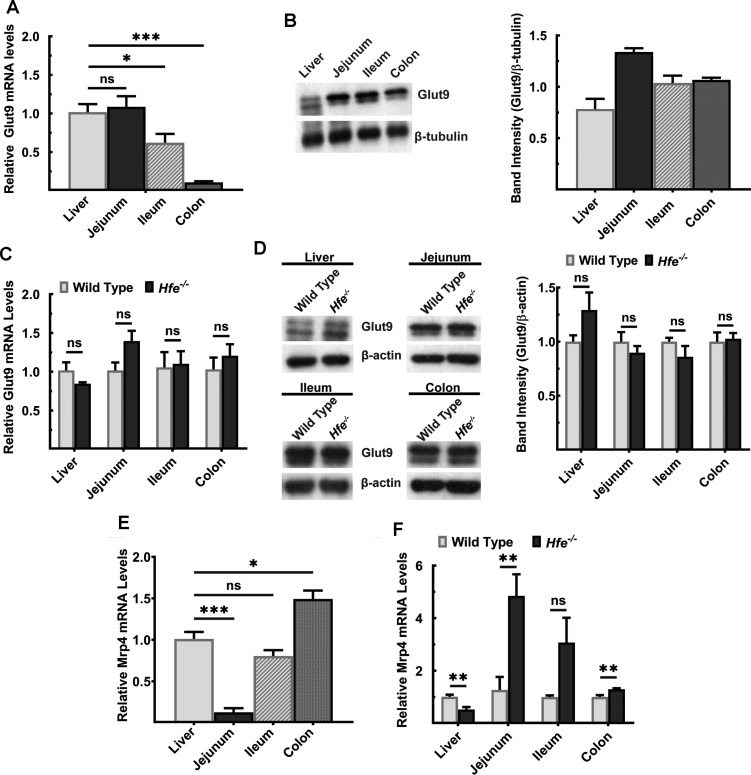
We then monitored the expression levels of the transporters that are involved in absorption and excretion of UA in liver and intestine in wild type and Hfe−/− mice. We first focused on two transporters: a passive, bidirectional UA carrier GLUT9 (also known as SLC2A9) and an ATP-dependent unidirectional UA exporter MRP4 (ABCC4). These transporters are expressed on apical and basolateral membranes in hepatocytes and enterocytes [33]. Glut9 mRNA expression was comparable between liver and jejunum of the wild-type mice, but it was significantly lower in ileum and colon (Figure 3A). On the contrary, protein levels differed significantly, with Glut9 primarily detectable in the intestinal tract (Figure 3B). More relevant to the current study is the finding that deletion of Hfe did not influence the levels of Glut9 mRNA or protein (Figure 3C,D). Mrp4 was expressed highly in liver and colon; its expression increased aborally in the intestinal tract (Figure 3E). When compared with wild-type mice, Mrp4 mRNA levels were lower in the liver, but significantly higher in the jejunum and colon of Hfe−/− mice (Figure 3F).
Figure 3. Expression of Glut9 and MRP4 in wild type and Hfe−/− mouse liver and intestinal tract.
(A) Quantitative PCR analysis of Glut9 mRNA in liver and intestinal segments of wild-type mouse. Data show mean values ± SEM relative to liver, which is taken as 1. *P < 0.05; ***P < 0.001. (B) Western blot for Glut9 protein levels in liver and intestinal segments of the wild-type mouse. Western blot band intensities were estimated using ImageJ software and the band intensities were normalized to the respective β-tubulin band intensities. Please see Supplementary Figures S5 and S10 for full blot images. (C) Quantitative PCR of Glut9 mRNA in liver, jejunum, ileum, and colon of Hfe−/− mice and wild-type mice. Data show mean values of three mice per group ± SEM relative to control mice. (D) Western blot for Glut9 protein levels in Hfe−/− mouse and wild-type mouse liver, jejunum, ileum, and colon. Western blot band intensities were estimated using ImageJ software and the band intensities were normalized to the respective β-actin band intensities. Please see Supplementary Figures S8, S9, and S11 for full blot images. (E) Quantitative PCR analysis of Mrp4 mRNA in liver and intestinal segments of wild-type mouse. Data show mean values ± SEM relative to liver, which is taken as 1. *P < 0.05; ***P < 0.001. (F) Quantitative PCR analysis of Mrp4 mRNA in liver, jejunum, ileum, and colon of Hfe−/− mice and wild-type mice. Data show mean values of three mice per group ± SEM relative to control mice. **P < 0.01.
Abcg2 expression in wild-type mouse and impact of Abcg2 deletion on UA in circulation
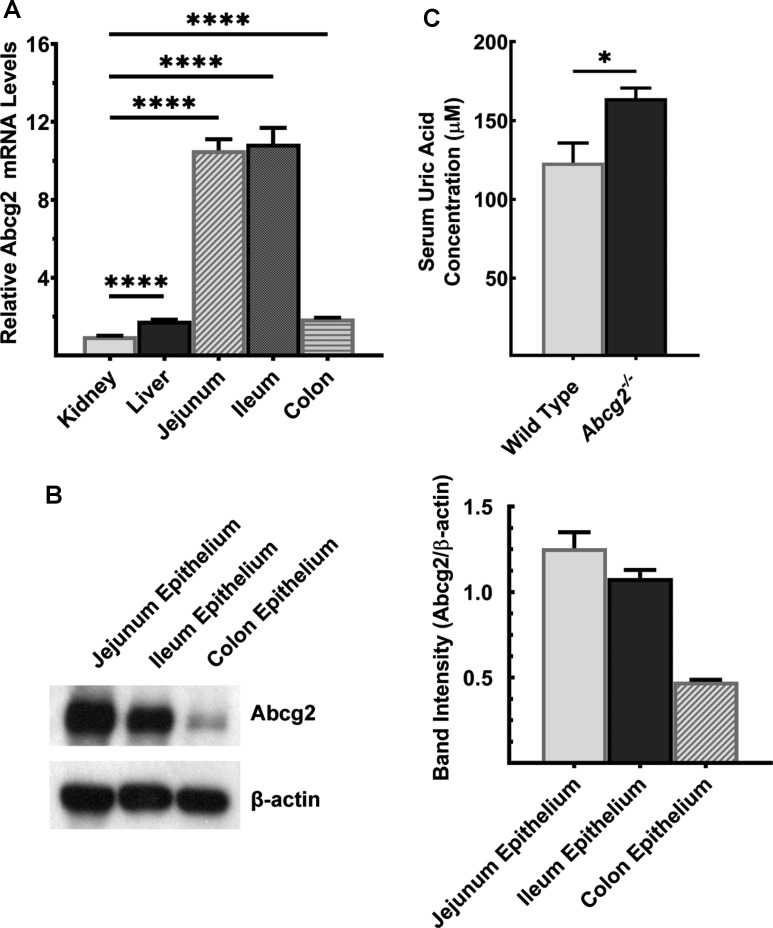
UA is a substrate for the ATP-dependent export pump ABCG2 [34]; the transporter is responsible for most of intestinal excretion of UA. Abcg2 mRNA was found in kidney, liver and intestinal tract, highest level of expression noted in jejunum and ileum (Figure 4A). Abcg2 protein was highest in jejunum, and it decreased in the intestinal tract aborally (Figure 4B). In a genome-wide association study, Woodward et al. [35] identified multiple SNPs in ABCG2 to be associated with hyperuricemia and gout. The Q141K mutation decreases the transport function of ABCG2 by ∼50% [35]. This phenomenon is phenocopied in Abcg2−/− mice, where complete deletion of Abcg2 gene resulted in elevated UA levels in circulation (Figure 4C).
Figure 4. Abcg2 is robustly expressed in mouse intestine.
(A) Quantitative PCR analysis of Abcg2 mRNA in kidney, liver, and intestinal segments of wild-type mouse. Data show mean values ± SEM relative to kidney, which is taken as 1. ****P < 0.0001. (B) Western blot for Abcg2 protein levels in intestinal segments of wild-type mouse. Western blot band intensities were estimated using ImageJ software and the band intensities were normalized to the respective β-actin band intensities. Please see Supplementary Figure S12 for a full blot image. (C) UA was measured in serum of Abcg2−/− mice and wild-type mice. Mice used in the study were 7-months old. Data show mean values of three mice per group ± SEM. *P < 0.05.
Down-regulation of Abcg2 in the intestinal tract of Hfe−/− mice
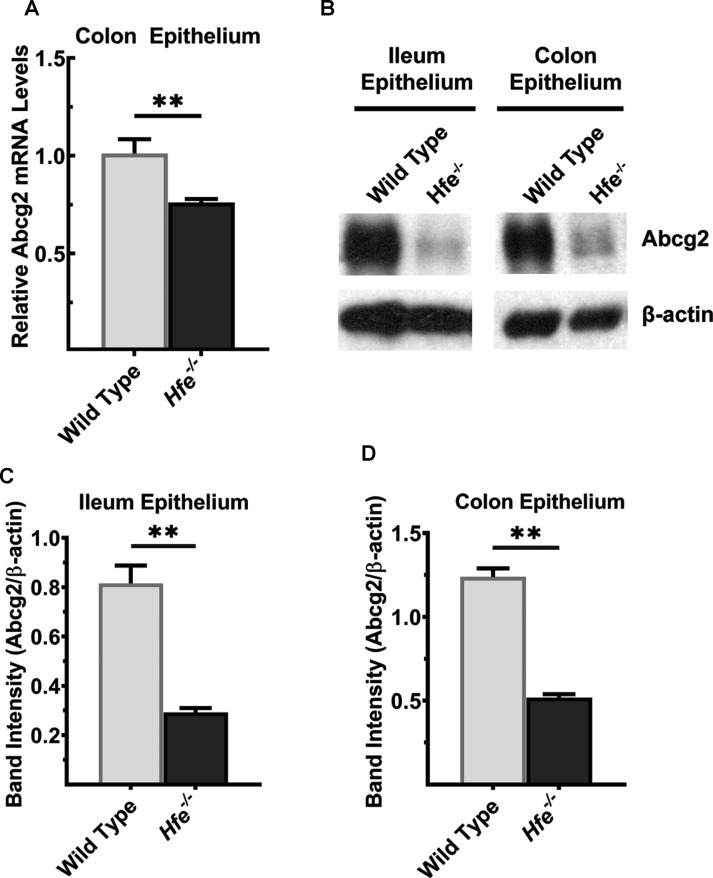
As hyperuricemia was found in Hfe−/− mice as well as in Abcg2−/− mice, we became curious about a possible connection between HFE and ABCG2. We hypothesized that Abcg2 expression is decreased in HH, thus providing a molecular basis of hyperuricemia in Hfe−/− mice. To test this hypothesis, we monitored the expression levels of Abcg2 mRNA and protein in ileum and colon between wild type and Hfe−/− mice, specifically in the mucosal epithelium. Abcg2 mRNA was significantly lower in Hfe−/− colon (Figure 5A). The Abcg2 protein levels were also lower in ileum and colon in Hfe−/− mice (Figure 5B–D). The decrease was ∼5-fold in ileum and ∼3-fold in colon.
Figure 5. Abcg2 is down-regulated in Hfe−/− mouse intestine.
(A) Quantitative PCR analysis of Abcg2 mRNA in colon epithelium of Hfe−/− mice and wild-type mice. Data show mean values of three mice per group ± SEM relative to control mice. **P < 0.01. (B) Western blot for Abcg2 protein levels in ileal and colonic epithelium from wild type and Hfe−/− mice. Please see Supplementary Figures S13 and S14 for full blot images. Western blot band intensities were estimated using ImageJ software and the band intensities that correspond to the Abcg2 protein were normalized to the respective β-actin levels in (C) ileal epithelium and (D) colonic epithelium. Data represent mean values of three mice per group ± SEM. **P < 0.01.
p53-mediated transcriptional regulation of ABCG2
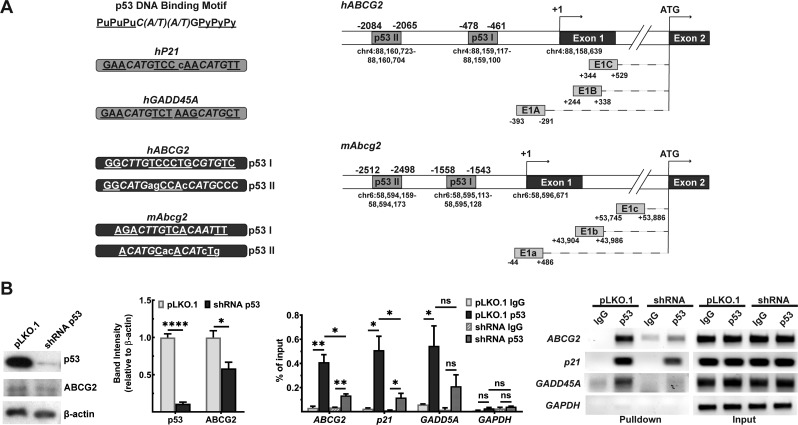
The follow-up question that needed to be answered was: what is the mechanism underlying the Abcg2 down-regulation in HH mouse? 5′-UTR of hABCG2 and mAbcg2 is located in exon1 and is alternatively spliced to translation start site in exon 2. There are at least 3 splice variants found in both species, which results from alternative promoter usage [36]. Colon hABCG2 expresses all three isoforms [37], while mAbcg2 variants are primarily investigated in hematopoietic stem cells [38]. Analysis of the 5′-UTRs of human ABCG2 and mouse Abcg2 5′ revealed binding sites for p53 (Figure 6A). To test if the interaction between ABCG2 promoter and p53 occurs in cells, we performed ChIP assay. Experiment was conducted in the normal human colonic epithelial cell line, CCD841. We generated lentiviral transfectants to silence p53 via shRNA, while empty vector was used as a control; we noted a marked decrease in ABCG2 protein levels when p53 was silenced (Figure 6B). If p53 binds to ABCG2 promoter, the contact between the protein and the promoter would be lower in the shRNA-silenced cell line. We used a specific antibody to pull down p53, and performed quantitative PCR using primers specific for the hABCG2 promoter with p53 pulldown. This analysis revealed significant enrichment of ABCG2 promoter in the p53 pulldown. The opposite trend was observed in the shRNA-silenced cell line. When p53 protein levels were lowered, the enrichment was significantly reduced (Figure 6B). The validity and dependability of the method were supported by observations that the pulldown of the p21 and GADD45A, the prototypical targets for p53, was also decreased in cells where p53 was silenced (Figure 6B).
Figure 6. ChIP analysis of p53 binding to human ABCG2 gene promoter.
(A) p53 consensus sequences in hABCG2 and mAbcg2 gene promoters as assessed with JASPAR software. A putative transcription start site (+1) was recognized at the start of the exon 1. Chromosomal locations for this transcription start site and also for p53 consensus sequences are shown. E1A or E1a, E1B or E1b, and E1C or E1c depict the transcript splice variants found in human ABCG2 gene or mouse Abcg2 gene, which result from the alternative promoter usage. (B) ChIP analysis for binding of p53 to the hABCG2 promoter. Experiment was performed in normal human epithelial cell line CCD841 transfected with either empty vector (pLKO.1) or a vector containing shRNA that targets p53 mRNA. shRNA efficiency was estimated by observing p53 protein levels via Western blot. Please see Supplementary Figures S15–S21 for full blot and agarose gel images. Data show the mean values of three independent experiments ± SEM. *P < 0.05; **P < 0.01.
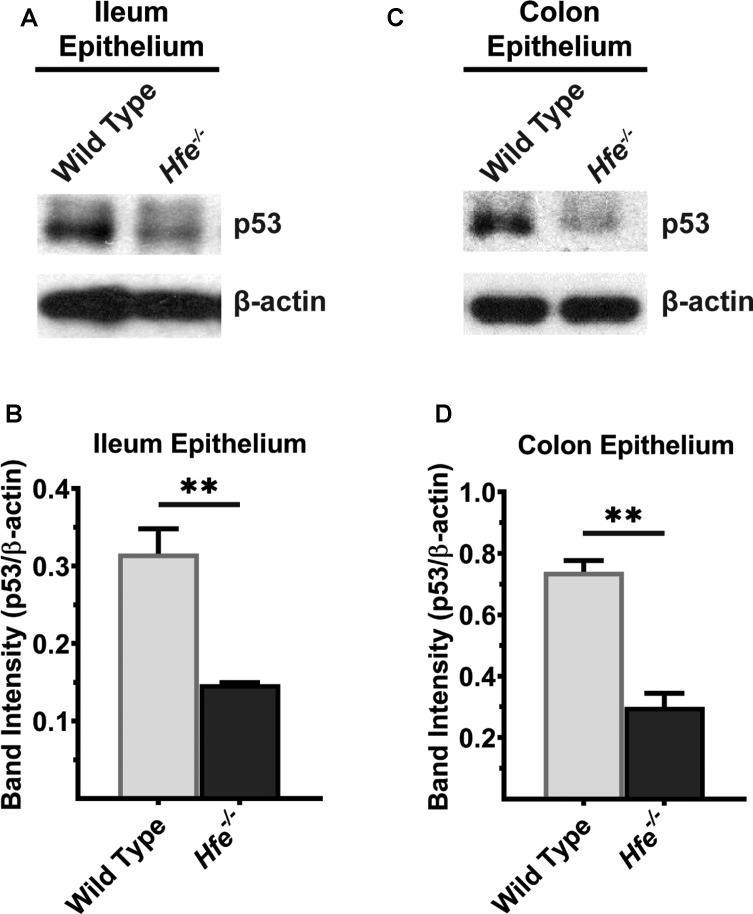
Recent studies have shown that p53 is a heme-binding protein and that p53-heme complex is exported out of nucleus for subsequent proteasomal degradation [39]. This suggested that heme accumulation as occurs in HH might lead to down-regulation of p53 in Hfe−/− mice. Therefore, we hypothesized that decreased expression of p53 is responsible for decreased expression of Abcg2 in Hfe−/− mice. We collected ileal and colonic mucosa of wild type and Hfe−/− mice and performed Western blot to compare p53 protein levels between two genotypes. We found that p53 protein was significantly lower in Hfe−/− ileum than in wild-type controls (Figure 7A); the reduction was ∼4-fold compared with the control (Figure 7B). The same was true in Hfe−/− colon (Figure 7C,D).
Figure 7. p53 protein levels are significantly decreased in Hfe−/− mouse ileum and colonic epithelium.
Western blot for p53 protein in (A) ileal and (C) colonic epithelium of wild type and Hfe−/− mice. Please see Supplementary Figures S13 and S14 for full blot images. Western blot band intensities were estimated using ImageJ software and the band intensities that correspond to p53 protein were normalized to β-actin levels in (B) ileal epithelium and (D) colonic epithelium. Data represent mean values of three mice per group ± SEM. **P < 0.01.
Effect of p53 reconstitution on FAC-induced decrease in ABCG2 expression
Our studies show that chronic exposure to iron in colonic epithelial cells decreases p53 protein with subsequent decrease in ABCG2 mRNA. To confirm these findings Furthermore, we reconstituted p53 in FAC-exposed cells via ectopic expression to see if it would restore ABCG2 mRNA levels. Initial experiments with FAC-exposed CCD841 cells for ectopic expression of p53 failed due to low transfection efficiency. Therefore, we used HEK293FT cells, which exhibit robust transfection efficiency. We first exposed these cells to FAC (250 μg/ml) for three passages. Control and FAC-exposed cells were then used for transient ectopic expression of p53. FAC was omitted during transfection. We then monitored p53 protein levels (Western blot) and ABCG2 mRNA levels (qRT-PCR) in control and FAC-exposed cells with and without ectopic expression of p53. We observed decreased p53 protein in FAC-exposed cells compared with control cells (Supplementary Figure S3A). Under these conditions, we also observed the down-regulation of ABCG2 mRNA (Supplementary Figure S3B). Ectopic expression of p53 reconstituted this protein, both in control and FAC-exposed cells (Supplementary Figure S3A), which led to a significant recovery of ABCG2 mRNA in FAC-exposed cells (Supplementary Figure S3B). These data confirm that the decrease in ABCG2 mRNA in FAC-exposed cells is indeed due to decreased levels of p53 protein.
Discussion
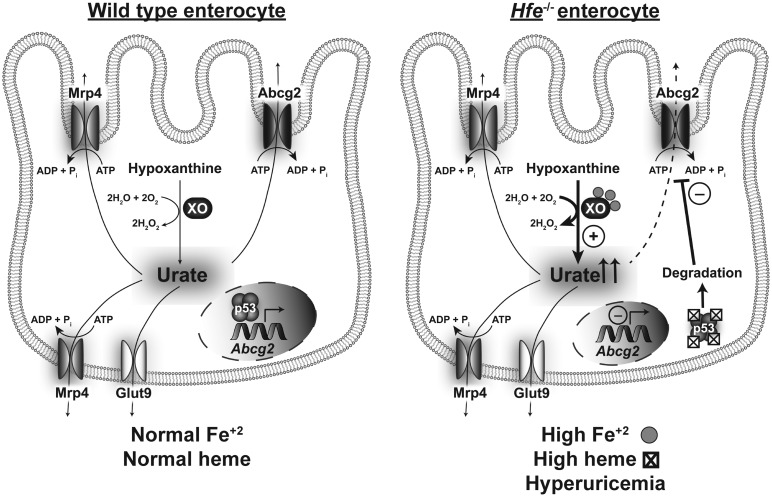
In the present study, we focused on the relationship between hereditary hemochromatosis (HH) and uric acid (UA) homeostasis. The findings and implications of the present study can be summarized as follows (Figure 8). Deletion of the iron-regulatory protein Hfe causes hyperuricemia, and its origin is multifactorial. Under conditions of iron overload as occurs in HH, xanthine oxidase, which generates UA as the final step in the catabolism of purine bases, becomes more active, possibly leading to increased production of UA. In addition, the expression of the UA transporter repertoire changes significantly in the liver and intestinal tract, likely altering transmembrane transport of UA involved in removal of UA from the cells and excretion of UA into intestinal lumen. In our opinion, the most significant finding of the present study is the marked decrease in the expression of the UA exporter Abcg2 in the intestinal tract in HH. This transporter is known to be responsible for ∼40% excretion of UA from the body; as such, the decreased expression of this transporter in HH is probably the major contributor to HH-associated hyperuricemia. Based on this conclusion, we investigated the molecular events underlying the down-regulation of ABCG2 in HH. We showed that ABCG2 is a direct target for the tumor suppressor p53 and that the protein levels of p53 are profoundly decreased in HH. We have established the regulation of ABCG2 expression by p53 via ChIP that showed binding of p53 to hABCG2 gene promoter. We also showed that HH is associated with increased accumulation of heme in epithelial cells lining the ileum and colon; this is relevant to the decrease in p53 protein levels in HH. Studies by others have shown that p53 is a heme-binding protein and that p53-heme complex is a substrate for proteasomal degradation [39]. There is however some discordance between Abcg2 mRNA levels and Abcg2 protein levels in the Hfe−/− intestine; the decrease in mRNA is much less pronounced than the decrease in protein. Even though this could be explained by the often observed finding that mRNA levels do not always correspond to protein levels, the possibility of additional transcriptional control of Abcg2 in HH by factors other than p53 cannot be excluded. The transcription factor Nrf2 is a likely candidate; Nrf2 is known to induce hABCG2 transcription [6], and the activity of this transcription factor is increased by oxidative stress as occurs under iron-overload conditions such as HH. Taken collectively, the results of the present study show that hemochromatosis is associated with elevated levels of UA and the iron/heme-p53-ABCG2 axis plays a critical role in this phenomenon. As arthritis is a common pathological symptom in patients with HH, the findings of the current study have profound clinical implications because they underscore the potential involvement of hyperuricemia in the pathogenesis of HH-associated arthropathy.
Figure 8. Schematic illustration of the differences in intestinal handling of uric acid between wild type and Hfe−/− enterocytes.
In contrast with the findings in our study which showed p53 as an inducer of ABCG2 expression, Wang et al. [40] have reported that p53 is a suppressor of ABCG2 expression, not directly but indirectly by decreasing the levels of NFκB. Our studies have shown a direct effect of p53 on ABCG2 expression as documented by the binding of p53 on hABCG2 gene promoter. The discrepancy between the two studies is most likely related to potential differences in the expression levels and activity status of NFκB in tissues and cell lines employed.
MRP4 has been shown to be an ATP-dependent urate exporter in a heterologous expression system using HEK293 cells [41]; however, the extent of its involvement in the maintenance of UA homeostasis in vivo in humans is not known. Although in experimental animals, knockdown of Mrp4 in kidneys cause reduction in urate export [42], there is no significant association between the MRP4 gene polymorphism and hyperuricemia and gout occurrence in humans [43]. The only study reported in the literature on any potential association between MRP4 and UA homeostasis is that by Tanner et al. [44]. This study analyzed MRP4 gene polymorphism in the settings of hyperuricemia and gout. It was found that amongst the 39 MRP4 SNPs, only rs4148500 correlated with the hyperuricemia and gout; however, the molecular mechanism for the correlation was not explored. In the present study, we found a dramatic increase in Mrp4 mRNA levels in Hfe−/−mouse intestine, but the significance of this finding remains to be investigated. It is possible that the increase in the expression of MRP4 represents an attempt to maintain UA homeostasis as a feedback response to the down-regulation of ABCG2 and the resultant increase UA levels.
To the best of our knowledge, studies by Flais et al. [45] is the only report in published literature that addressed hyperuricemia in HH. These investigators found that in a large cohort of patients who harbored C282Y mutation in HFE, hyperferritinemia (an evidence for iron overload) was associated with hyperuricemia occurrence. Our results are also consistent with the cross-sectional studies conducted in patients with excessive iron accumulation and hyperferritinemia where iron overload was not of a genetic origin as in HH. In these studies, increase in serum ferritin concentrations correlated positively with the increase in UA levels, and the association was independent of gender, race, age, body mass index, and alcohol consumption [46]. The same trend was seen amongst obese adolescents, irrespective of their body mass index [47]. However, these reports did not focus on the causal relationship between iron overload and hyperuricemia. In this regard, the present study is novel, because besides directly demonstrating elevated UA levels in the Hfe−/− mouse model of HH, it provides a molecular mechanism for hyperuricemia in HH.
Does the elevation in UA in HH have a beneficial effect or pathological effect? This question arises because of the dual role of UA, functioning both as an antioxidant and a pro-inflammatory agent. We opine that hyperuricemia in HH is detrimental because of the co-occurrence of free iron. UA is a chelator of iron, and free iron facilitates crystallization of MSU [48]. Besides its deposition in joints, triggering excruciating acute and chronic flares characterized in gout, MSU crystallization is associated with the development of metabolic syndrome [49], cardiovascular diseases [50], liver failure [51], and kidney failure [52]. Occurrence of these maladies is common in HH patients; therefore, our study suggests a plausible connection between hyperuricemia and the afore-mentioned broad-spectrum of organ dysfunction in HH.
In conclusion, circulating levels of UA are increased significantly in HH, potentially contributing to the known increased incidence of arthritis in this genetic disorder. Our studies uncover at least two molecular mechanisms for this HH-associated hyperuricemia, namely increased generation of UA due to increased enzymatic activity of xanthine oxidase in the liver and intestine, and decreased intestinal excretion of UA due to decreased expression of the UA exporter Abcg2 in the intestinal tract.
Abbreviations
- ChIP
chromatin immunoprecipitation
- FAC
ferric ammonium citrate
- FBS
fetal bovine serum
- HH
hereditary hemochromatosis
- MSU
monosodium urate
- ROS
reactive oxygen species
- UA
uric acid
- XO
xanthine oxidase
Competing Interests
The authors declare that there are no competing interests associated with the manuscript.
Funding
This work was supported by the National Institutes of Health grant R41 AR074854 and the Welch Endowed Chair in Biochemistry, Grant No. BI-0028, at Texas Tech University Health Sciences Center.
Open Access
Open access for this article was enabled by the participation of Texas Tech University Health Sciences Center in an all-inclusive Read & Publish pilot with Portland Press and the Biochemical Society.
Author Contribution
B.R. performed most of the experiments; S.S. and M.N. made significant contribution in some experiments; V.G. designed the study and interpreted the data; V.G. and B.R. wrote the manuscript.
Supplementary Material
References
- 1.So A. and Thorens B. (2010) Uric acid transport and disease. J. Clin. Invest. 120, 1791–1799 10.1172/JCI42344 [DOI] [PMC free article] [PubMed] [Google Scholar]
- 2.Fatima T., McKinney C., Major T.J., Stamp L.K., Dalbeth N., Iverson C. et al. (2018) The relationship between ferritin and urate levels and risk of gout. Arthritis Res. Ther. 20, 179 10.1186/s13075-018-1668-y [DOI] [PMC free article] [PubMed] [Google Scholar]
- 3.Desideri G., Castaldo G., Lombardi A., Mussap M., Testa A., Pontremoli R. et al. (2014) Is it time to revise the normal range of serum uric acid levels? Eur. Rev. Med. Pharmacol. Sci. 18, 1295–1306 PMID: [PubMed] [Google Scholar]
- 4.So A.K. and Martinon F. (2017) Inflammation in gout: mechanisms and therapeutic targets. Nat. Rev. Rheumatol. 13, 639–647 10.1038/nrrheum.2017.155 [DOI] [PubMed] [Google Scholar]
- 5.Desai J., Steiger S. and Anders H.J. (2017) Molecular pathophysiology of gout. Trends Mol. Med. 23, 756–768 10.1016/j.molmed.2017.06.005 [DOI] [PubMed] [Google Scholar]
- 6.Ristic B., Sikder O.M.F., Bhutia Y.D. and Ganapathy V. (2020) Pharmacologic inducers of the uric acid exporter ABCG2 as potential drugs for treatment of gouty arthritis. Asian J. Pharm. Sci. 10.1016/j.ajps.2019.10.002 [DOI] [PMC free article] [PubMed] [Google Scholar]
- 7.Dabbagh A.J., Trenam C.W., Morris C.J. and Blake D.R. (1993) Iron in joint inflammation. Ann. Rheum. Dis. 52, 67–73 10.1136/ard.52.1.67 [DOI] [PMC free article] [PubMed] [Google Scholar]
- 8.Winterbournn C.C. (1995) Toxicity of iron and hydrogen peroxide: the Fenton reaction. Toxicol. Lett. 82/83, 969–974 10.1016/0378-4274(95)03532-X [DOI] [PubMed] [Google Scholar]
- 9.Morris C.J., Earl J.R., Trenam C.W. and Blake D.R. (1995) Reactive oxygen species and iron–a dangerous partnership in inflammation. Int. J. Biochem. Cell Biol. 27, 109–122 10.1016/1357-2725(94)00084-O [DOI] [PubMed] [Google Scholar]
- 10.Kra S.J., Hollingsworth J.W. and Finch S.C. (1965) Arthritis with synovial iron deposition in a patient with hemochromatosis. N. Engl. J. Med. 272, 1268–1271 10.1056/NEJM196506172722404 [DOI] [PubMed] [Google Scholar]
- 11.Merryweather-Clarke A.T., Pointon J.J., Shearman J.D. and Robson K.J.H. (1997) Global prevalence of putative haemochromatosis mutations. J. Med. Genet. 34, 275–278 10.1136/jmg.34.4.275 [DOI] [PMC free article] [PubMed] [Google Scholar]
- 12.Adams P.C. (2015) Epidemiology and diagnostic testing for hemochromatosis and iron overload. Int. J. Lab. Hem. 37, 25–30 10.1111/ijlh.12347 [DOI] [PubMed] [Google Scholar]
- 13.Pietrangelo A. (2010) Hereditary hemochromatosis: pathogenesis, diagnosis, and treatment. Gastroenterology 139, 393–408 10.1053/j.gastro.2010.06.013 [DOI] [PubMed] [Google Scholar]
- 14.Feder J.N., Gnirke A., Thomas W., Tsuchihashi Z., Ruddy D.A., Basava A. et al. (1996) A novel MHC class I-like gene is mutated in patients with hereditary haemochromatosis. Nat. Genet. 13, 399–408 10.1038/ng0896-399 [DOI] [PubMed] [Google Scholar]
- 15.Wu X., Wang Y., Wu Q., Cheng W., Liu W., Zhao Y. et al. (2014) HFE interacts with the BMP type I receptor ALK3 to regulate hepcidin expression. Blood 124, 1355–1343 10.1182/blood-2014-01-552281 [DOI] [PMC free article] [PubMed] [Google Scholar]
- 16.Bridle K.R., Frazer D.M., Wilkins S.J., Dixon J.L., Purdie D.M., Crawford D.H.G. et al. (2003) Disrupted hepcidin regulation in HFE-associated haemochromatosis and the liver as a regulator of body iron homoeostasis. Lancet 361, 669–673 10.1016/S0140-6736(03)12602-5 [DOI] [PubMed] [Google Scholar]
- 17.Nemeth E., Tuttle M.S., Powelson J., Vaughn M.B., Donovan A., Ward D.M. et al. (2004) Hepcidin regulates cellular iron efflux by binding to ferroportin and inducing its internalization. Science 306, 2090–2093 10.1126/science.1104742 [DOI] [PubMed] [Google Scholar]
- 18.Schumacher H.R., Jr (1998) Arthropathy in hemochromatosis. Hosp. Pract. (1995) 33, 81–86 10.1080/21548331.1998.11443654 [DOI] [PubMed] [Google Scholar]
- 19.McDonnell S.M., Preston B.L., Jewell S.A., Barton J.C., Edwards C.Q., Adams P.C. et al. (1999) A survey of 2,851 patients with hemochromatosis: symptoms and response to treatment. Am. J. Med. 106, 19–24 10.1016/S0002-9343(99)00120-5 [DOI] [PubMed] [Google Scholar]
- 20.Ross J.M., Kowalchuk R.M., Shaulinsky J., Ross L., Ryan D. and Phatak P.D. (2003) Association of heterozygous hemochromatosis C282Y gene mutation with hand osteoarthritis. J. Rheumatol. 30, 121–125 PMID: [PubMed] [Google Scholar]
- 21.Timms A.E., Sathananthan R., Bradbury L., Athanassou N.A., Wordsworth B.P. and Brown M.A. (2002) Genetic testing for haemochromatosis in patients with chondrocalcinosis. Ann. Rheum. Dis. 61, 745–747 10.1136/ard.61.8.745 [DOI] [PMC free article] [PubMed] [Google Scholar]
- 22.Willis G., Scott D.G., Jennings B.A., Smith K., Bukhari M. and Wimperis J.Z. (2002) HFE mutations in an inflammatory arthritis population. Rheumatology (Oxford) 41, 176–179 10.1093/rheumatology/41.2.176 [DOI] [PubMed] [Google Scholar]
- 23.Rovetta G., Grignolo M.C., Buffrini L. and Monteforte P. (2002) Prevalence of C282Y mutation in patients with rheumatoid arthritis and spondylarthritis. Int. J. Tissue. React. 24, 105–109 PMID: [PubMed] [Google Scholar]
- 24.Lambert R.E. (2001) Iron storage diseases In Kelley's Textbook of Rheumatology, 6th edn (Ruddy S., Harris E.D. and Sledge C.B., eds), pp. 1559–1565, WB Saunders, Philadelphia [Google Scholar]
- 25.Brighton C.T., Bigley E.C. Jr and Smolenski B.I. (1970) Iron-induced arthritis in immature rabbits. Arthritis Rheum. 13, 849–857 10.1002/art.1780130615 [DOI] [PubMed] [Google Scholar]
- 26.Bhutia Y.D., Ogura J., Grippo P.J., Torres C., Sato T., Wachtel M. et al. (2020) Chronic exposure to excess iron promotes EMT and cancer via p53 loss in pancreatic cancer. Asian J. Pharm. Sci. 10.1016/j.ajps.2020.02.003 [DOI] [PMC free article] [PubMed] [Google Scholar]
- 27.Kim J.S., Lee C., Bonifant C.L., Ressom H. and Waldman T. (2007) Activation of p53-dependent growth suppression in human cells by mutations in PTEN or PIK3CA. Mol. Cell. Biol. 27, 662–677 10.1128/MCB.00537-06 [DOI] [PMC free article] [PubMed] [Google Scholar]
- 28.Loughery J., Cox M., Smith L.M. and Meek D.W. (2014) Critical role for p53-serine 15 phosphorylation in stimulating transactivation at p53-responsive promoters. Nucleic Acids Res. 42, 7666–7680 10.1093/nar/gku501 [DOI] [PMC free article] [PubMed] [Google Scholar]
- 29.Kang D.H., Nakagawa T., Feng L., Watanabe S., Han L., Mazzali M. et al. (2002) A role for uric acid in the progression of renal disease. J. Am. Soc. Nephrol. 13, 2888–2897 10.1097/01.asn.0000034910.58454.fd [DOI] [PubMed] [Google Scholar]
- 30.Kratzer J.T., Lanaspa M.A., Murphy M.N., Cicerchi C., Graves C.L., Tipton P.A. et al. (2014) Evolutionary history and metabolic insights of ancient mammalian uricases. Proc. Natl Acad. Sci. U.S.A. 111, 3763–3768 10.1073/pnas.1320393111 [DOI] [PMC free article] [PubMed] [Google Scholar]
- 31.Pritsos C.A. (2000) Cellular distribution, metabolism and regulation of the xanthine oxidoreductase enzyme system. Chem. Biol. Interact. 1, 195–208 10.1016/s0009-2797(00)00203-9 [DOI] [PubMed] [Google Scholar]
- 32.Okamoto K., Kusano T. and Nishino T. (2013) Chemical nature and reaction mechanisms of the molybdenum cofactor of xanthine oxidoreductase. Curr. Pharmaceut. Design 19, 2606–2614 10.2174/1381612811319140010 [DOI] [PMC free article] [PubMed] [Google Scholar]
- 33.Reginato A.M., Mount D.B., Yang I. and Choi H.K. (2012) The genetics of hyperuricaemia and gout. Nat. Rev. Rheumatol. 8, 610–621 10.1038/nrrheum.2012.144 [DOI] [PMC free article] [PubMed] [Google Scholar]
- 34.Hosomi A., Nakanishi T., Fujita T. and Tamai I. (2012) Extra-renal elimination of uric acid via intestinal efflux transporter BCRP/ABCG2. PLoS ONE 7, e30456 10.1371/journal.pone.0030456 [DOI] [PMC free article] [PubMed] [Google Scholar]
- 35.Woodward O.M., Köttgen A., Coresh J., Boerwinkle E., Guggino W.B. and Köttgen M. (2009) Identification of a urate transporter, ABCG2, with a common functional polymorphism causing gout. Proc. Natl Acad. Sci. U.S.A. 106, 10338–10342 10.1073/pnas.0901249106 [DOI] [PMC free article] [PubMed] [Google Scholar]
- 36.Nakanishi T. and Ross D.D. (2012) Breast cancer resistance protein (BCRP/ABCG2): its role in multidrug resistance and regulation of its gene expression. Chin. J. Cancer. 31, 73–99 10.5732/cjc.011.10320 [DOI] [PMC free article] [PubMed] [Google Scholar]
- 37.Nakanishi T., Bailey-Dell K.J., Hassel B.A., Shiozawa K., Sullivan D.M., Turner J. et al. (2006) Novel 5′ untranslated region variants of BCRP mRNA are differentially expressed in drug-selected cancer cells and in normal human tissues: implications for drug resistance, tissue-specific expression, and alternative promoter usage. Cancer Res. 66, 5007–5011 10.1158/0008-5472.CAN-05-4572 [DOI] [PubMed] [Google Scholar]
- 38.Zong Y., Zhou S., Fatima S. and Sorrentino B.P. (2006) Expression of mouse Abcg2 mRNA during hematopoiesis is regulated by alternative use of multiple leader exons and promoters. J. Biol. Chem. 281, 29625–29632 10.1074/jbc.M606314200 [DOI] [PubMed] [Google Scholar]
- 39.Shen J., Sheng X., Chang Z., Wu Q., Wang S., Xuan Z. et al. (2014) Iron metabolism regulates p53 signaling through direct heme-p53 interaction and modulation of p53 localization, stability, and function. Cell Rep. 7, 180–193 10.1016/j.celrep.2014.02.042 [DOI] [PMC free article] [PubMed] [Google Scholar]
- 40.Wang X., Wu X., Wang C., Zhang W., Ouyang Y., Yu Y. et al. (2010) Transcriptional suppression of breast cancer resistance protein (BCRP) by wild-type p53 through the NF-kappaB pathway in MCF-7 cells. FEBS Lett. 584, 3392–3397 10.1016/j.febslet.2010.06.033 [DOI] [PubMed] [Google Scholar]
- 41.Van Aubel R.A., Smeets P.H., van den Heuvel J.J. and Russel F.G. (2005) Human organic anion transporter MRP4 (ABCC4) is an efflux pump for the purine end metabolite urate with multiple allosteric substrate binding sites. Am. J. Physiol. Renal. Physiol. 288, F327–F333 10.1152/ajprenal.00133.2004 [DOI] [PubMed] [Google Scholar]
- 42.Bataille A.M., Goldmeyer J. and Renfro J.L. (2008) Avian renal proximal tubule epithelium urate secretion is mediated by Mrp4. Am. J. Physiol. Regul. Integr. Comp. Physiol. 295, R2024–R2033 10.1152/ajpregu.90471.2008 [DOI] [PubMed] [Google Scholar]
- 43.Bobulescu I.A. and Moe O.W. (2012) Renal transport of uric acid: evolving concepts and uncertainties. Adv. Chronic Kidney Dis. 19, 358–371 10.1053/j.ackd.2012.07.009 [DOI] [PMC free article] [PubMed] [Google Scholar]
- 44.Tanner C., Boocock J., Stahl E.A., Dobbyn A., Mandal A.K. and Cadzow M. (2017) Population specific resequencing associates the ATP binding cassette subfamily C member 4 (ABCC4) gene with gout in New Zealand Ma¯ori and Pacific men. Arthritis Rheumatol. 69, 1461–1469 10.1002/art.40110 [DOI] [PMC free article] [PubMed] [Google Scholar]
- 45.Flais J., Bardou-Jacquet E., Deugnier Y., Coiffier G., Perdriger A., Chalès G. et al. (2017) Hyperferritinemia increases the risk of hyperuricemia in HFE-hereditary hemochromatosis. Joint Bone Spine 84, 293–297 10.1016/j.jbspin.2016.05.020 [DOI] [PubMed] [Google Scholar]
- 46.Ghio A.J., Ford E.S., Kennedy T.P. and Hoidal J.R. (2005) The association between serum ferritin and uric acid in humans. Free Radic. Res. 39, 337–342 10.1080/10715760400026088 [DOI] [PubMed] [Google Scholar]
- 47.Chen S.C.C., Huang Y.F. and Wang J.D. (2012) Hyperferritinemia and hyperuricemia may be associated with liver function abnormality in obese adolescents. PLoS ONE 7, e48645 10.1371/journal.pone.0048645 [DOI] [PMC free article] [PubMed] [Google Scholar]
- 48.Ghio A.J., Kennedy T.P., Rao G., Cooke C.L., Miller M.J. and Hoidal J.R. (1994) Complexation of iron cation by sodium urate crystals and gouty inflammation. Arch. Biochem. Biophys. 313, 215–221 10.1006/abbi.1994.1379 [DOI] [PubMed] [Google Scholar]
- 49.DeBosch B.J., Kluth O., Fujiwara H., Schürmann A. and Moley K. (2014) Early-onset metabolic syndrome in mice lacking the intestinal uric acid transporter SLC2A9. Nat. Commun. 7, 4642 10.1038/ncomms5642 [DOI] [PMC free article] [PubMed] [Google Scholar]
- 50.Wang H., Zhang H., Sun L. and Guo W. (2018) Roles of hyperuricemia in metabolic syndrome and cardiac-kidney-vascular system diseases. Am. J. Transl. Res. 10, 2749–2763 PMID: [PMC free article] [PubMed] [Google Scholar]
- 51.Oh T.R., Choi H.S., Kim C.S., Bae E.H., Ma S.K., Sung S.A. et al. (2019) Hyperuricemia has increased the risk of progression of chronic kidney disease: propensity score matching analysis from the KNOW-CKD study. Sci. Rep. 30, 6681 10.1038/s41598-019-43241-3 [DOI] [PMC free article] [PubMed] [Google Scholar]
- 52.Li Y., Xu C., Yu C., Xu L. and Miao M. (2009) Association of serum uric acid level with non-alcoholic fatty liver disease: a cross-sectional study. J. Hepatol. 50, 1029–1034 10.1016/j.jhep.2008.11.021 [DOI] [PubMed] [Google Scholar]
Associated Data
This section collects any data citations, data availability statements, or supplementary materials included in this article.


