Abstract
It is commonplace that metabolizable energy (ME) is calculated from digestible energy (DE) as DE × 0.82. However, recent published literature suggests that the relationship between DE and ME is variable depending on the type of diet used, and is typically > 0.90 when high-concentrate diets are fed. Literature means were compiled from 23 respiration calorimetry studies where total fecal and urine collections were conducted and gaseous energy was measured. The relationship between experimentally observed and predicted ME (DE × 0.82) was evaluated using these previously reported treatment means. Additionally, a previously published linear regression equation for predicting ME from DE was also evaluated using a residual analysis. Published (Hales, K. E., A. P. Foote, T. M. Brown-Brandl, and H. C. Freetly. 2017. The effects of feeding increasing concentrations of corn oil on energy metabolism and nutrient balance in finishing beef steers. J. Anim. Sci. 95:939–948. doi:10.2527/jas.2016.0902 and Hemphill, C. N., T. A. Wickersham, J. E. Sawyer, T. M. Brown-Brandl, H. C. Freetly, and K. E. Hales. 2018. Effects of feeding monensin to bred heifers fed in a drylot on nutrient and energy balance. J. Anim. Sci. 96:1171–1180. doi:10.1093/jas/skx030) and unpublished data (K. E. Hales, unpublished data) were used to develop a new equation for estimating ME from DE (megacalories/kilogram [Mcal/kg] of DM; ME = −0.057 ± 0.022 DE2 + 1.3764 ± 0.1197 DE – 0.9483 ± 0.1605; r2 = 0.9671, root mean square error = 0.12; P < 0.01 for intercept, P < 0.01 for linear term, and P < 0.01 for quadratic term). To establish a maximum biological threshold for the conversion of DE to ME, individual animal data were used (n = 234) to regress the ME:DE on DE concentration (1.53 to 3.79 Mcal DE/kg). When using experimentally derived data and solving for the first derivative, the maximum biological threshold for the conversion of DE to ME was 3.65 Mcal DE/kg. Additionally, the quadratic regression (equation 1) was used to predict ME from a wide range of DE (1.8 to 4.6 Mcal/kg). The ME:DE ratio was then calculated by dividing predicted ME by DE. The maximum biological threshold for the conversion of DE to ME was estimated by solving for the first derivative and was 3.96 Mcal DE/kg. In conclusion, this review suggests that the relationship between DE and ME is not static, especially in high-concentrate diets. The equation presented here is an alternative that can be used for the calculation of ME from DE in current feedlot diets, but it is not recommended for use in high-forage diets. The maximization of ME in current diets, maximum biological threshold, occurs between 3.65 and 3.96 Mcal DE/kg in the diet, which based on these data is approximately 3.43 to 3.65 Mcal/kg of ME consumption.
Keywords: beef cattle, digestible energy, energetics, metabolizable energy
INTRODUCTION
For decades, metabolizable energy (ME) has been calculated from digestible energy (DE) using a factor of 0.82. The original 0.82 factor was published in The Nutrient Requirements of Farm Livestock No. 2 Ruminants (Agricultural Research Council [ARC], 1965). The studies were predominantly conducted at a maintenance level of dry matter intake (DMI), using high-forage diets, although flaked maize was fed in one experiment by Blaxter and Wainman (1964). Later, the use of DE × 0.82 was adopted in the 5th revised edition of the Nutrient Requirements of Beef Cattle (NRC, 1976). In the 6th revised edition of the NRC (1984), it was noted that interconversions of DE, ME, and net energy (NE) values are possible and that ME = 0.82 DE. The 7th revised edition of the NRC (2000) also incorporated this conversion, but cautioned that the ratio can vary considerably depending on intake, age of animal, and feed source. The 8th revised edition (NASEM, 2016) reported that the value of ME = 0.82 DE (NRC, 1976; Garrett, 1980), although Vermorel and Bickel (1980) were referenced indicating that the ME:DE ratio ranged from 0.82 to 0.93 in growing cattle. Recent data suggest a conversion efficiency of DE to ME of >0.9 for growing cattle fed high-concentrate diets composed primarily of processed grains and distillers byproducts (Hales et al., 2012, 2013, 2014, 2015a,b; Galyean et al., 2016). Subsequently, new equations developed by Galyean et al. (2016) were recommended by the NASEM (2016), in addition to further experiments to determine relationships that affect the ME:DE ratio.
Many factors could contribute to the increased ME:DE ratio reported in high-concentrate diets, such as dietary fat concentration and decreased methane production. Feeding supplemental fat can decrease methane production from 3.8% to 5.6% for each 1% of supplemental fat included in the diet (Beauchemin et al., 2008). This decrease in methane production occurs through biohydrogenation of unsaturated fatty acids, increased propionate production, and direct inhibition of protozoa. Methane production is also decreased by providing an alternate hydrogen acceptor to reduce ruminal carbon dioxide (Johnson and Johnson, 1995).
The objective of this paper is to present and discuss relationships among DE and ME in current feedlot diets, and to evaluate and explore alternate equations to predict ME from DE, especially in high-concentrate feedlot diets.
MATERIALS AND METHODS
Data used in this paper were generated from published literature and unpublished data where prior Institutional Animal Care and Use approval had been obtained.
Recently, the relationship between experimentally observed and predicted ME was evaluated using 87 treatment means from the literature that were reported by Galyean et al. (2016). The treatment means represented beef and dairy cattle, and bulls, steers, and heifers. Sixty-three of the 87 treatment means had a dietary ME of >2.5 Mcal/kg, but a majority of the 87 treatment means used to generate the equation were from cattle fed diets with more than 50% forage. Measurements of fecal, urine, and methane energy were collected using respiration calorimetry techniques. A linear equation (ME = 0.9611 × DE – 0.2999) was developed to estimate ME from DE. These data summarized in the databank reported by Galyean et al. (2016) were also used to conduct a residual analysis (n = 87) of the observed vs. the predicted ME using DE × 0.82 and are presented in Figure 1.
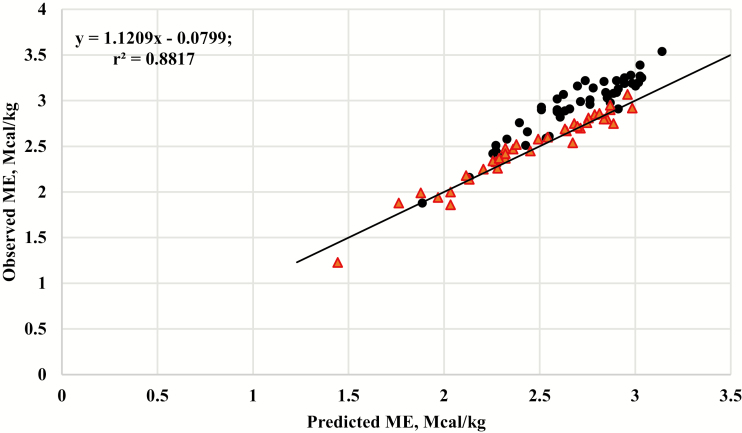
Figure 1.
The relationship between observed metabolizable energy (ME) and ME predicted from digestible energy (DE) using DE × 0.82 (National Research Council, 1974, 2000) for diets based on forage (red triangles) or based on concentrate grain (black circles), r2 = 0.8817. Data are means from the Galyean et al. (2016) databank. The solid black line represents the y = x, unity line.
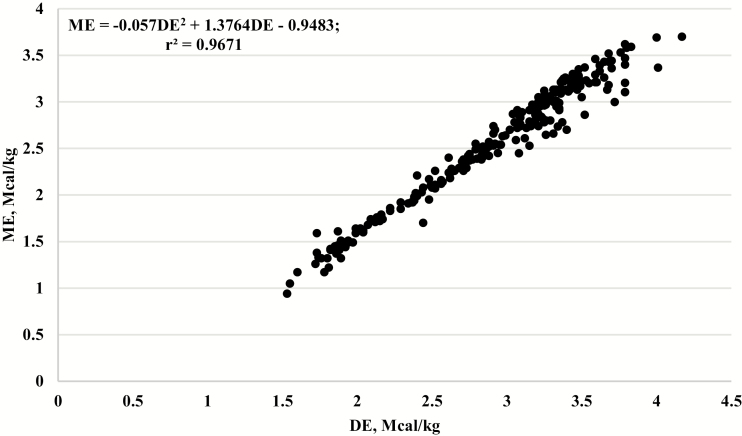
Additionally, a new equation (presented in Figure 2) was developed in SAS (SAS Inst. Inc., Cary, NC; version 9.3) using PROC REG, PROC GLM, and PROC MEANS. Individual animal data collected at the U.S. Meat Animal Research Center (MARC) were used in the equation (n = 234). The relationship between DE and ME was evaluated using data from two published studies (Hales et al., 2017; Hemphill et al., 2018) and three unpublished studies (K. E Hales, unpublished data). These data were generated from steers fed high forage and high-concentrate diets at ad libitum DMI and growing replacement heifers fed high forage and high-concentrate diets near a maintenance level of DMI. Sex and level of DMI were confounded, and thus not accounted for in the development of the equation. Because the data points were compiled at the same location, using the same methodology, with the same personnel, the data were not experiment (or study)-adjusted. Digestible energy and ME were determined through total urine and fecal collections for 4 d if fed near maintenance and 5 d if fed at ad libitum. One 24-h gas collection using open-circuit respiration calorimeters (head boxes) was conducted where total CO2 and CH4 production and O2 consumption were measured. These data were not uniformly distributed across a range of ME (21.33% < 2.0 Mcal/kg ME; 31.11% > 2.0 Mcal/kg but < 3.0 Mcal/kg ME; 47.56% >3.0 Mcal/kg ME but < 3.87 Mcal/kg ME). Experimentally observed ME (Mcal/kg) was the dependent variable and regressed on experimentally observed DE (Mcal/kg) and fit to a quadratic equation (Figure 2).
Figure 2.
The relationship between observed metabolizable energy (ME) megacalories/kilogram (Mcal/kg) and observed digestible energy (DE, Mcal/kg from 234 individual animal observations collected during respiration calorimetry experiments. ME = −0.057DE2 + 1.3764DE – 0.9483, r2 = 0.9671, RMSE = 0.12.
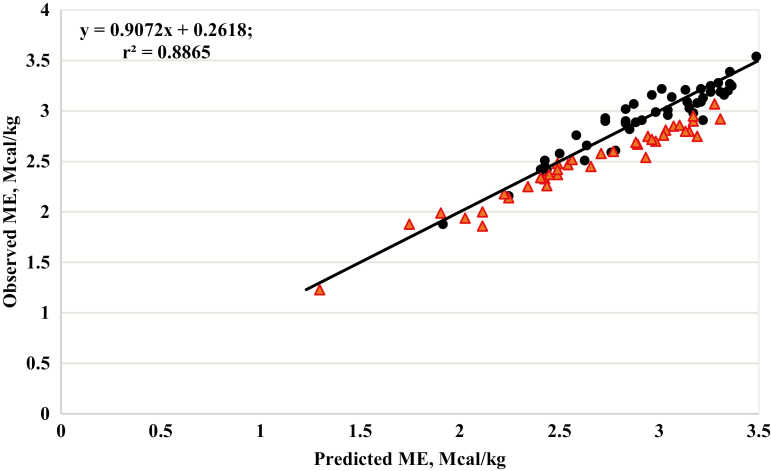
To evaluate the equation developed (equation 1), a residual analysis was conducted using the 87 treatment means reported in the Galyean et al. (2016) databank, because none of those data were included in the development of equation 1. Therefore, the observed ME from the 87 treatment means was regressed on predicted ME values generated using data from equation 1, and the results are shown graphically in Figure 3.
Figure 3.
The relationship between observed metabolizable energy (ME) and ME predicted from equation 1 for diets based on forage (red triangles) or concentrate grain (black circles), r2 = 0.8865. Data means are from the Galyean et al. (2016) databank. The solid black line represents the y = x, unity line.
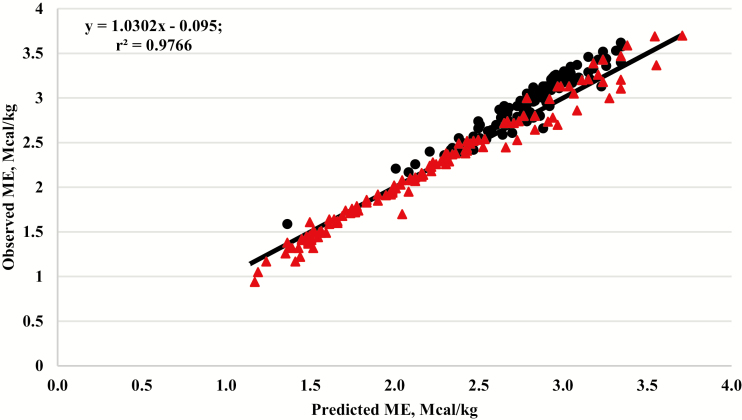
The relationship between observed ME and ME predicted from the Galyean et al. (2016) linear equation (ME = 0.9611 × DE – 0.2999) was evaluated using the 234 individual animal data points generated at U.S. MARC. The residual analysis is shown graphically in Figure 4.
Figure 4.
The relationship between observed metabolizable energy (ME) and ME predicted from using the equation (ME = 0.9611 × DE −0.2999) reported by Galyean et al. (2016) for diets based on forage (red triangles) or concentrate grain (black circles), r2 = 0.9766. Data means are from the data used to generate equation 1. The solid black line represents the y = x, unity line.
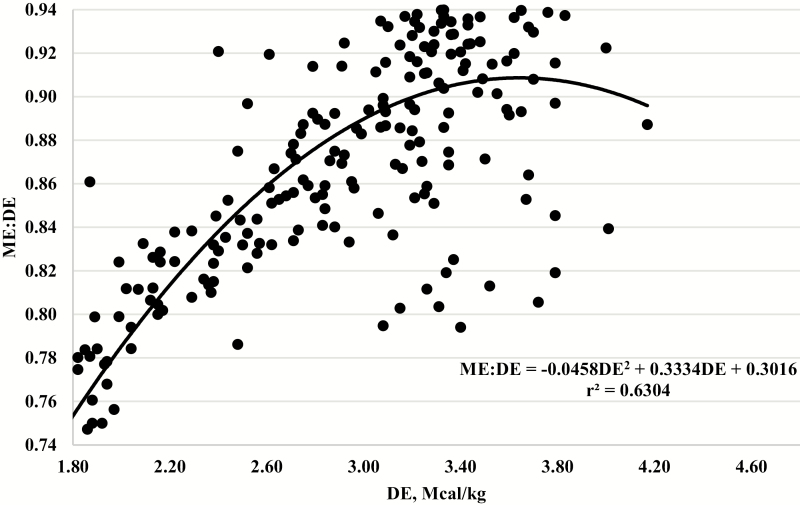
To explore the maximum biological threshold for the conversion of DE to ME, the individual animal data (n = 234) generated at U.S. MARC were used and the ME:DE ratio was regressed on observed DE and is presented graphically in Figure 5. The maximum biological threshold was determined by solving for the first derivative.
Figure 5.
Relationship between the observed metabolizable energy-to-digestible energy ratio (ME:DE) over a range of DE concentrations from 1.53 to 3.79 Mcal/kg.
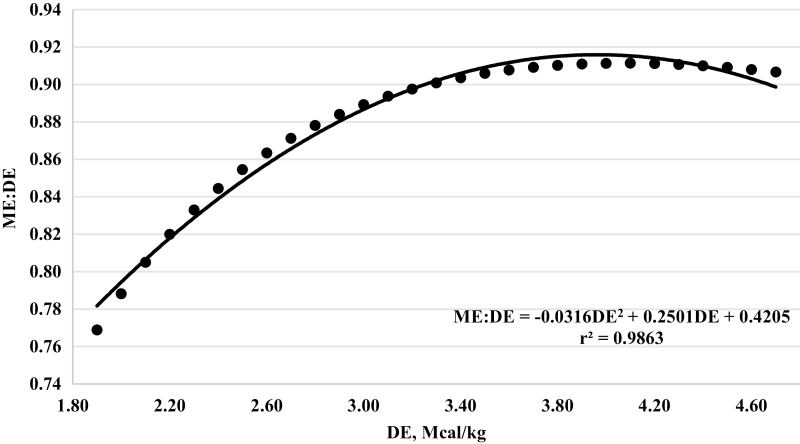
Similarly, the quadratic regression equation (equation 1) was used to predict ME from a wide range of DE (1.8 to 4.6 Mcal/kg). The ME:DE ratio was then calculated by dividing predicted ME by DE. The relationship between the ME:DE ratio and DE concentration is shown graphically in Figure 6. The maximum biological threshold when predicting ME from DE using equation 1 was estimated by solving for the first derivative.
Figure 6.
Relationship between the predicted metabolizable energy-to-digestible energy ratio (ME:DE) using a range of DE concentrations from 1.80 to 4.60 Mcal/kg and computing ME using equation 1.
RESULTS AND DISCUSSION
A residual analysis (n = 87) of the observed ME and predicted ME using DE × 0.82 are presented in Figure 1. The accuracy based on the mean square error of prediction (MSEP) was 0.0209 and the coefficient of determination was r2 = 0.8817. However, the slope ≠ 1 (P < 0.03), which indicates that predictions using the 0.82 conversion may not be consistent with observed values. Furthermore, the intercept was not equal to 0 (P = 0.02), which suggests that the equation may be biased. The residuals for forage-based diets were not different from 0 (P = 0.07), whereas the residuals for concentrate-based diets did differ from 0 (P < 0.01). Visual assessment suggests that the DE × 0.82 conversion is appropriate for forage-based diets, and this is confirmed by the residuals not differing from 0. Nonetheless, the equation is not appropriate for concentrate-based diets, as the residuals did differ from 0. A majority of the points above the unity line (Figure 1) are concentrate-based diets, with a dietary ME concentration of >2.25 Mcal/kg, which would be typical of diets used in the current feedlot industry.
The newly developed quadratic regression equation with dietary ME concentration as the dependent variable and linear and quadratic terms for dietary DE concentration as the independent variables was
| [1] |
where ME and DE are expressed in Mcal/kg of DM, the root mean square error (RMSE) = 0.12; P < 0.01 for intercept, P < 0.01 for linear term, and P < 0.01 for quadratic term (r2 = 0.9671).
A residual analysis (n = 87) of the observed ME and predicted ME using equation 1 is presented in Figure 3. The accuracy based on the mean square error of prediction (MSEP) was 0.0206 and the coefficient of determination was r2 = 0.8865 for the residual analysis. Additionally, the slope ≠ 1 (P = 0.05), but the intercept is equal to 0 (P = 0.12). The residuals for the forage-based diets differed from 0 (P < 0.01), suggesting the equation should not be used on forage-based diets as it likely overestimates ME. However, the residuals for concentrate-based diets were not different from 0 (P = 0.57), which indicates that the equation works well when predicting ME from DE in concentrate-based diets. When comparing equation 1 to the use of DE × 0.82 = ME, the residual analysis of both equations suggests that they have similar accuracies, based on the MSEP. However, using DE × 0.82 to compute ME has a bias, where it most likely underestimates ME in diets with greater energy densities (>2.25 Mcal/kg of ME), and predictions of ME are not consistent with observed values.
To evaluate the linear equation developed by Galyean et al. (2016), a residual analysis was conducted using the 234 individual animal data points included in equation 1 and the residual analysis is presented in Figure 4. Direct comparison of equation 1 and the linear equation (ME = 0.9611 × DE – 0.2999) developed by Galyean et al. (2016) is not possible since they were developed using two different data sets. Additionally, there is not enough new literature data available to create a third independent data set to directly compare both equations. When evaluating observed vs. predicted ME in Figure 4, the slope was different from 1 (P < 0.01) and the intercept was different from 0 (P < 0.01). The residuals for the forage and concentrate-based diets both differed from 0 (P < 0.01). Visual analysis of Figure 4 suggests that the linear equation works well for forage-based diets, especially ME concentrations between 1.5 and 2.5 Mcal/kg; however, when diets increase in energy density (>2.5 Mcal/kg), the equation underpredicts ME in concentrate-based diets, and both under- and over-predicts ME in forage-based diets.
When solving the first derivative using observed DE and the corresponding ME:DE ratio, the optimal concentration of DE in the diet was 3.65 Mcal/kg (which corresponds to 3.43 Mcal/kg of ME), which is the maximum biological threshold for the conversion of DE to ME in the 234 individual animal data points used. Likewise, when solving for the first derivative when ME was predicted from DE using equation 1, the optimal concentration of DE was 3.96 or 3.65 Mcal/kg of ME.
Krehbiel et al. (2006) reviewed the upper limit for caloric density in finishing diets and reported that ruminants consuming high-concentrate grain diets eat to maintain constant energy intake. The relationship between average daily gain and the gain:feed ratio is quadratic and gain:feed is maximized from 3.46 to 3.65 Mcal ME/kg of intake. Interestingly, the observed and calculated maximum biological threshold for the conversion of DE to ME is near the ME concentration reported by Krehbiel et al. (2006) that maximizes gain:feed. It is unclear whether this is coincidental or has biological relevance, but this is the point where cattle produce the least methane and capture the most energy in ME. These results suggest that maximization of ME occurs somewhere between 3.43 and 3.65 Mcal ME/kg of consumption, and energy consumed beyond that is not captured in ME. Perhaps the maximum biological threshold for the conversion of DE to ME can be used to optimize the energy density of feedlot diets.
Metabolizable energy is the starting point for the net energy (NE) system, and thus, it is imperative that ME be estimated with accuracy. Although some NEm and NEg feed values were derived from comparative slaughter research, the majority of the NE values are calculated from ME using the cubic equations reported by Garrett (1980). If the 0.82 conversion is not constant across all diets, the NEm and NEg requirements and the NEm and NEg concentrations of feeds from ME could be affected (Galyean et al., 2016).
Energy utilization by ruminants can differ depending on physiological status, specifically whether they are growing or mature. Thus, the ratio of ME:DE is generally greater in growing ruminants than in mature ruminants because methane and urinary energy losses are less in growing ruminants (Webster et al., 1977; Vermorel and Bickel, 1980; Vermorel et al., 1980). The increased methane in mature vs. growing cattle could be related to increased rumen size in mature cattle and a slower rate of passage, allowing for increased methane production. A more rapid rate of ruminal fiber degradation has been observed in cows than heifers, likely because of the increased turnover of the ruminal fluid pool (Varel and Kreikemeier, 1999).
Calorimetry or comparative slaughter studies conducted using high-concentrate diets were scarce during the time the 0.82 conversion was developed. Nonetheless, Blaxter and Wainman (1964) used three mature wethers and three mature steers and fed mixtures of poor-quality hay and flaked maize that consisted of on a DM basis: 1) 100% hay; 2) 80% hay and 20% maize; 3) 60% hay and 40% maize; 4) 40% hay and 60% maize; 5) 20% hay and 80% maize; and 6) 100% maize. The wethers and steers were fed at 1- and 2-times maintenance levels of DMI. The ratio of ME to DE increased linearly from 0% to 100% maize inclusion at the 2-times maintenance level of DMI and the maintenance level of DMI. The ME:DE ratio in the 100% flaked maize diet at 2-times maintenance was 0.92, which is similar to ratios observed in present-day high-concentrate diets (Hales et al., 2012, 2013, 2014, 2015a, b, 2017; Ebert et al., 2017; Jennings et al., 2018), even though the flaked maize diet had a greater amount of concentrate than currently used. Therefore, chemical and physical composition of the diet can greatly affect the ME:DE ratio. Others have noted an increase in the ME:DE ratio in response to increased inclusion of concentrate in the diet (from 0% to 85%; Vermorel et al., 1980). More recently, in growing beef steers fed concentrate-based diets where alfalfa hay increased from 2% to 14% of DM and replaced dry-rolled corn (DRC), the ME:DE ratio increased from 0.89 to 0.92 as DRC increased in the diet (Hales et al., 2014). A similar response has also been observed as DRC replaced corn silage and alfalfa hay and increased from 0% to 84% of DM in growing Angus steers, where the ME:DE ranged from 0.86 to 0.92 (Fuller et al., 2018). In addition, as glycerin replaced DRC in a high-concentrate diet, the ME:DE ratio increased quadratically, to the point where glycerin decreased DMI in cattle offered ad libitum. Based on these results, it can be concluded that the ME:DE ratio increases as the proportion of concentrate increases in diets fed to growing beef steers.
Along with dietary composition, increasing the level of DMI can increase the ratio of ME:DE. Blaxter and Wainman (1964) increased intake from 1- to 2-times maintenance and increased the ratio of ME:DE by 7.5% when the diet was based on flaked maize. Later, Vermorel et al. (1980) reported that as the level of DMI increased, the ME:DE ratio increased. This increase in the ratio of ME:DE occurred regardless of diet type (chopped hay vs. pelleted hay) fed to growing lambs. Likewise, others have observed an increase in the ME:DE ratio of approximately 5% to 6% as the level of DMI increased from 1- to 2-times maintenance when feeding high-concentrate finishing diets based on steam-flaked or dry-rolled corn (Hales et al., 2012; Hales et al., 2013; maintenance level of DMI, K. E. Hales, unpublished data). Jennings et al. (2018) fed byproduct diets with steam-flaked corn at 1- and 2-times maintenance and observed a 5.2% increase in the ME:DE ratio as the level of intake increased. The studies of Hales et al. (2012, 2013) and Jennings et al. (2018) were conducted at the same location, using the same calorimeters, approximately 8 yr apart.
Urinary energy loss does not vary greatly with level of feed intake and typically ranges from 2% to 5% of intake energy (IE; ARC, 1965); however, urinary energy excretion increases during a negative energy balance or when excess protein is fed (Blaxter, 1963; Hemphill et al., 2018; Jennings et al., 2018). Therefore, without a change in urinary energy loss as IE increases from 1- to 2-times maintenance level of DMI, the increase in the ME:DE ratio is logically caused by a change in methane production in response to level of DMI. Methane production as a proportion of IE decreases as level of intake increases. Blaxter and Wainman (1964) noted a 23% decrease in methane production as a proportion of IE when steers were fed near maintenance vs. 2-times maintenance. Hales et al. (2012) noted a 37% decrease in methane production as a proportion of IE as DMI increased from 1- to 2-times maintenance in Jersey steers fed high-concentrate diets. Similarly, Hales et al. (2013) also reported a 43% decrease in methane production as IE increased from 1- to 2-times maintenance when the same Jersey steers were fed steam-flaked corn-based diets with or without wet distillers grains and solubles. In an experiment at the same location, when beef steers were fed high-concentrate diets at 1 and 2 times a maintenance level of DMI, methane production decreased from 6.4% to 3.8% of IE, respectively, a 40% decrease (Jennings et al., 2018). Others have also reported that methane production can be decreased when IE is increased (Blaxter and Clapperton, 1965; Johnson and Johnson, 1995; Beauchemin and McGinn, 2006).
The relationship between IE and energy retained is curvilinear in growing ruminants (Brody, 1945; Blaxter and Boyne, 1978, Geay, 1984), whereby each increment in IE yields progressively smaller increments of retained energy. The underlying mechanism in forage-fed ruminants is thought to be the decrease in ME as the level of DMI increases, which could be the result of a quicker rate of passage (Geay, 1984). The faster rate of passage reduces starch and cell wall digestibility and thereby overall digestibility and ultimately increases fecal energy loss (Ǿrskov et al., 1969; Geay, 1984) more than any corresponding decrease in enteric methane production (Geay, 1984). In ruminants fed high-concentrate diets where physical fill is not limiting, rate of passage is affected much less, and the relationship between IE and energy retained is typically quadratic (ARC, 1965).
Galyean et al. (2016) and the NASEM (2016) recommended that the use of the 0.82 conversion to calculate ME from DE in high-concentrate diets should be abandoned, and the data presented here support that recommendation. The linear equation developed by Galyean et al. (2016) is an alternate equation that can be used to calculate ME from DE, especially for high-concentrate diets. Equation 1 presented herein is another alternative equation that could be used for the calculation of ME from DE in high-concentrate feedlot diets, and based on this equation, maximization of ME occurs at 3.96 Mcal/kg of DE consumption. Future research is warranted to better understand the underlying mechanisms that affect the conversion of digestible energy to metabolizable energy, especially in high-concentrate diets widely used in the feedlot industry today.
Footnotes
Mention of trade names or commercial products in this article is solely for the purpose of providing specific information and does not imply recommendation or endorsement by the USDA. The authors have no conflict of interest. USDA is an equal opportunity provider and employer. The efforts of Harvey Freetly in assisting with the conduct of this research and encouraging my curiosity about beef cattle energetics are greatly appreciated.
LITERATURE CITED
- Agricultural Research Council 1965. The nutrient requirements of farm livestock. No. 2. London: Ruminants. Agricultural Research Council. [Google Scholar]
- Beauchemin K. A., and McGinn S. M.. 2006. Methane emissions from beef cattle: effects of fumaric acid, essential oil, and canola oil. J. Anim. Sci. 84:1489–1496. doi:10.2527/2006.8461489x. [DOI] [PubMed] [Google Scholar]
- Beauchemin, K. A., M. Kreuzer, F. O’Mara, and T. A. McAllister. 2008. Nutritional management for enteric methane abatement: a review. Aust. J. of Exp. Agri. 48:21–27. doi:10.1071/EA07199. [Google Scholar]
- Blaxter K. L. 1963. The energy metabolism of ruminants. London: Hutchinson; p. 329. [Google Scholar]
- Blaxter K. L., and Boyne A. W.. 1978. The estimation of the nutritive value of feeds as energy sources for ruminants and the derivation of feeding systems. J. Agric. Sci. 90:47–68. doi: 10.1017/S0021859600048589. [DOI] [Google Scholar]
- Blaxter K. L., and Clapperton J. L.. 1965. Prediction of the amount of methane produced by ruminants. Br. J. Nutr. 19:511–522. [DOI] [PubMed] [Google Scholar]
- Blaxter K. L., and Wainman F. W.. 1964. The utilization of the energy of different rations by sheep and cattle for maintenance and for fattening. J. Agric. Sci. 63:113–128. [Google Scholar]
- Blaxter K. L., and Wilson R. S.. 1963. The voluntary intake of roughages by steers. Anim. Prod. 4:351–358. doi: 10.1017/S002185960001515X. [DOI] [Google Scholar]
- Brody S. 1945. Bioenergetics and growth. 1st ed New York: Reinhold Publishing Corporation. [Google Scholar]
- Ebert P. J., Bailey E. A., Shreck A. L., Jennings J. S., and Cole N. A.. 2017. Effect of condensed tannin extract supplementation on growth performance, nitrogen balance, gas emissions, and energetic losses of beef steers. J. Anim. Sci. 95:1345–1355. doi: 10.2527/jas.2016.0341. [DOI] [PubMed] [Google Scholar]
- Fuller A. L., Wickersham T. A., Sawyer J. E., and Hales K. E.. 2018. The effects of the forage-to-concentrate ratio on the conversion of digestible energy to metabolizable energy in growing beef steers. Proceedings of the Plains Nutrition Council Spring Conference, April 5–6, 2018, San Antonio, TX p. 117. [DOI] [PMC free article] [PubMed] [Google Scholar]
- Galyean M. L., Cole N. A., Tedeschi L. O., and Branine M. E.. 2016. BOARD-INVITED REVIEW: efficiency of converting digestible energy to metabolizable energy and reevaluation of the california net energy system maintenance requirements and equations for predicting dietary net energy values for beef cattle. J. Anim. Sci. 94:1329–1341. doi: 10.2527/jas.2015-0223. [DOI] [PubMed] [Google Scholar]
- Garrett W. N. 1980. Energy utilization by growing cattle as determined in 72 comparative slaughter experiments. Energy Metab. Proc. Symp. 26:3–7. [Google Scholar]
- Geay Y. 1984. Energy and protein utilization in growing cattle. J. Anim. Sci. 58:766–778. doi:10.2527/jas1984.583766x. [DOI] [PubMed] [Google Scholar]
- Hales K. E., Brown-Brandl T. M., and Freetly H. C.. 2014. Effects of decreased dietary roughage concentration on energy metabolism and nutrient balance in finishing beef cattle. J. Anim. Sci. 92:264–271. doi: 10.2527/jas.2013-6994. [DOI] [PubMed] [Google Scholar]
- Hales K. E., Cole N. A., and MacDonald J. C.. 2012. Effects of corn processing method and dietary inclusion of wet distillers grains with solubles on energy metabolism, carbon-nitrogen balance, and methane emissions of cattle. J. Anim. Sci. 91:819–828. doi: 10.2527/jas.2011-4441. [DOI] [PubMed] [Google Scholar]
- Hales K. E., Cole N. A., and MacDonald J. C.. 2013. Effects of corn processing method and dietary inclusion of wet distillers grains with solubles on energy metabolism, carbon-nitrogen balance, and methane emissions of cattle. J. Anim. Sci. 90:3174–3185. doi: 10.2527/jas.2011-4441. [DOI] [PubMed] [Google Scholar]
- Hales K. E., Foote A. P., Brown-Brandl T. M., and Freetly H. C.. 2015a. Effects of dietary glycerin inclusion at 0, 5, 10, and 15 percent of dry matter on energy metabolism and nutrient balance in finishing beef steers. J. Anim. Sci. 93:348–356. doi: 10.2527/jas.2014-8075. [DOI] [PubMed] [Google Scholar]
- Hales K. E., Foote A. P., Brown-Brandl T. M., and Freetly H. C.. 2017. The effects of feeding increasing concentrations of corn oil on energy metabolism and nutrient balance in finishing beef steers. J. Anim. Sci. 95:939–948. doi: 10.2527/jas.2016.0902. [DOI] [PubMed] [Google Scholar]
- Hales K. E., Jaderborg J. P., Crawford G. I., DiCostanzo A., Spiehs M. J., Brown-Brandl T. M., and Freetly H. C.. 2015b. Effects of dry-rolled or high-moisture corn with twenty-five or forty-five percent wet distillers’ grains with solubles on energy metabolism, nutrient digestibility, and macromineral balance in finishing beef steers. J. Anim. Sci. 93:4995–5005. doi: 10.2527/jas.2015-9301. [DOI] [PubMed] [Google Scholar]
- Hemphill C. N., Wickersham T. A., Sawyer J. E., Brown-Brandl T. M., Freetly H. C., and Hales K. E.. 2018. Effects of feeding monensin to bred heifers fed in a drylot on nutrient and energy balance. J. Anim. Sci. 96:1171–1180. doi: 10.1093/jas/skx030. [DOI] [PMC free article] [PubMed] [Google Scholar]
- Jennings J. S., Meyer B. E., Guiroy P. J., and Cole N. A.. 2018. Energy costs of feeding excess protein from corn-based by-products to finishing cattle. J. Anim. Sci. 96:653–669. doi: 10.1093/jas/sky021. [DOI] [PMC free article] [PubMed] [Google Scholar]
- Johnson K. A., and Johnson D. E.. 1995. Methane emissions from cattle. J. Anim. Sci. 73:2483–2492. doi:10.2527/1995.7382483x. [DOI] [PubMed] [Google Scholar]
- Krehbiel C. R., Cranston J. J., and McCurdy M. P.. 2006. An upper limit for caloric density of finishing diets. J. Anim. Sci. 84 Suppl:E34–E49. [DOI] [PubMed] [Google Scholar]
- NASEM 2016. The National Academies of Sciences, Engineering, and Medicine. Nutrient requirements of beef cattle. 8th rev. ed Washington, DC: Natl. Acad. Press. [Google Scholar]
- National Research Council 1976. Nutrient requirements of beef cattle. 5th rev. ed Washington, DC: Natl. Acad. Sci. [Google Scholar]
- National Research Council 1984. Nutrient requirements of beef cattle. 6th rev. ed Washington, DC: Natl. Acad. Press. [Google Scholar]
- National Research Council 2000. Nutrient requirements of beef cattle. 7th rev. ed Washington, DC: Natl. Acad. Press. [Google Scholar]
- Ǿrskov E. R., Fraser C., and Kay R. N.. 1969. Dietary factors influencing the digestion of starch in the rumen and small and large intestine of early weaned lambs. Br. J. Nutr. 23:217–226. [DOI] [PubMed] [Google Scholar]
- Varel V. H., and Kreikemeier K. K.. 1999. Low- and high-quality forage utilization by heifers and mature beef cows. J. Anim. Sci. 77:2774–2780. doi:10.2527/1999/77102774x. [DOI] [PubMed] [Google Scholar]
- Vermorel M., and Bickel H.. 1980. Utilisation of feed energy by growing ruminants. Annales de Zootechnie. 29:127–143. [Google Scholar]
- Vermorel M., Bouvier J. C., and Geay Y.. 1980. Energy utilization by growing calves: effects of age and milk intake. Proc. 8th Symp. on Energy Metabolism, Cambridge, Mount L. E. (Ed). London: Butterworths. [Google Scholar]
- Webster A. J. F., Smith J. S., and Mollison G. S.. 1977. Prediction of the energy requirements for growth in beef cattle. 3. Body weight and heat production in Hereford x British Friesian bulls and steers. Anim. Prod. 24:237–244. doi: 10.1017/S0003356100011715. [DOI] [Google Scholar]


