

SUMMARY
Head and neck squamous cell carcinoma (HNSCC) arises through exposure to environmental carcinogens or malignant transformation by human papillomavirus (HPV). Here, we assessed the transcriptional profiles of 131,224 single cells from peripheral and intra-tumoral immune populations from patients with HPV− and HPV+ HNSCC and healthy donors. Immune cells within tumors of HPV− and HPV+ HNSCC displayed a spectrum of transcriptional signatures, with helper CD4+ T cells and B cells being relatively divergent and CD8+ T cells and CD4+ regulatory T cells being relatively similar. Transcriptional results were contextualized through multispectral immunofluorescence analyses and evaluating putative cell-cell communication based on spatial proximity. These analyses defined a gene expression signature associated with CD4+ T follicular helper cells that is associated with longer progression free survival in HNSCC patients. The datasets and analytical approaches herein provide a resource for the further study of the impact of immune cells on viral- and carcinogen-induced cancers.
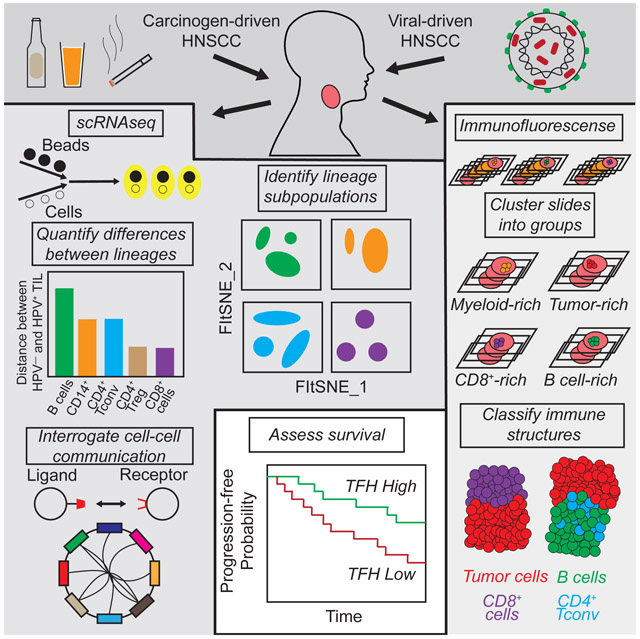
Graphical Abstract
INTRODUCTION
HNSCC occurs with an annual incidence of nearly 600,000 cases globally (Ferlay et al., 2015), and most patients present with locally advanced disease (Argiris et al., 2008; Seiwert and Cohen, 2005). HNSCC arises through either genetic alterations driven by exposure to carcinogens (i.e. alcohol and/or tobacco), or through malignant transformation following high-risk HPV infection (Carvalho et al., 2005). While the majority of HNSCC is associated with tobacco use, the incidence of HPV+ HNSCC has risen substantially in the West (Brown et al., 2011, 2012; Colevas, 2013; LeHew et al., 2017; Weatherspoon et al., 2015), and up to half of HNSCC cases in the United States are now caused by infection with high-risk HPV (mostly HPV-16, but also −18, −31, and −33) (Fakhry and D'Souza, 2013; Kreimer et al., 2005).
Clinically, patients afflicted with HPV+ HNSCC have better overall survival compared to patients with HPV− disease (Ang et al., 2010). Differences in the tumor infiltrating immune populations have also been observed in HNSCC, with a higher frequency of intra-tumoral B cells present in HPV+ HNSCC (Russell et al., 2013; Wood et al., 2016), and a higher frequency of dysfunctional CD8+ T cells in HPV− HNSCC (Kansy et al., 2017). The duality of carcinogen- versus virally-induced cancer is a unique aspect of HNSCC, and presents an opportunity to assess differences in the immune landscape of two distinct cancer etiologies that occur in a similar anatomical location.
Traditionally, both HPV− and HPV+ HNSCC have been treated with a combination of surgery, chemotherapy, and radiation (Bourhis et al., 2006; Pignon et al., 2009). These therapies have generally been associated with significant morbidity, and many patients relapse within 3 to 5 years, leading to poor prognosis and a lack of additional treatment options (Jayaram et al., 2016; Vermorken et al., 2008). Immunotherapy has created a new paradigm for the treatment of cancer, and recent clinical trials have demonstrated the efficacy of targeting immune checkpoints (Brahmer et al., 2012; Topalian et al., 2012). Immunotherapy for the treatment of HNSCC has similarly led to survival benefits in patients, demonstrating that the immune system can be targeted to achieve clinical benefits in HNSCC (Burtness et al., 2019; Ferris et al., 2016). Despite this clinical success, only approximately 20-30% of HNSCC patients achieve a survival benefit following programmed death 1 (PD-1) or programmed death ligand 1 (PD-L1) blockade (Burtness et al., 2019; Ferris et al., 2016), highlighting the need to better understand the complex biology underlying the state of the immune system within tumor microenvironment of HNSCC. Further insight into immune cell states will help identify features associated with responsiveness (or conversely lack of responsiveness) to currently available immunotherapies, and will inform the development of single- and multi-agent immunotherapy regimens in the clinic. Comparing the immune profiles in HPV− and HPV+ HNSCC is likewise a prerequisite for prioritizing which cell types and molecules to target for the development of novel immunotherapies.
Here, we compared the immune landscape of mutation- versus virus-driven cancer in treatment-naïve HNSCC by scRNAseq analysis and multispectral immunofluorescence to characterize spatial localization patterns and cell neighborhoods in the TME. Our analyses provide insight into the immune lineages in HPV+ and HPV− HNSCC, the transcriptional states and differentiation trajectories of these cells, and cellular cross-talk with potential relevance to tumor progression. Moreover, our analysis defines a gene set with prognostic potential in the clinic. Altogether, these datasets and analytical approaches provide a resource for the further study of the immune contribution to viral- and carcinogen-induced cancers.
RESULTS
Single cell survey of immune lineages in HNSCC
We analyzed the single-cell transcriptomes of all viable cells of hematological origin (i.e. CD45+ cells) isolated immediately following surgery from paired blood and tissue obtained from the primary tumors of 18 HPV− HNSCC patients and 8 HPV+ HNSCC patients, all of whom were immunotherapy treatment-naïve (Figure 1A and Table S1). For comparison, single-cell transcriptomes were also generated from viable CD45+ cells sorted from 5 tonsil tissues from independent patients with sleep apnea (i.e., patients without cancer) and peripheral blood mononuclear cells (PBMC) from 6 healthy donors. In total, we recovered 131,224 individual immune cells that passed quality control measures (Figure S1A), expressing a mean of 1,262 genes (Figure 1A and STAR Methods).
Figure 1. Assessment of bulk changes in transcriptional profiles between patients and overall clustering and identification of single cells.

A total of 131,224 single cells were recovered from 63 samples. (A) Live CD45+ cells were sorted from PBMC and single-cell suspensions prepared from tissues samples, and were subjected to single-cell RNAseq. (B) Clustering of samples by pseudobulk expression profiles reveals strong separation between PBMC and TIL, and distinct patterns of clustering of TIL samples by the tissue of origin. (C) FItSNE visualization and DRAGON clustering of all single cells identified 26 unique clusters across all samples. (D) The same FItSNE plot as (C), but with all immune cell types identified. (E) The same FItSNE embedding as (C) and (D) with all cells from each sample type shown. Shifts in density of cells are evident between PBMC, tonsil, and TIL samples, reflective of differences in transcriptional profiles between PBMC and tissues. (F) Quantification of differences between major immune lineages in HPV− and HPV+ TIL. Each dot represents a subsample of 500 cells from PCA space for HPV− and HPV+ TIL or a sample of 500 cells regardless of sample type (i.e. random), and the height of the bar is the mean of the subsamples. All comparisons were statistically significant due to 100 replicates of testing, but the mean fold-change between HPV− and HPV+ TIL and random samples varied from 3.9-fold (B cells) to 1.1-fold (CD8+ T cells).
Pseudobulk expression matrices (Figure 1B and STAR Methods) constructed from our scRNAseq data revealed separation of samples by PBMC and tissue origin, and segregrated clusters of tumor infiltrating leukocytes (TIL) and tonsil samples. We recovered expected differences between PBMC and TIL, such as myeloid cells (LYZ and FCGR3A) in PBMC and immunomodulatory cytokines in TIL (Figure S1B). Between clusters of TIL (Figure S1C), we found that clusters 3 and 4 shared a partial expression pattern with samples derived from tonsil tissue (cluster 1) including B cells (MS4A1, CD19) and activated T cell genes (CD3D and HLA-DRB5), but also expressed a small cluster of cytotoxic genes (e.g., GZMB) distinct to TIL. Based on this pseudobulk data, we performed a bootstrapped post-hoc power analysis (STAR methods), and found that 9 patients were required in a balanced study design to achieve 80% power to find differentially expressed genes in TIL (Figure S1D). Overall, this pseudobulk RNAseq analysis revealed large shifts in gene expression between PBMC and TIL samples, and suggested substructure related to both differential infiltration and transcriptional states between HPV− and HPV+ TIL.
We next developed and implemented a DeteRministic Annealing Gaussian mixture mOdel clusteriNg algorithm (DRAGON; Figure S2A and STAR methods) to identify clusters of cells present across our dataset (Figure 1C and Table S2). DRAGON, which is a novel implementation of deterministic annealing (Rose, 1998; Rose et al., 1990a; Rose et al., 1990b) for scRNAseq, performs clustering using a process like the physical process of annealing. Briefly, DRAGON performs clustering by progressively “cooling” the system at various “temperatures”, which effectively places a constraint on the minimum disorder of the system proportional to the “temperature”. Using DRAGON, rounds of expectation/maximization at successively decreasing temperatures leads to a final solution at the global minimum, but also provides intermediate solutions at decreasing temperatures as clusters are generated (Figure S2B). This model has several advantages over other clustering algorithms by providing statistically principled criteria for cluster genesis, avoidance of local minima by progressively reducing the disorder with successive rounds of expectation/maximization, parameterization of each cluster as a component of a Gaussian mixture model, and scalability to large datasets by using parallel processing for key components of the algorithm (STAR Methods). Additionally, the commonly used Louvain clustering algorithm has several known limitations including a resolution limit (Fortunato and Barthelemy, 2007) and the potential for detection of disconnected communities (Traag et al., 2019). Benchmarking of DRAGON versus Louvian clustering (implemented in Seurat; STAR Methods) revealed that the two algorithms both achieved high accuracy (Louvian: 90.3%; DRAGON: 90.6%; p=0.88 by two-sample t-test) over a wide range of simulated scRNAseq data (Figure S2C) generated by splatter (Zappia et al., 2017). Overall, DRAGON and Louvian clustering perform similarly, but are based on different frameworks. The 26 clusters determined by DRAGON were visualized by FItSNE (Linderman et al., 2019), a fast interpolation-based tSNE (Figure 1C).
We next used the clustering solution of DRAGON at a relatively high temperature of 45 (Figure S2B) to identify major immune lineages. Differential gene expression between these four clusters was found to be strongly related to CD4+ T cells, B cells, cytotoxic cells (CD8+ T cells and NK cells), and myeloid cells (Figure S2D). We next bioinformatically separated and re-clustered cells from each of these 4 lineages to identify cell types based on canonical gene expression patterns (Figure S2E). The inferred cell types were strongly correlated with those identified by flow cytometry on paired samples from a subset of patients (Figure S2F-I). These inferred cell types were then projected onto the FItSNE of the full dataset (Figure 1D and Table S2). We also performed a second post-hoc power analysis, and found that ~60,000 cells are required to have an 80% chance of detecting a cluster of ~300 cells (i.e the size of the rarest population, mast cells; Figure S1E).
We next assessed shifts in transcriptional profiles across patient samples by viewing the same FItSNE projections with cells colored by sample types (Figure 1E). To quantify these shifts between major immune lineages in HPV− and HPV+ TIL, we measured the distance between immune lineages from each tumor type using the Bhattacharyya distance (Figure 1F; STAR Methods). For comparison, we generated background distributions of each major lineage by sampling cells independently of tumor type. This approach controls for the number of cells present in each sample by sub-sampling the same number of cells, which was important due to the observed numerical differences in infiltration (Figure S1F). Strikingly, this analysis revealed large differences between B cells, myeloid cells and CD4+ Tconv between HPV− and HPV+ TIL (Figure 1F). In contrast, CD8+ T cells and CD4+ Treg were much more similar between HPV− and HPV+ TIL. Overall, we characterized broad changes in transcriptional profiles between PBMC and TIL (and between groups of TIL samples), identified cell types from major immune lineages, and quantified differences in the major lineages commonly found in HPV− versus HPV+ TIL.
CD8+ T cells have a continuous differentiation trajectory
To address the transcriptional states of CD8+ T cells in viral- versus carcinogen-induced HNSCC, we bioinformatically isolated and re-clustered CD8+ T cells. A total of 8 clusters were derived following DRAGON clustering (Figure 2A and Table S3). CD8+ T cells from TIL were most frequently found in clusters 1-4, while those from PBMC and tonsil were more frequently found in clusters 5-8 (Figure 2B), although there was also notable overlap between PBMC and TIL populations in some clusters. We next performed differential gene expression analysis, and found distinct sets of genes governing each cluster (Figure 2C). Specifically, cluster 1 was associated with cycling cells (e.g. MKI67); cluster 2 was associated with IFN-response genes (e.g. ISG15); clusters 3 and 4 expressed checkpoint markers associated with exhaustion (e.g. PDCD1 [gene for PD-1], CTLA4 and HAVCR2 [gene for TIM3]); cluster 5 was generally quiescent and expressed low levels of effector molecules (e.g. GZMH and KLRD1); cluster 6 expressed markers associated with naïve or memory cells (e.g. CCR7 and CD27); cluster 7 expressed genes associated with early activation (e.g. JUNB and FOSB); and cluster 8 expressed genes associated with effector function (e.g. KLRG1 and GZMH). We next assessed the biological functions associated with these clusters by using a competitive gene set enrichment test implemented in the new R package SingleSeqGset developed by our lab (STAR Methods). Interestingly, we found that the clusters containing exhausted CD8+ T cells differed in several ways, such as upregulation of co-simulation in cluster 3 and hypoxia signaling and interferon responses in cluster 4 (Figure 2D and Table S4).
Figure 2. CD8+ T cells share a differentiation trajectory towards co-expression of inhibitory receptors between HPV− and HPV+ TIL.

A total of 32,734 CD8+ T cells were recovered across all samples. (A) Clustering of CD8+ T cells by DRAGON revealed a total of 8 clusters across all samples. (B) Enrichment of clusters by sample types showed that clusters 1-4 were predominantly of TIL origin, while clusters 5-7 were composed of mixtures of PBMC, tonsil and TIL, and cluster 8 was predominantly TIL. (C) Differential gene expression analysis revealed signature genes associated with each cluster. Specifically, cluster 1 expressed genes associated with the cell cycle, cluster 2 was associated with interferon responses, and clusters 3 and 4 expressed immune checkpoints. (D) Gene set enrichment analysis to evaluate biological functions of each cluster. Interestingly, the 2 clusters of exhausted CD8+ T cells showing distinct biological functions. (E) Diffusion mapping embedding of CD8+ T cells revealed an activation trajectory beginning with naïve peripheral CD8+ T cells, and progressing to terminally differentiated CD8+ T cells. (F) The trajectories of CD8+ T cells from HPV− and HPV+ TIL were largely overlapping.
We next performed diffusion map analysis (a non-linear dimensional reduction technique; STAR Methods) to infer differentiation trajectories (Angerer et al., 2016; Haghverdi et al., 2016). The resulting two-dimensional diffusion map embedding uncovered a smooth trajectory that linked PBMC to TIL (Figure 2E and Table S5), and that was overlapping for HPV+ and HPV− TIL (Figure 2F).
To better characterize the relationship between diffusion trajectories and clusters, we visualized each cluster of CD8+ T cells on the diffusion map embedding, yielding a pattern consistent with gene set expression analysis (Figure S3A). We next characterized the two diffusion components (DC1 and DC2) by identifying the genes that were associated with each component (STAR Methods and Table S5). DC1 was strongly associated with a terminally differentiated phenotype, with progression along DC1 associated with increased co-expression of inhibitory receptors such as LAG3, CTLA4, PDCD1 (gene for PD1) and HAVCR2 (gene for TIM3) (Figure S3B). We also found high expression of ENTPD1 (gene for CD39) and CXCL13 by these terminally differentiated CD8+ T cells, suggestive of a role of these cells in adenosine metabolism (Deaglio et al., 2007) and attempted B cell recruitment (Ansel et al., 2002). DC2 was associated with a memory phenotype (Figure S3C), governed by co-expression of CD27, CCR7, EOMES and other genes associated with memory formation (Banerjee et al., 2010; Mahnke et al., 2013). In summary, we identified clusters of CD8+ T cells and inferred a differentiation trajectory that was shared between tumor types. This suggests that immunotherapy strategies targeting CD8+ T cells may be applicable to both viral- and carcinogen-induced HNSCC.
Extensive CD4+ Tconv heterogeneity and differentiation trajectories
Next, we compared the transcriptional landscape of CD4+ T cells between HPV− and HPV+ HNSCC, analyzing CD4+ Tconv cells and CD4+ Treg cells separately. Clustering of CD4+ Tconv cells revealed 7 distinct clusters (Figure 3A and B and Table S3). Gene set enrichment analysis (Figure S4A and Table S4) showed that PBMC-derived CD4+ Tconv were enriched for gene sets associated with naïve and memory (cluster 2), effector memory (cluster 3), and a mixture of effector and central memory (cluster 5). In CD4+ Tconv from TIL, we found that clusters 1 and 6 were comprised mostly of CD4+ Tconv from HPV+ TIL and tonsil CD4+ Tconv, while CD4+ Tconv from HPV− TIL were distributed between clusters 4 and 7. Tonsil and TIL CD4+ Tconv showed enrichment for a complex series of interrelated T follicular helper (TFH) and type 1 helper (TH1) signatures, with additional evidence of effector memory phenotypes. We statistically assessed the association between sample types and clustering for CD4+ Tconv (Figure S4B and STAR Methods), and we found that HPV+ TIL had significant enrichment of cells in this cluster versus HPV− TIL (p=0.0044, rank sum test).
Figure 3. Dissection of transcriptional states and differentiation trajectories in CD4+ Tconv and Treg.

A total of 45,640 CD4+ T cells were recovered from all samples, with 41,889 CD4+ Tconv and 3,751 Treg. (A-B) Tconv cells were separated into 7 clusters by DRAGON. (C) Three-dimensional diffusion map embedding of all CD4+ Tconv samples reveals a branching between CD4+ Tconv from HPV+ and HPV− TIL. (D) Two-dimensional regression planes show the differences in trajectories for CD4+ Tconv from HPV− and HPV+ TIL. (E) Heatmap showing the top 50 differentially expressed genes from clusters 1 and 7, the two terminal branches by diffusion analysis. Cluster 1 is associated with at T follicular helper (TFH) phenotype, while cluster 7 has an effector memory phenotype. (F-G) We identified 6 clusters of CD4+ Treg cells from all patients. The majority (89%) of CD4+ Treg were derived from TIL. (H) Gene set enrichment revealed IFN-responsive clusters (2 and 4) and clusters enriched for TNF targets/signaling (3 and 6). (I) Diffusion map embedding of CD4+ Treg from HPV− and HPV+ TIL revealed a consistent differentiation trajectory. (J) The density of CD4+ Treg along the DC1 axis was similar for HPV− and HPV+ TIL, but a slightly higher frequency of CD4+ Treg from HPV− TIL were earlier on the differentiation trajectory versus HPV+ TIL.
We next performed diffusion map embedding to reconstruct differentiation trajectories of CD4+ Tconv. In contrast to CD8+ T cells, visualization of the first 3 dimensions of the resulting diffusion map yielded a branching trajectory (DC1; Figure 3C and Table S5). We next fit regression planes between DC1, DC2 and DC3 for CD4+ Tconv derived from HPV− and HPV+ TIL, and found dramatically different differentiation planes between tumor types (Figure 3D). When viewing the first 2 dimensions of the diffusion map in conjunction with the inferred diffusion pseudotime (DPT; Figure S4C and D) as the third dimension, it was clear that DC1 and DC2 were both positively correlated with DPT, but were largely orthogonal to each other. Consistent with gene set enrichment analysis, cluster 2 was the most naïve cluster, and cells then passed through a continuous intermediate phenotype progressing towards terminal states defined by either cluster 1 or cluster 7 (Figure S4D). Top differentially expressed genes between clusters 1 and 7 uncovered TFH-related genes associated with cluster 1, and activation, interferon response and memory genes associated with cluster 7 (Figure 3E).
We next evaluated the genes associated with each of the diffusion components, and found a strong association between expression of CXCR5 and PDCD1 with DC1, consistent with the proposed TFH signature of these cells (Figure 3E). However, when viewing the expression of CXCR5 and PDCD1 in a three-dimensional embedding with DC1 and DPT, we found that co-expression of CXCR5 and PDCD1 is bimodal, with co-expression at early and late DC1 with respect to DPT (Figure S4E). Interestingly, we also found co-expression of other known inhibitory receptors (LAG3 and HAVCR2) at the same point where CXCR5 and PDCD1 co-expression is evident. This suggests a fate decision at this early point in DPT, where cells can either progress to CD4+ TFH or adopt a phenotype with co-expression of inhibitory receptors that potentially inhibits further differentiation. In summary, we found unique differentiation trajectories of CD4+ Tconv associated with HPV+ and HPV− HNSCC.
Reciprocal IFN- and TNFR-related signaling in CD4+ Treg
CD4+ Treg suppress anti-tumor immune responses in the TME, and recent studies in lung (Guo et al., 2018) and breast (Azizi et al., 2018) cancers have described unique transcriptional states of Treg in the TME. Using DRAGON, we found 6 distinct clusters that were largely dominated by TIL Treg (Figure 3F and G; Figure S5A and Table S3). We next performed gene set enrichment analysis to characterize the general biological activities in each cluster (Figure 3H and Table S4). Interestingly, clusters 2 and 4 had enrichment for gene sets associated with IFNa-response (IFN response genes [Browne]) and general IFN-response genes (IFN-induced antiviral module [Bosco]), while clusters 3 and 6 were enriched for tumor necrosis factor receptor (TNFR) family signaling pathways. The modules associated with IFN-response and TNFR signaling were mutually exclusive, suggesting that these cells respond to different signals depending on their differentiation state.
Diffusion map embedding of CD4+ Treg revealed that DPT was strongly correlated with DC1 (Figure 3I, Figure S5B and Table S5). There was a subtle difference in density of HPV− versus HPV+ TIL Treg along the DC1 axis, with more Treg from HPV− TIL at earlier DPT (Figure 3J). Consistent with the expression pattern inferred by gene set enrichment and cluster progression, we found that TNFRSF18 (GITR), TNFRSF9 (CD137; 4-1BB) and TNFRSF4 (OX40) were positively correlated with DC1 and were co-expressed at late DPT (Figure S5C). This observation supports the notion that the TNFR super-family is important for the maintenance of effector Treg cell populations (Vasanthakumar et al., 2017). Conversely, we found that IFN-response genes IFITM1, IFIT1, IFIT3, and ISG20 were expressed at early DPT and were turned off as pseudotime progressed (Figure S5D), suggesting a potential role of IFN-signaling in early activation of Treg. Taken together, this analysis suggests that Treg share a similar trajectory between HPV− and HPV+ HNSCC (although are more frequent at different states), and that IFN-related signaling and TNFR-family signaling are reciprocally related during differentiation.
Germinal-center B cells are found in HPV+ TIL
B cells within the TME have been found to correlate positively with overall survival across human tumor types (Al-Shibli et al., 2008; Milne et al., 2009; Nedergaard et al., 2008; Shi et al., 2013; Shimabukuro-Vornhagen et al., 2014; Woo et al., 2014), and can affect CD4+ Tconv cell phenotypes (Bruno et al., 2017). Clustering of B cells revealed 11 clusters (Figure 4A and Table S3). B cells from HPV+ TIL and tonsil tissue were strongly enriched in clusters 1-4, while B cells from HPV− TIL were mostly present in clusters 5 and 7 (Figure 4B). Gene set enrichment analysis identified naïve (clusters 6 and 9), memory (clusters 8 and 11), plasma cells (cluster 5), and germinal center B cells (clusters 1-4) (Figure 4C and Table S4). Overlapping enrichment of cell cycle and germinal center gene sets implies that clusters 3 and 4 are centroblasts, consistent with rapidly proliferating B cells found in the dark zone (Victora, 2014). Conversely, clusters 1 and 2 are also enriched for germinal center gene sets, but lack expression of cell cycle genes, suggesting these cells are centrocytes in the light zone, where they are subjected to selection by CD4+ TFH. B cells in HPV− TIL, in contrast to HPV+ TIL, were commonly found to be either plasma cells (cluster 5) or switched memory B cells (cluster 7). The presence of only plasma or early switched memory B cells in HPV− TIL states may be consistent with lack of CD4+ TFH help.
Figure 4. Analysis of tonsil and TIL B cells reveals granular details of germinal center B cells, and a unique B cell population associated with HPV− TIL.

A total of 16,736 B cells were recovered from all samples. (A-B) We identified a total of 11 clusters of B cell from tonsils, TIL and PBMC. (C) Gene set enrichment revealed a germinal center phenotype associated with clusters 1-4, enrichment of genes for plasma cells in cluster 5, and combinations of naïve, memory and switched B cells in other clusters. (D) Diffusion map embedding of all B cells colored by clusters as in (A). This three-dimensional embedding yielded axes related to germinal center formation (DC1), transition from naïve to memory B cells (DC4) and progression to plasma cells (DC3). Few HPV− B cells progress along DC1 to become germinal center B cells. (E) Same diffusion map embedding of as in (D), but colored by sample types. (F) The majority of HPV− B cells are concentrated on the right side of the DC1 axis, while HPV+ cells have a bimodal distribution along the DC1 axis (note log scale on the y axis in [F]).
Diffusion map embedding of B cells (Figure 4D and E and Table S5) revealed a complex process of differentiation across multiple axes. Inspection of the clusters (Figure 4D) and sample types (Figure 4E) revealed that DC4 was associated with progression from naïve to memory B cells. However, DC1 intersects DC4 halfway between the minimum and maximum of DC4, with progression from right to left along DC1 associated with germinal center formation. Consistent with the lack of germinal center B cells in HPV− HNSCC, B cells from HPV− HNSCC were more enriched towards positive values of DC1 (Figure 4F). Plasma cells (cluster 5) are located closer to memory B cell clusters, consistent with exit from germinal center reactions. Our analysis of B cells in the TME of HPV− versus HPV+ HNSCC led to the conclusion that germinal center B cells are present across various stages of progression through germinal center reactions in HPV+ HNSCC, while B cells are found in fewer numbers and non-germinal center states in HPV− HNSCC.
A common trajectory yields divergent myeloid states
Myeloid cells play important roles in shaping the immune response in the TME, and can be broadly classified as tumor associated macrophages (TAMs) and dendritic cells. TAMs are generally considered to be either anti- or pro-tumor (i.e. M1-like or M2-like, respectively) (Yang and Zhang, 2017). Recent studies have revealed more extensive heterogeneity among myeloid cells in the TME, with TAMs co-expressing features of both M1 and M2 in breast cancer (Azizi et al., 2018), and unique states of myeloid cells lung cancer (Lavin et al., 2017). We identified 8 clusters of myeloid cells, with clusters 2-4 primarily present in PBMC and clusters 1 and 5-8 present in TIL (Figure 5A and B and Table S3).
Figure 5. Unique states and potential plasticity of myeloid cells in the TME.

We identified a total of 26,599 myeloid cells consisting of 21,737 CD14+ monocytes/macrophages, 3,946 CD16+ monocytes, and 916 dendritic cells (DCs). (A) We identified 8 clusters of myeloid cells in PBMC, TIL and tonsil tissue by DRAGON. (B) Clusters 1 and 5-8 were enriched in tissue sites, while clusters 2-4 were largely present in PBMC. (C) Heatmap of the top 20 genes in each cluster was used to identify states of myeloid cells across clusters. Cluster 1 cells expressed characteristics of DCs, but also expressed IDO1. Cluster 6 was associated with a dendritic cell phenotype, while cluster 7 was strongly associated with cytokine and chemokine secretion. Cluster 8 was characterized by expression of complement and MRC1 (typically associated with type 2 macrophages). Cluster 5 appears to express genes associated with clusters 6-8, suggestive of a possible precursor relationship. (D-E) Three-dimensional diffusion map embedding of myeloid cells (colored by sample type [D] and clusters [E]) reveals separation between PBMC and TIL myeloid cells, but also differentiation from cluster 4 to 5 to 6/7/8. (F) The DC1 axis is associated with differentiation from peripheral to tissue myeloid cells, with overlapping portions from peripheral blood and tissue myeloid cells. (G) Two-dimensional regression planes show differentiation from cluster 5 to 6 and 7/8. It appears that cluster 6 can either differentiate from a spectrum of points along the 2D regression plane, or conversely that myeloid cells can transition from cluster 6 to cluster 7/8 states.
To better understand TIL populations of myeloid cells, we investigated top differentially expressed genes across clusters (Figure 5C and Table S3). This led to identification of cluster 2 as CD16+ monocytes, and two clusters of CD14+ monocytes (clusters 3 and 4). Importantly, cluster 3 had low expression of FCGR3A (gene for CD16), suggesting that it was a unique CD14+ monocyte cluster and not a transitional population of CD14+CD16+ monocytes. Within TIL, clusters 5 and 7 appeared to be highly secretory, expressing high levels of chemokines and cytokines. Clusters 1, 6, and 8 expressed relatively high levels of HLA molecules, consistent with antigen presenting cells, but differed in several ways. Cluster 1 had high expression of IDO1, CCL17 and CCR7, cluster 6 expressed CD1C (consistent with conventional DCs) and cluster 8 expressed complement. Cluster 8 also expressed the canonical M2 marker MRC1 (gene for CD206), although it was not among the top differentially expressed genes. Clusters 1 and 8 were more frequently found in HPV− TIL, suggestive of a potential immunosuppressive role in patients with HPV− disease.
We next performed diffusion map embedding, and identified several branches (Figure 5D and E and Table S5). Cluster 5 is central to the fate of myeloid cells in the TME, as it connects CD14+ monocytes from PBMC to TIL populations, and suggests a surprisingly smooth transition in expression states between PBMC and TIL CD14+ cells (Figure 5F). In the positive direction on the DC1 and DC2 axes, cluster 5 progresses towards clusters 7 and 8, which represent one terminal branch of this trajectory (Figure 5E-G). Cluster 6 appears to emerge from cluster 5 broadly across the trajectory towards clusters 7 and 8, suggestive of possible plasticity along this differentiation trajectory (Figure 5G). Cluster 8 appeared to an immature DC cluster, as it precedes more mature DCs on a shared trajectory (cluster 6). Our characterization of myeloid lineages in TME identified TAMs beyond the standard M1/M2 paradigm, smooth transitions between cell states, and several DC populations.
Global crosstalk between immune cells
Single cell transcriptomic analysis not only reveals cell intrinsic information, but can also probe putative cell extrinsic interactions through interrogation of ligand (surface or secreted) and receptor expression. To map possible cell-cell interactions, we first identified expression of ligands/receptors using a list of 708 unique ligands and 691 unique receptors that together can form a combined 2,557 potential interaction pairs (STAR Methods) (Ramilowski et al., 2015). We first evaluated the top ligands and receptors expressed in HPV− and HPV+ HNSCC (Figure 6A and B).
Figure 6. Expression patterns of receptors and ligands differ between HPV− and HPV+ TIL, and extensive putative cell-cell communication occurs in TIL.

Expression of genes for receptors and both cell-surface and secreted ligands was evaluated, as well as the cell-cell communication within and between cell types. (A) Log2 fold change in ligand expression between HPV− and HPV+ TIL reveals differences associated with chemokines/cytokines from HPV− TIL and CD40LG and other B cell activating stimuli from HPV+ TIL. (B) Myeloid-associated receptors are highly expressed in HPV− TIL, while receptors associated with B cells and germinal center activity are upregulated in HPV+ TIL. (C-F) Circos plots derived from the CellTalker algorithm, showing networks of interactions between ligands and receptors from different sample types. Extensive putative cell-cell communication is observable in healthy donor PBMC and tonsil tissue, and there is a massive expansion of cell-cell communication in TIL.
Of the larger potential set of ligands and receptors, we next identified those that participated in putative interactions within and between immune lineages using a new R package that we have developed called CellTalker (for evaluating cell-cell communication). Using CellTalker, we identified 168 ligands and 194 receptors that participated in 481 unique interactions. We next used the results from CellTalker to generate circos plots (Zhang et al., 2013) for visualization of these interactions. In the circos plots, each interaction is depicted as a line linking a ligand to a receptor across cell types (Figure 6C-F and Table S6). Interactions were broadly classified into three types: common interactions (those occurring in at least one other sample type), unique versus healthy donor PBMC, or unique versus all other sample types. Although there were many putative interactions in PBMC and tonsil samples, we found massive expansion of putative interactions across TIL populations. In addition to expanded cell-cell communication in the TME, we found unique axes of communication in HPV− and HPV+ TIL. While useful from a global perspective, understanding the spatial localization of immune cells to each other would provide a more rigorous framework for assessing putative cell-cell communication based on proximity.
Spatial organization is consistent with transcriptional signatures
Single cell transcriptomic analysis provides high-dimensional insight into the transcriptional states of individual cells, but provides no information about the spatial localization of cells in situ. As a complement to our scRNAseq analysis, we performed multispectral immunofluorescence (IF) on paired tissue sections from the same patient cohort (STAR Methods; Figure S6A). We captured 2-5 regions of interest (ROI) per slide, resulting in a total of 90 ROI from 24 patients.
After downstream processing (STAR Methods), we hierarchically clustered individual ROI based on the frequency of each immune cell subset present (Figure 7A, Figure S6B), reveal clusters associated with enrichment for specific immune lineages (Figure S6C and Figures 7B-F, left panels). From each image, we performed Delunay triangulation to identify the nearest neighbors of each cell in 2 dimensions (STAR Methods and Figure S6D), with the goal of identifying cells types that were most likely to interact with each other based on proximity. The odds of a cell type interacting with another given cell type was expressed as the log-odds ratio (Figure 7B-F, right panels). In clusters with the highest frequencies of B cells (clusters 3 and 5), B cells had the highest odds of interacting with other B cells, followed by interacting with CD4+ Tconv (Figure 7D and F). Indeed, in cluster 5 ROIs, we identified an organization pattern of immune cells reflective of tertiary lymphoid structures (TLS). Based on these spatial relationship, we next used CellTalker to infer specific differences in putative cell-cell communication networks between B cells and CD4+ Tconv in HPV− versus HPV+ TIL (Figure 7G and H and Table S7). Interestingly, and consistent with scRNAseq and IF analyses, we found putative ligand/receptor interactions between B cells and CD4+ Tconv in both HPV− and HPV+ TIL, but only HPV+ TIL had putative interactions between germinal center B cells (clusters B-1 through B-4) and TFH (cluster CD4-1).
Figure 7. Immunofluorescence analysis of sections from HNSCC provides insight into putative cell-cell communication based on spatial localization.

We performed immunofluorescence (IF) staining on tissue sections obtained from patients in our study. (A) Slides were clustered based on the frequency of cell types present, yielding a total of 5 clusters. (B-F) Representative IF images from each of the clusters identified in (A) shown on the left side of each panel, and the log odds of cell-cell proximity are shown for each image on the right side of each panel. A higher log odds of proximity implies that the cells tend to be in close in 2 dimensions. (G-H) CellTalker was used to identify putative interactions between the 7 clusters of CD4+ Tconv (Figure 3; CD4-1 to CD4-7) and 11 clusters of B cells (Figure 4; B-1 to B-11) identified by DRAGON. Ligand/receptor interactions between B cells and CD4+ Tconv were present in both HPV− and HPV+ TIL, but interactions between germinal center B cells (B-1 through B-4) and effector TFH cells (CD4-1) were exclusively present in HPV+ TIL. (I) Progression free survival analysis based on gene set enrichment for TFH signature (defined in Figure 3E) from HNSCC patients from the TCGA. Patients with higher TFH enrichment had significantly longer progression free survival.
We next utilized clinical data and bulk mRNAseq data from The Cancer Genome Atlas (TCGA) (Liu et al., 2018) to determine if CD4+ TFH signatures in HNSCC were related to survival (STAR Methods). We first filtered TCGA data to only include patients that underwent testing for p16, a surrogate for HPV+ HNSCC. Consistent with previously published data (Ang et al., 2010), we found a trend towards improved overall survival (HR=0.40 for HPV+ vs HPV−, p=0.071; data not shown), and significantly better progression-free survival (PFS) (HR=0.35 for HPV+ versus HPV− HNSCC, p=0.019; data not shown) in patients with HPV+ HNSCC (STAR Methods). We next evaluated enrichment of TFH gene signatures (derived from the differentially expressed genes associated with effector TFH from our scRNAseq data) across patients, and used stratification based on TFH scores to perform a monovariate progression-free survival (PFS) analysis (Figure 7I; STAR Methods). PFS probability was statistically significant in monovariate analysis, with a hazard ratio of 0.34 for high TFH versus low TFH enrichment (p=0.0029). Importantly, improved survival remained significantly associated with high TFH enrichment (HR=0.41, p=0.024) in a multivariate survival analysis after correction for 8 co-variates including T cell infiltration (Figure S7A). Taken together, we have identified unique patterns of immune infiltration across tissue sections, have characterized unique TFH effector and germinal center interactions using CellTalker and our scRNAseq data in HPV+ and HPV− HNSCC, and found that a transcriptional signature of TFH enrichment correlated with improved PFS.
Discussion
Immunotherapy has had unprecedented success, but still only substantively benefits a small proportion of patients and tumor types (Brahmer et al., 2012; Ferris et al., 2016; Ferris et al., 2018; Wolchok et al., 2017). Analysis of pre-therapy states of immune lineages is required to rationally identify new therapeutic strategies, as TME of different tumor types have unique immune signatures (Thorsson et al., 2018). In this study, we have used new bioinformatics tools and approaches to pursue an in-depth analysis of all CD45++ immune cells in the TME of patients with HNSCC of either carcinogen- (HPV−) or viral- (HPV+) mediated carcinogenesis. More generally, our experimental and analytical approaches can be applied to the dissection of any heterogeneous population of cells that differ in cell composition and transcriptional states between sample groups.
First, we found a spectrum of differences between immune lineages in HPV− versus HPV+ HNSCC. This has implications for the design of immunotherapy, as immune lineages that are similar in both types of HNSCC (i.e. CD8+ T cells and CD4+ Treg) can be targeted similarly, while those that are different (i.e. CD4+ Tconv, B cells and myeloid cells) may require more tailored therapies. The differences in immune lineages present in the TME of HPV+ versus HPV− HNSCC are potentially due to the presence of viral antigens throughout carcinogenesis, leading to activation of innate immune responses early on and enhanced T- and B-cell adaptive immune responses. The presence of viral antigens throughout carcinogenesis (Kobayashi et al., 2018), and perhaps in the tumor itself through episomal or integrated viral components (Koneva et al., 2018), may prime HPV+ patients for enhanced anti-tumor immunity.
Next, we identified subpopulations present within major immune lineages within HNSCC tumors. Recent work has characterized states of CD8+ T cells in various tumor types, in both treated and untreated conditions (Guo et al., 2018; Sade-Feldman et al., 2018; C. Zheng et al., 2017). Consistent with previous reports, CD8+ T cells co-expressed inhibitory receptors at terminal differentiation (Azizi et al., 2018; Guo et al., 2018). Interestingly, we also found two clusters of exhausted CD8+ T cells with different biological functions, including response to hypoxia in cluster 4. Hypoxia inducible factors have previously been shown enhance CD8+ T cell effector functions (Doedens et al., 2013; Finlay et al., 2012), suggesting that this cluster may retain higher anti-tumor activity versus cluster 3 which does not have enrichment of hypoxia signaling.
Enrichment of CD137high Treg was recently found to be associated with poorer overall survival (Guo et al., 2018), consistent with expression of TNFR-family receptors on Treg reflecting an underlying effector state (Vasanthakumar et al., 2017). Treg in our study were characterized by reciprocal expression of both IFNα-signaling and general IFN-response genes early during differentiation, in contrast to TNF-family receptors late in differentiation. Given that IFN-γ drives Treg fragility (Overacre-Delgoffe et al., 2017), it seems that early activated subpopulations of Treg may be amenable to IFN-γ based therapy, while chronically activated Treg may be more sensitive to blockade of TNFR-family mediated signaling.
In contrast to CD8+ T cells and CD4+ Treg, CD4+ Tconv were highly dissimilar between types of HNSCC. CD4+ Tconv exhibited a differentiation trajectory where cells pass through a common early activation state before branching into terminal states associated with TFH or exhausted signatures. Whether TFH and TH1 are unique lineages or share plasticity is controversial (Hale et al., 2013; Liu et al., 2012; Pepper et al., 2011), but our data suggest there is plasticity during early stages of activation. Appreciation of the complexity and heterogeneity present in CD4+ Tconv in the TME can provide new avenues for therapeutic intervention based on manipulating CD4+ Tconv responses. Recent work has highlighted the importance of TFH in vaccine design (Linterman and Hill, 2016), and our transcriptional analysis can further inform our understanding of TFH in distinct tissue sites.
Recent studies have suggested that tumor-associated myeloid cells are more heterogeneous than previously appreciated (Azizi et al., 2018; Lavin et al., 2017). We characterized 5 sub-populations of myeloid cells in the TME, consisting of IDO1+ DCs, transitional monocytes, DCs, inflammatory macrophages and complement-expressing DCs. While CCR7+ DCs can secrete IL-12 and possess antitumor activities (Garris et al., 2018), this population of DCs identified here also co-express IDO1, and may have the potential to inhibit antitumor immunity (Li et al., 2016). Interestingly, we found that TME-resident myeloid cells shared a continuous trajectory with CD14+ monocytes, and that this trajectory extended to divergent terminal states of myeloid cells. One terminal population expressed CD1C and HLA molecules, while the other expressed complement, cytokines and chemokines. A high level of complement expression is associated with immature DCs (Son et al., 2012) that are poor T cell simulators (Castellano et al., 2007), suggesting that maturation of this DC subset could improve anti-tumor T cell responses. Finally, the highly secretory macrophage population we observed likely contributes to increased invasiveness through IL6 (Chang et al., 2013), pro-metastatic conditions through IL1B (Guo et al., 2016), and angiogenesis through CXCL8 (Li et al., 2003). Although myeloid derived suppressor cells (MDSCs) are an important population in the TME of HNSCC (Pak et al., 1995; Weed et al., 2015), we did not recover cells consistent with an MDSC phenotype in our scRNAseq analysis. MDSCs have been reported to be associated with immunosuppressive features including expression of PD-L1 and FOXP3 and inversely correlated with CD8+ T cells and helper responses in the TME (Campbell et al., 2018). Future studies should seek to specifically interrogate the roles of MDSC populations in the peripheral blood and TME of patients with HNSCC.
Cell intrinsic phenotypes provide useful information on the potential states that can be occupied by a given lineage, but do not provide information about cell-cell communication or spatial proximity between cells. We therefore performed both global and cell-type specific analysis of putative cell-cell communication using our CellTalker algorithm. Several groups have recently begun to evaluate putative receptor/ligand signaling by scRNAseq (Kumar et al., 2018; Vento-Tormo et al., 2018), but have yet to thoroughly examine immune interactions in the TME. Our global analysis revealed baseline interactions between cell types in healthy donor PBMC, but massive expansions of putative cross-talk in the TME. In depth analysis and validation of the putative interactions described here can be pursued further to better understand the ecosystem fostered by intercellular communication in the TME.
To further contextualize our findings, we performed IF analysis on sections obtained from the same cohort of HNSCC patients. We used this analysis to characterize the spatial locations of immune and tumor cells, and identified immune populations that likely participated in cell-cell communication based on proximity. In several instances, we found that CD4+ Tconv were likely to participate in interactions with B cells, and most notably we identified tertiary lymphoid structures (TLS) in regions that contained high numbers of B cells. TLS have been associated with improved survival across many cancer types (Sautes-Fridman et al., 2016), and specifically in HNSCC (Wirsing et al., 2014). Finally, we assessed the clinical significance of TIL CD4+ TFH, utilizing a gene set derived from our data. This mono- and multi-variate analysis revealed that enrichment of a CD4+ TFH signature was associated with superior PFS, implicating TFH as a potentially favorable biomarker.
This study provides in depth analysis of individual immune lineages, cross talk between these lineages, and spatial localization that together form a clinically relevant and unified picture of the immune landscape in HNSCC. Overall, our study contributes to the understanding of the pan-immune landscape in patients with carcinogen- versus virally-induced cancers, and serves as a foundational framework, reference dataset and essential resource for future in-depth exploration of the roles of immune cells in HNSCC and other tumor types.
STAR Methods
Contact for reagent and resource sharing
Additional information and requests for resources should be directed to the Lead Contact, Dario A.A. Vignali (dvignali@pitt.edu).
Experimental Model and Subject Details
Patient samples were obtained from consecutive HPV− and HPV+ HNSCC patients, all of whom were immunotherapy treatment naïve. Peripheral blood was drawn by venipuncture into tubes with EDTA anticoagulant. Tumor specimens for experiments involving fresh tissue were resected in the operating room and immediately collected in RPMI with 10% fetal bovine serum (FBS), 1% amphotericin B and 1% penicillin/streptomycin. Paired tumor specimens were also collected into formalin for downstream immunohistochemistry and immunofluorescence analysis. Similarly, tonsils were obtained from patients undergoing tonsillectomy as treatment for sleep apnea, and were collected in the same media used for tumor collection. Healthy donor peripheral blood was collected by venipuncture, using EDTA as the anticoagulant. All patients provided informed written consent, and this study was approved by our Institutional Review Board (University of Pittsburgh Cancer Institute, Protocol 99-069).
Method Details
Processing of patient samples
Peripheral blood mononuclear cells (PBMC) were isolated from whole blood by density gradient centrifugation in Ficoll/Hypaque for 20 minutes at 400xg with the brake off. PBMC were then washed with Hanks Buffered Saline Solution and resuspended in staining buffer (phosphate buffered saline [PBS] with 0.1% azide, 10 mM HEPES, and 2% FBS). Single cell suspensions were generated from tumor or tonsil tissue by either mechanical disruption or mechanical disruption followed by enzymatic digestion with 50 mg/mL of Liberase DL (Roche) in 5 mL of serum-free RPMI for 15 minutes at 37°C. After initial isolation from tissue, cells were passed through a 100μm filter and spun at 500xg for 10 minutes to yield single cell suspensions. No discernable difference was present in cell yields, viability, or transcriptional signatures of samples that were either mechanically disrupted or disrupted and treated with Liberase. Carryover red blood cells were lysed with BD Pharm Lyse, and samples were then resuspended in staining buffer. Cells were stained for sorting by incubation with PE-conjugated mouse anti-human CD45 (clone: 2D1; Biolegend) at a 1:100 dilution for 15 minutes at 4°C, spun down at 500xg for 5 minutes, and incubated in PBS with 1:4000 eFluor 780 viability dye (eBioscience) for 15 minutes at 4°C. Cells were then resuspended in staining buffer, and sorted for live CD45+ cells on a MoFlo Astrios at the Hillman Cancer Center Cytometry Facility. Samples were collected in RPMI supplemented with 10% FBS, nonessential amino acids, L-glutamine, penicillin/streptomycin and sodium pyruvate. All samples were processed as soon as possible following surgery.
Flow cytometry of major cell lineages
Flow cytometry was used to assess the following major cell lineages: CD8+ T cells, conventional CD4+ T cells, regulatory T cells, B cells, myeloid cells (monocytes, dendritic cells and plasmacytoid dendritic cells), natural killer cells and granulocytes. Staining was performed as per preparation for cell sorting described above, with the addition of fixation and permeabilization for intracellular staining with the Foxp3/Transcription Factor kit (eBioscience). The antibodies and viability dyes used are described in the Key Resources Table.
Key Resources Table
| REAGENT or RESOURCE | SOURCE | IDENTIFIER |
|---|---|---|
| Antibodies | ||
| Fixable viability dye eFluor450 | eBioscience | Catalog number: 65-0863-14 |
| Fixable viability dye eFluor780 | eBioscience | Catalog number: 65-0865-14 |
| Monoclonal mouse anti-human CD45, clone 2D1, PE conjugated | Biolegend | Catalog number: 368510, RRID: AB_2566370 |
| Monoclonal rat anti-human CD4, clone RPA-T4, BV785 conjugated | Biolegend | Catalog number: 100552, RRID: AB_2563053 |
| Monoclonal mouse anti-human CD8, clone RPA-T8, BV650 conjugated | Biolegend | Catalog number: 301042, RRID: AB_2563505 |
| Monoclonal ratanti-human FOXP3, clonePCH101, eFluor450 conjugated | eBioscience | Catalog number: 48-4776-42, RRID: AB_1834364 |
| Monoclonal mouse anti-human CD25, clone BC96, BV711 conjugated | Biolegend | Catalog number: 302636, RRID: AB_2562910 |
| Monoclonal mouse anti-human CD56, clone HCD56, Alexa700 conjugated | Biolegend | Catalog number: 318316, RRID: AB_604104 |
| Monoclonal mouse anti-human CD19, clone HIB19, PE-Cy7 conjugated | Biolegend | Catalog number: 302216, RRID: AB_314246 |
| Monoclonal mouse anti-human CD20, clone 2H7, PerCP-Cy5.5 conjugated | eBioscience | Catalog number: 45-0209-42, RRID: AB_10717086 |
| Monoclonal mouse anti-human HLA-DR, clone L243, FITC conjugated | eBioscience | Catalog number: 11-9952-41, RRID: AB_2572542 |
| Monoclonal mouse anti-human CD123, clone 6H6, BV650 conjugated | Biolegend | Catalog number: 306020, RRID: AB_2563827 |
| Monoclonal mouse anti-human CD14, clone 63D3, Alexa700 conjugated | Biolegend | Catalog number: 367114, RRID: AB_2566716 |
| Monoclonal mouse anti-human CD11C, clone 3.9, PE-Dazzle conjugated | Biolegend | Catalog number: 301642, RRID: AB_2564083 |
| Monoclonal mouse anti-human CD15, clone W63D, BV711 conjugated | BD Bioscience | Catalog number: 563142 |
| Monoclonal mouse anti-human CD66b, clone G10F5, APC conjugated | Biolegend | Catalog number: 305118, RRID: AB_2566607 |
| Monoclonal mouse anti-human CD8, clone ACI3160A | Biocare Medical | Catalog number: ACI3160A |
| Monoclonal mouse anti-human CD20, clone L26 | Leica Biosystems | Catalog number: CD20-L26-L-CE, RRID: AB_10983209 |
| Monoclonal rabbit anti-human CD68, clone D4B9C | Cell Signaling | Catalog number: 76437S |
| Monoclonal rabbit anti-human FOXP3, clone D608R | Cell Signaling | Catalog number: 12653S |
| Monoclonal rabbit anti-human CD4, clone RM | Biocare Medical | Catalog number: API3209 AA |
| Monoclonal mouse anti-human Pan-Cytokeratin, clone AE1/AE3 | Santa Cruz | Catalog number: AE1/AE3 |
| Biological Samples | ||
| See Table S1 for a list of study subjects. | ||
| Chemicals, Peptides, and Recombinant Proteins | ||
| Foxp3 / Transcription Factor Staining Buffer Set | eBioscience | Catalog number: 00-5523-00 |
| Critical Commercial Assays | ||
| Chromium Single Cell 3' Library & Gel Bead Kit v2, 16 rxns | 10X Genomics | Catalog number: 120237 |
| Perkin Elmer 7 color manual kit | Perkin Elmer | Catalog number: NEL811001KT |
| Illumina NextSeq 500/550 High Output Kit v2 (150 cycles) | Illumina | Catalog number: TG-160–2004 |
| Deposited Data | ||
| Raw sequencing data are available through the NCBI Sequence Read Archive (BioProject ID 579178) and processed gene barcode matrices will be accessible via the Gene Expression Omnibus (GSE139324). | ||
| Software and Algorithms | ||
| CellRanger (version 2.1.0) | 10X Genomics | https://support.10xgenomics.com/single-cell-gene-expression/software/pipelines/latest/what-is-cell-ranger |
| FlowJo version 10 | TreeStar | https://www.flowjo.com/ |
| R version 3.5.1 (“Feather Spray”) | The R Foundation for Statistical Computing | https://www.r-project.org/ |
| Seurat | Andrew Butler, Paul Hoffman, Peter Smibert, Efthymia Papalexi, Rahul Satija | Citation: Butler et al (Butler et al., 2018) Hosted on: https://satijalab.org/seurat/ |
| caret | Kuhn, M. Wing, J. Weston, S. Williams, A. Keefer, C. Engelhardt, A. Cooper, T. Mayer, Z. Kenkel, B. R Core Team. Benesty, M. Lescarbeau, R. Ziem, A. Scrucca, L. Tang, Y. Candan, C. Hunt, T. |
Citation: Kuhn et al (Kuhn et al, 2019) |
| Destiny | Philipp Angerer, Laleh Haghverdi, Maren Büttner, Fabian Theis, Carsten Marr, Florian Büttner | Citation: Angerer et al (Angerer et al., 2016) and Haghverdi et al (Haghverdi et al., 2016) Hosted on: https://bioconductor.org/ |
| DeteRministic Annealing Gaussian mixture mOdel clusteriNg algorithm (DRAGON) | Anthony Cillo, Vignali Lab | Hosted on: http://www.github.com/arc85/dragonsc |
| CellTalker | Anthony Cillo, Vignali Lab | Hosted on: http://www.github.com/arc85/celltalker |
| SingleSeqGset | Anthony Cillo, Vignali Lab | Hosted on: http://www.github.com/arc85/singleseqgset |
| Phenochart version 1.0.9 | Perkin Elmer | www.perkinelmer.com |
| inForm version 2.3 | Perkin Elmer | www.perkinelmer.com |
| Fiji 64-bit | ImageJ |
http://imagej.net/Fiji Citation: Schindelin et al (Schindelin et al., 2012); RRID: SCR_003070 |
Immunofluorescence staining of tissue sections
Formalin-fixed paraffin embedded tissues were mounted on slides, followed by deparaffinization using xylene and ethanol. Tissues were then fixed in neutral buffered formalin for 15 minutes, followed by antigen retrieval. Heat induced epitope retrieval was performed using repeated cycles in AR6 or AR9 citrate buffers (Perkin Elmer), followed by 10 minutes of blocking prior to incubation with primary antibodies for 30 mins. Secondary antibodies conjugated to horseradish peroxidase were added after washing, and were incubated for 10 minutes. The following Opal detection fluorophores were used: CD4∷Opal540, CD8∷Opal570, CD20∷Opal520, CD68∷Opal650, FOXP3∷Opal620, and Pan-cytokeratin∷Opal690. A final round of antigen retrieval was carried out to counterstain nuclei with 4’,6-diamidino-2-phenylindole (DAPI). Slides were then sealed using the Diamond Anti-fade mountant (Thermo Fisher).
Acquisition of immunofluorescence images
Immunofluorescence (IF) images were captured on the Vectra (Perkin Elmer), first as whole side scans, and then as regions of interest based on the presence or absence of immune structures on each slide. Immune structures were identified by a pathologist based on standard H&E staining of tissues, and a minimum of 3 and maximum of 6 regions of interest were captured from each slide. These regions encompassed both the tumor bed and tumor stroma, and included regions containing tertiary lymphoid structures and those that did not. Regions of interest were captured at 10x magnification on the Vectra to incorporate a large area of the slide for analysis.
Generation of single cell libraries
Single-cell libraries were generated from sorted live CD45+ cells using the Chromium Single Cell 3’ Reagent (V2 Chemistry) as previously described (G.X. Zheng et al., 2017). Briefly, sorted cells were resuspended in PBS with 0.04% bovine serum albumin (BSA; Sigma) and were counted using the Cellometer Auto2000 (Nexcelom). Cells were then loaded into the Single Cell Chip and processed through the 10X controller for droplet generation (targeting a recovery of 2,000 cells per sample), resulting in droplets containing a single cell and bead per droplet. After droplet generation, cells were subjected to in-drop lysis and reverse transcription, resulting in single-cell transcriptomes bearing bead-specific sequences to identify the cell of origin. Following reverse transcription, cDNA was isolated and amplified by 12 cycles of PCR. Amplified cDNA was then size-selected by SPRISelect Beads, and subjected to enzymatic fragmentation, end repair, and A-tailing. Adaptors were then ligated, and sample indices were added by PCR. Samples were then size-selected by SPRISelect, and the concentration was determined by KAPA DNA Quantification. The end result of this process is library constructs containing P5 and P7 Illumina sequencing adaptors, a 16 base pair cell barcode, 10 base pair unique molecular identifier (UMI), a gene insert and an i7 sample index.
Sequencing of single cell libraries
Following generation of single cell libraries, samples were diluted to 2 nM and pooled into sets of 2. Libraries generated from PBMC and TIL were pooled together from all HNSCC patients, and healthy donor PBMC and tonsil were paired with each other. These pooled libraries were further diluted to 2 pM, then were denatured and loaded on a NextSeq500 at the Health Sciences Sequencing Core at Children’s Hospital of Pittsburgh. Samples were run using NextSeq 500/550 High Output v2 kits (150 cycles) with the following sequencing run parameters: Read 1: 26 cycles; i7 Index 8 cycles; Read 2: 98 cycles.
Demultiplexing, alignment, and generation of gene/barcode matrices
Following sequencing, runs were processed through the CellRanger (10X Genomics, version 2.1.0) pipeline to generate gene/barcode matrices. This was achieved by first demultiplexing samples using the sample indices present in the sequencing libraries, and converting Illumina BCL files to FASTQ. Reads from these FASTQ files were then aligned using the GRCh38 reference using STAR (Dobin et al., 2013), as implemented in CellRanger.
Quality control metrics and filtering
After alignment using CellRanger, key sequencing metrics including the frequency of valid cell barcodes, transcriptome mapping rate, and the frequency of Q30 bases across each of the read groups was interrogated to ensure high-quality sequencing and alignment results. Samples were then combined into a unified gene/barcode matrix. After creation of the gene/barcode matrix, a cell-level filtering step was performed to remove cells with either few genes per cell (<200) or many molecules per cell (>20,000). Next, genes that were lowly expressed (fewer reads than 3 counts in 1% of cells, or genes expressed in fewer than 1% of cells) across all samples were removed.
Pseudobulk analysis
We performed an initial analysis of the data by treating the single-cell RNA profiles as pseudobulk expression matrices to evaluate high-level trends in the data. Pseudobulk expression profiles were generated for each sample by summing the gene counts across cells, to form an expression matrix consisting of one expression profile per patient. Gene expression counts xa were converted into the natural log of transcripts per million (transcripts per million) plus one by:
We then identified differentially expressed genes between PBMC, TIL and tonsil tissue by comparing linear models for each gene using the tissue type as a predictor versus a null model. We assessed statistical difference between the null model and the full model using the likelihood ratio. Genes were considered to be differentially expressed if the false discovery rate corrected p-value across all genes was 1% or less. We next formed a correlation matrix using Spearman’s correlation across all samples using all differentially expressed genes, and clustered the samples using hierarchal clustering with one minus the correlation matrix as the distance measure. The resulting inter-sample correlation was then visualized using the R package heatmap3 (http://CRAN.R-prject.orq/package=heatmap3). Next, we evaluated genes that were differentially expressed between PBMC and TIL as described above, and performed clustering and visualization of the gene-gene correlation matrices using a union of the top 50 genes that were expressed in both PBMC and TIL. We performed a similar analysis to identify gene-gene correlations between genes that were differentially expressed between clusters of TIL, using a union of the top 50 differentially expressed genes between each cluster of TIL.
Post-hoc power analysis using pseudobulk RNAseq data
We next performed a post-hoc power analysis for the identification of differentially expressed genes between the TIL and tonsil clusters. This was accomplished by determining the mean and standard deviation of the expression of each gene across clusters, and then performing bootstrapped sampling of genes to form in silico patient groups with a balanced experimental design (e.g. 3 vs 3 vs 3). A total of 20 bootstrapped comparisons were performed with sample sizes ranging from 3 to 10 samples per group. The number of differentially expressed genes in each bootstrapped group was evaluated using the likelihood ratio model as described above, and was compared to the actual number of recovered differentially expressed genes from the experimental data. The power was determined by taking the ratio of number of bootstrapped differentially expressed genes versus the actual number of differentially expressed genes.
Library size normalization for single-cell RNAseq analysis
Gene expression counts within each cell were normalized for library size by multiplying the raw count for each gene in each cell by the number of molecules detected in that cell, dividing by 10,000 and then taking the log of the normalized count value plus 1. That is, for a given gene a in cell x, the normalized count is:
Dimensional reduction and visualization
After generating the library-size normalized gene/barcode matrix, we next sought to reduce the dimensionality of the data for downstream visualization and clustering. First, highly variable genes were identified based on high dispersion when controlling for the relationship between expression magnitude and variance. The top 500 to 1000 genes (depending on the cell type) by dispersion were carried forward into scaling and principal component analysis (PCA). Prior to PCA, unwanted sources of variation (i.e. the number of genes per cell, percent of mitochondrial genes per cell, and percent of ribosomal genes per cell) were controlled for using an approach implemented in Seurat and based on single-cell latent variable models (Buettner et al., 2015), resulting in scaled and centered corrected values. Notably, controlling for the library size of each cell and regressing out the above mentioned known sources of variation reduced sample-specific biases. PCA was then performed using the augmented implicitly restarted Lanczos bidiagonalization algorithm (Baglama and Reichel, 2006) using scaled and centered expression values of the identified highly variable genes as input. PCs were heuristically selected for downstream analysis based on the magnitude of variation explained, including all PCs until a negligible increase in the variation explained was achieved.
For low-dimensional visualization of the high-dimensional differences in expression between cells, we utilized two approaches. The first is a fast Fourier transform Interpolation-based t-distributed stochastic neighbor embedding (FItSNE) that greatly accelerates the time required to calculate the cell embeddings (Linderman et al., 2019). Additionally, FItSNE performs both early- and late-exaggeration steps that leads to superior separation of groups of cells compared with standard Barnes-Hut tSNE (Maaten, 2014; Maaten and Hinton, 2008). The second visualization approach utilized was the result of non-linear dimensionality reduction using diffusion map embedding, as described below (see Diffusion map embedding).
Deterministic annealing Gaussian Mixture Model clustering
We have developed and implemented a DeteRministic Annealing Gaussian mixture mOdel clusteriNg algorithm clustering (DRAGON) for single-cell RNAseq data based on deterministic annealing (Rose, 1998; Rose et al., 1990a; Rose et al., 1990b). In the most general sense, deterministic annealing seeks to minimize a specific cost function based on a constraint on the randomness of the solution, and reduces the constraint on the randomness with each successive step of the algorithm. In the context of clustering, deterministic annealing solves a nonconvex optimization problem by finding the global minimum under decreasing restrictions on the entropy of the system. In practice, this approach has several favorable features, including the avoidance of local minima, progressive clustering results at each stage of the algorithm describing the strongest trends in the data, a statistical framework (in our case, a Gaussian mixture model [GMM]), and steps that are highly parallelizable, leading to increased speed for large datasets.
Deterministic annealing is analogous to the physical process of annealing, where a system is kept at thermal equilibrium as the temperature is gradually lowered, ultimately resulting in the global minimum of the system when the temperature reaches zero. To apply this physical principal to clustering, we seek to minimize the energy of a system at a given value of randomness (defined in our clustering algorithm as “temperature”, T), and progressively decrease the temperature. The minimum energy at a given T depends on both the strength of the associated between a point and a distribution, and the entropy of the system, as described below. To assess the strength of the association between a given cell and a distribution we define the following cost function:
Where is a point vector and is a given distribution from one of j distributions. We define as the squared Euclidean distance between a point vector and the centroid of cluster .
We seek to minimize C at a given level of disorder of the system, and define this as a minimization of the Lagrangian E = C – TH, where C is the cost function, T is the temperature of the system, and H is the disorder of the system given by Shannon’s entropy. Minimization of E with K components of a GMM can be rewritten as a centroid condition with respect to the association probabilities (Rose, 1998), which leads naturally to an expectation/maximization (EM) framework where the minimization of E at each temperature T is achieved through the maximization of −E.
To perform EM, we define our system as a GMM at each T:
where X represents (, ,…,) cells, aj is the mixing parameter of the j component of K mixtures such that , and Sj is the covariance matrix for the j component. We begin deterministic annealing with K=2 components, and increase the number of components up to a maximum value of K as T is decreased, as discussed below. Additionally, we use cell embeddings in principal component space to initially reduce the dimensionality of the dataset.
To achieve minimization of E through EM, we first set the aj mixing parameters, values of the mean (), and covariance matrices (Σj) for each K. Then, we perform expectation to determine the association probabilities between each cell for each K at a given T using the Gibbs distribution:
We defined the log likelihood as:
To perform maximization, we define each cell as belonging to the nearest K distribution. We then calculate the parameters of each K component:
We note here that the covariance of each K component is related to T through . We perform EM iterations at a given T until either convergence of the log likelihood or a set number of iterations. Then we decrease the temperature and repeat EM iteratively until T=0.
Another favorable attribute of deterministic annealing is that the K components can be predictably split based on T, as previously described (Rose, 1998). Briefly, the critical value of T at which a component should be split into two daughter components is:
where λ is the largest eigenvalue of the covariance matrix of the component K. In other words, when T crosses a threshold below 2λ for a given component, that component is subsequently split.
With these principles, we can define an outline of DRAGON as follows:
| Algorithm 1: DRAGON | |
|---|---|
| INPUT PCA components derived from highly variable genes | |
| PARAMETERS Set maximum number of clusters (K), vector of temperatures (T), number of iterations (Z), convergence criterion | |
| 1 | FOR T in initial to final temperature |
| 2 | IF T>0 |
| 3 | IF Number of clusters < Maximum clusters |
| 4 | Split clusters with 2λ > T |
| 5 | FOR Z iterations or convergence |
| 6 | Expectation |
| 7 | Maximization |
| 8 | END |
| 9 | IF T=0 |
| 10 | FOR Z iterations or convergence |
| 11 | Expectation |
| 12 | Maximization |
| 13 | END |
| 14 | END |
Benchmarking of Seurat versus DRAGON clustering
We performed a benchmarking analysis of DRAGON versus Louvian clustering to determine the relative robustness and reliability of these two clustering algorithms. To benchmark these two algorithms, we used simulated data generated from the R package splatter (Zappia et al., 2017). Briefly, splatter generates simulated single-cell count matrices based on input parameters derived from a given data set (or generated randomly), and takes additional parameters to describe the number of clusters, the frequency of cells in each cluster, and the degree of differential gene expression between clusters. We sampled 5000 cells from our overall count matrix to generate baseline input parameters for splatter, and create a diverse variety of simulated cluster sizes and differential expression. To generate frequencies of cells in clusters that sum to 1, we randomly drew 4 values from a Poisson distribution centered at 5, then divided these values by the sum of the 4 values. To generate differential gene expression values, we took the absolute value of 4 values drawn from a normal distribution centered at 0.25 and with a standard deviation of 0.25. We repeated this sampling process 50 times. Next, we performed normalization and dimensionality reduction, and performed Louvian (as implemented in Seurat) and DRAGON clustering on each set of simulated data. For Louvian clustering, we set the resolution parameter in Seurat to 0.3, 0.4, 0.5, 0.6 and 0.7 to ensure that 4 clusters were recovered. Results were compared to the ground truth cluster identities from the splatter simulations using confusion matrices from the R package caret (Kuhn et al., 2019).
Identification of major canonical immune lineages
Identification of major immune cell lineages was performed using DRAGON in conjugation with the expression of canonical lineage markers. One of the favorable features of DRAGON is the ability to evaluate clustering solutions at varying levels of entropy using the temperature term T. At high levels of T, only strong separations of clusters are permitted based on the required minimum entropy of the system. In our data, these differences are largely those given by differences in immune lineages (e.g. B cells vs T cells, myeloid cells vs B cells). As such, we identified a solution with 4 clusters that was largely representative of differences in immune lineages. These 4 clusters were then bioinformatically isolated, and re-clustered to identify finer separations between the clusters. For convenience, the Phenograph-based clustering algorithm implement in Seurat (Levine et al., 2015; Xu and Su, 2015) was used to quickly perform sub-clustering. Differentially expressed genes across clusters were then compared to canonically expressed genes associated with major immune lineages to classify all individual cells.
Quantifying differences between immune lineages in HPV− versus HPV+ TIL
After major immune lineages were identified, we next evaluated the differences in expression between lineages derived from HPV− versus HPV+ TIL. This was accomplished by measuring the similarity of the distributions of immune lineages derived from each type of TIL. We used the Bhattacharyya distance to measure the distance between lineages from each type of TIL. We only evaluated distances between lineages that had 500 or more cells present across all samples from each tumor type. We embedded all lineages in a new PCA space based on highly variable genes present in the dataset, and retained the top 50 PCs for each analysis. We then sampled 500 cells from each tumor type 100 times, and calculated the Bhattacharyya distance as:
Where and are the mean vectors of each distribution, and . Importantly, we also assessed the Bhattacharyya distance between cells sampled independently of sample group to generate a background distribution for statistical comparison.
Overall clustering and clustering of lineage subpopulations
Initially, DRAGON was performed on the entire dataset to identify the major trends, and to identify the major immune lineages. Following the identification of the major lineages, cells were bioinformatically segregated into the following groups: CD8+ T cells, CD4+ Tconv and Treg, B cells, myeloid cells, natural killer cells, plasmacytoid DCs (pDC) and mast cells. Segregating cells into individual lineages, then identifying highly variable genes and reducing the dimensionality with PCA as described above allowed for a more refined identification of trends within each immune lineage.
Identification of cluster markers
We identified differentially expressed genes between clustering using a Wilcoxon rank sum test, comparing natural log transformed and library size normalized expression values between the cluster of interest and all other clusters, or between two targeted clusters. Genes were required to be expressed in 10% of cells in each cluster with an average log-fold change greater than 0.5 to be considered differentially expressed, as implemented in Seurat (Butler et al., 2018). The Wilcoxon rank sum test has the advantage of being nonparametric and therefore not sensitive to the underlying distribution of gene expression.
Gene set enrichment to describe clusters
Gene set enrichment analysis was used to determine the relationship between gene expression within clusters and sets of genes of known biological significance. Gene set enrichment was performed using a modification of the competitive gene set enrichment test CAMERA (Wu and Smyth, 2012), implemented in our R package SingleSetGset. Briefly, gene set enrichment testing was performed by determining the mean gene expression per cluster, and assessing the log fold-change in gene expression between a given cluster and mean expression of the same gene in all cells outside the given cluster as the test statistic. Gene sets used for analysis were derived from either the C2 (curated gene sets) or C7 (immunologic gene sets) database available through the MSigDB Collections at the Broad Institute for all gene set analysis. For subpopulations in which the C7 gene sets were utilized, gene sets were curated from the C7 immunologic signatures based on relevance to the cell type of interest, and only contained comparisons between cells of the same type. This gene set enrichment analysis is implemented in the SingleSeqGset R package.
Diffusion pseudotime analysis
To infer differentiation trajectories, diffusion analysis was applied as implemented in the R package Destiny (Angerer et al., 2016; Haghverdi et al., 2016). Briefly, a symmetric transition matrix was constructed based on cell adjacency using a locally-scaled Gaussian kernel, the eigenvectors of which correspond to diffusion components. Pseudotime was calculated by time evolution of a probability density function described by a graph Laplacian matrix, where the first eigenvalue of the transition matrix was removed to create a new matrix M, and diffusion pseudotime was calculated as a distance metric between the rows of M. Input genes were selected for diffusion analysis based on significant differential expression between clusters. Cells in CD8+ T cells and CD4+ Treg that were in the cell cycle were excluded from diffusion analysis. Genes were evaluated for significant associations with diffusion components by a likelihood ratio test comparing a null model with just gene expression versus a model with gene expression and the diffusion component of interest. Genes with a false discovery rate <1% were considered significant. Trajectory lines were fit using locally weighted scatterplot smoothing (LOESS) regression to demonstrate differentiation trajectories.
Statistical assessment of cluster and sample associations
To determine whether there were statistically significant relationships between clusters and sample types for CD4+ Tconv, we developed a metric for cluster enrichment. This metric determines the ratio of observed versus expected cells within a cluster, using the frequency of cells from patient associated with each sample type. The expected frequency of cells in each cluster for each patient was inferred by dividing the total number of cells in each cluster by the total number of patients. The observed frequency was then divided by the expected frequency for each patient within each group. Analysis of variance (ANOVA) was then performed to determine if any group was statistically significantly different within a cluster. Finally, we performed a rank sum test between the observed versus expected frequency for HPV− and HPV+ CD4+ Tconv in cluster 1.
Assessment of receptor/ligand interactions
To evaluate putative interactions between cells, we developed the CellTalker algorithm. CellTalker uses a recently described list of receptors and ligands (including soluble ligands such as cytokines) (Ramilowski et al., 2015) to identify putative ligand/receptor interactions between cell types. Putative receptor/ligand interactions were assessed by first determining which receptors/ligands were expressed on each cell, using a minimum number of reads based on an expression count of 5 in either 1% of cells (for overall interactions) or 3% of cells (B cell and CD4+ Tconv specific interactions). Additionally, ligands and receptors were only included if they were expressed on either >5% of cells (for overall interactions) or >3% of cells (B cell and CD4+ Tconv specific interactions) from >25% of patients within a group (e.g. healthy donor PBMC or HPV+ TIL). After a list of ligands and receptors was identified as expressed with the above criteria, putative interaction pairs were identified by taking ligand x on cell population y and looking for expression of receptor z on populations within a given group of cells (e.g. healthy donor PBMC). Interactions were evaluated for all groups, and were displayed as circos plots (Zhang et al., 2013). Interactions were classified as either those that were shared with healthy donor PBMC (common), those that were distinct from healthy donor PBMC but present in more than one group, or those that were uniquely present only within one group. This procedure for calculating putative interactions is general to groups of cells expressions sets of ligands and receptors, and as such was extended to interactions between clusters of B cells and clusters of CD4+ Tconv.
High throughput analysis of immunofluorescence images
After images were captured using the Vectra imaging platform, images were spectrally deconvoluted into their component channels using inForm and Phenochart for downstream analysis in FIJI (Schindelin et al., 2012) and R. In FIJI, custom macro commands were written and implemented to facilitate standardized image processing. Briefly, color image processing was performed by removing putative spillover between adjacent channels and then standardizing the brightness and contrast for each channel across slides. Images were then convert to 32-bit stacks and merged into a composite image. For segmentation of B cells, CD4+ Tconv, CD4+ Treg, and CD8+ T cells, each independent channel was converted into an 8-bit binary image and segmented via watershed analysis. For myeloid cells, a Gaussian blur was used prior to converting the 8-bit image to binary. Cells were automatically counted from each channel using Analyze Particles in FIJI. Cells were classified as CD4+ Treg if they co-expressed CD4 and FOXP3, and were classified as CD4+ Tconv otherwise, and cells were classified as macrophages if the expressed CD68. In addition to the output of cell counts and composite images for each slide, the FIJI macro also yielded the locations of each cell in the x/y plane of the image. The cell counts and locations were then imported into R for downstream analysis.
We were motivated by a recently described analytic approach (Goltsev et al., 2018) to identify putative cell-cell proximity be identifying the neighbors of each given cell, and calculating the odds of a cell type being associated with a neighbor. To accomplish this, we imported the x/y positions of each cell from the FIJI macro output, and used the R package trimesh to determine the first-tier neighbors of each cell by Delaunay triangulation. The Delaunay triangluation was then used to determine the odds of interactions between given cell types based on immediate proximity (Goltsev et al., 2018). Briefly, the odds ratio of co-occurrence was calculated as the ratio between the frequency of co-occurrence with a given cell type divided by the frequency of co-occurrence with all cell types. The odds of co-occurrence was defined as the mean of the beta-distribution with alpha equal to the number of edges connecting the two given cell types and parameter beta as the total number of edges minus those connecting the two given cell types. The frequency of co-occurrence with all cell types was defined as the total number of connections to the first cell type times the total frequency of connections to the second cell type.
Relationship between outcomes and derived gene sets
To assess the clinical significance of expression of a given gene set, we utilized RSEM normalized log2 bulk mRNAseq expression data available from TCGA through the Firehose pipeline hosted by the Broad (Center, 2016). We also utilized clinical and outcomes data available through the recently published Pan-Cancer Clinical Data (Liu et al., 2018). From these resources, we filtered our analysis by patients that underwent testing for HPV status via p16 immunohistochemistry. We then scaled and centered the log2 bulk mRNAseq data for these patients, and used this dataset for gene set enrichment analysis.
To assess whether there was a relationship between expression of a T follicular helper related gene set and clinical outcomes in patients with HPV− and HPV+ disease, we first defined our TFH gene set based on the top 200 differentially upregulated genes between CD4+ Tconv cluster 1 and CD4+ Tconv cluster 7, which represent the two terminal-most differentiated states of CD4+ T cells. As a test statistic for enrichment in the bulk expression profile from each patient, we used the Kolmogorov-Smirnov (KS) test to compare genes in the gene set versus those not in the gene set. We note that we used the KS test here for gene set enrichment, and the correlation-adjusted Mann-Whitney test for gene set enrichment within individual lineages. We use the KS test here, as it is more appropriate for data with higher variance and more noise (i.e. the bulk mRNAseq data consisting of both immune and non-immune cells) since it requires expression of fewer genes to achieve a significant enrichment score (Subramanian et al., 2005). We then used the cutp function in the R package survMisc to identify outpoints for high and low expression of our TFH signature based on the KS statistic. For proportional hazards regression, we performed both monovariate and multivariate analysis based on progression free survival.
Quantification and statistical analysis
Statistical analysis
Specific statistical tests applied in this study included identification of cluster markers using a Wilcoxon rank sum test, gene set enrichment based using a competitive gene set enrichment algorithm described above and the Kolmogorov-Smirnov test for TCGA data, and likelihood ratio tests for pseudobulk analysis and for analysis of genes associated with diffusion components. We also analyzed mono- and multi-variate Cox proportional hazard regression models to relate expression profiles to outcomes from TCGA. Correlations between cell populations determined by flow cytometry versus single-cell RNAseq were assessed by Pearson’s correlation. In all appropriate instances, p-values were corrected for multiple comparisons using a false discovery rate with a threshold for significance of <1%.
Data and Software Availability
Data availability
Raw sequencing data are available through the NCBI Sequence Read Archive (BioProject ID 579178) and processed gene barcode matrices will be available through the Gene Expression Omnibus database (GSE139324).
Code availability
Code for all custom algorithms are publically available in GitHub repositories. DRAGON is available at https://github.com/arc85/dragonsc, SingleSeqGSet is available at https://github.com/arc85/singleseqgset, and CellTalker is available at https://github.com/arc85/celltalker.
Supplementary Material
Table S1. Clinical characteristics of study participants, related to Figure 1
Table S2. Overall differentially expressed genes by cluster and cell type, related to Figure 1
Table S6. Expressed ligands and receptors involved in cell-cell interactions by cell type, related to Figure 6
Table S7. Expressed ligands and receptors involved in B cell and CD4+ Tconv interactions, related to Figure 7
Acknowledgements
We thank Amy Cuda, Merida Serrano, Tina Harrison and Denise Kroll for clinical assistance and procurement of patient samples; Aditi Kulkarni, Subinoy Biswas, and Feng Shan for computational input; the Hillman Cancer Center Flow Cytometry Core (Bratislav Janjic and Ernest Meyer) for cell sorting; the Health Science Core Research Facilities Genomics Research Core (William Horne) for next-generation sequencing; the University of Pittsburgh Center for Research Computing for computational resources; the University of Colorado Denver Human Immune Monitoring Shared Resource (Kimberly Jordan and Angela Minic), the Immunologic Monitoring and Cellular Products Laboratory at Hillman Cancer Center (Jason Devlin), and the National Surgical Adjuvant Breast and Bowel Project (Marion Joy) for assistance with immunofluorescence imaging; and all members of the Vignali Lab for helpful discussions. This work was supported by the University of Pittsburgh Cancer Immunology Training Program (T32 CA082084 to A.R.C.), the Hillman Postdoctoral Fellowship for Innovative Cancer Research (Fellowship to A.R.C.), the Programm zur internen Forschungsfþrderung Essen (IFORES) (stipend to C.H.L.K.), the National Institutes of Health (P50 HNSCC SPORE CA097190 to D.A.A.V. & R.L.F.), and NCI Comprehensive Cancer Center Support CORE grant (CA047904 to D.A.A.V. & R.L.F.).
Footnotes
Publisher's Disclaimer: This is a PDF file of an unedited manuscript that has been accepted for publication. As a service to our customers we are providing this early version of the manuscript. The manuscript will undergo copyediting, typesetting, and review of the resulting proof before it is published in its final form. Please note that during the production process errors may be discovered which could affect the content, and all legal disclaimers that apply to the journal pertain.
Declaration of Interests
R.L.F. is a consultant for Aduro Biotech Inc, Bain Capital Life Sciences, Iovance Biotherapeutics Inc, Nanobiotix, Ono Pharmaceutical Co. Ltd, Torque Therapeutics Inc, and TTMS; is on the advisory board for Amgen, Astra-Zeneca/MedImmune, Bristol-Meyers Squibb, EMB Serono, GlaxoSmithKline, Lilly, MacroGenics, Merck, Numab Therapeutics AG, Pfizer, PPD, Regeneron Pharmaceuticals Inc, and Tesaro; receives clinical trial support from Astra-Zeneca/MedImmune, Bristol-Meyers Squibb, and Merck, and receives research funding from Astra-Zeneca/MedImmune, Bristol-Meyers Squibb, Tesaro, TTMS and VentiRx Pharmaceuticals. D.A.A.V. is a consultant for Astellas, Bristol-Meyers Squibb, Crescendo, MPM, Oncorus, Pieris, Innovent Bio, Torque Bio, Kleo Pharma, Viela Bio, Kronos Bio, and G1 Therapeutics; is on the advisory board for Tizona, Werewolf, and F-Star; receives research funding from Bristol-Meyers Squibb, Aestellas/Potenza, Tizona, and TTMS; receives royalties related to patents from Astellas, Tizona, and Bristol-Meyers Squibb; and holds stock in TTMS, Tizona, Oncorus and Werewolf. All other authors declare no competing interests.
REFERENCES
- Al-Shibli KI, Donnem T, Al-Saad S, Persson M, Bremnes RM, and Busund LT (2008). Prognostic effect of epithelial and stromal lymphocyte infiltration in non-small cell lung cancer. Clin Cancer Res 14, 5220–5227. [DOI] [PubMed] [Google Scholar]
- Ang KK, Harris J, Wheeler R, Weber R, Rosenthal DI, Nguyen-Tan PF, Westra WH, Chung CH, Jordan RC, Lu C, et al. (2010). Human papillomavirus and survival of patients with oropharyngeal cancer. N Engl J Med 363, 24–35. [DOI] [PMC free article] [PubMed] [Google Scholar]
- Angerer P, Haghverdi L, Buttner M, Theis FJ, Marr C, and Buettner F (2016). destiny: diffusion maps for large-scale single-cell data in R. Bioinformatics 32, 1241–1243. [DOI] [PubMed] [Google Scholar]
- Ansel KM, Harris RB, and Cyster JG (2002). CXCL13 is required for B1 cell homing, natural antibody production, and body cavity immunity. Immunity 16, 67–76. [DOI] [PubMed] [Google Scholar]
- Argiris A, Karamouzis MV, Raben D, and Ferris RL (2008). Head and neck cancer. Lancet 371, 1695–1709. [DOI] [PMC free article] [PubMed] [Google Scholar]
- Azizi E, Carr AJ, Plitas G, Cornish AE, Konopacki C, Prabhakaran S, Nainys J, Wu K, Kiseliovas V, Setty M, et al. (2018). Single-Cell Map of Diverse Immune Phenotypes in the Breast Tumor Microenvironment. Cell. [DOI] [PMC free article] [PubMed] [Google Scholar]
- Baglama J, and Reichel L (2006). Augmented Implicitly Restarted Lanczos Bidiagonalization Methods. Society for Industrial and Applied Mathematics 27, 19–42. [Google Scholar]
- Banerjee A, Gordon SM, Intlekofer AM, Paley MA, Mooney EC, Lindsten T, Wherry EJ, and Reiner SL (2010). Cutting edge: The transcription factor eomesodermin enables CD8+ T cells to compete for the memory cell niche. J Immunol 185, 4988–4992. [DOI] [PMC free article] [PubMed] [Google Scholar]
- Bourhis J, Overgaard J, Audry H, Ang KK, Saunders M, Bernier J, Horiot JC, Le Maitre A, Pajak TF, Poulsen MG, et al. (2006). Hyperfractionated or accelerated radiotherapy in head and neck cancer: a meta-analysis. Lancet 368, 843–854. [DOI] [PubMed] [Google Scholar]
- Brahmer JR, Tykodi SS, Chow LQ, Hwu WJ, Topalian SL, Hwu P, Drake CG, Camacho LH, Kauh J, Odunsi K, et al. (2012). Safety and activity of anti-PD-L1 antibody in patients with advanced cancer. N Engl J Med 366, 2455–2465. [DOI] [PMC free article] [PubMed] [Google Scholar]
- Brown LM, Check DP, and Devesa SS (2011). Oropharyngeal cancer incidence trends: diminishing racial disparities. Cancer Causes Control 22, 753–763. [DOI] [PubMed] [Google Scholar]
- Brown LM, Check DP, and Devesa SS (2012). Oral cavity and pharynx cancer incidence trends by subsite in the United States: changing gender patterns. J Oncol 2012, 649498. [DOI] [PMC free article] [PubMed] [Google Scholar]
- Bruno TC, Ebner PJ, Moore BL, Squalls OG, Waugh KA, Eruslanov EB, Singhal S, Mitchell JD, Franklin WA, Merrick DT, et al. (2017). Antigen-Presenting Intratumoral B Cells Affect CD4(+) TIL Phenotypes in Non-Small Cell Lung Cancer Patients. Cancer immunology research 5, 898–907. [DOI] [PMC free article] [PubMed] [Google Scholar]
- Buettner F, Natarajan KN, Casale FP, Proserpio V, Scialdone A, Theis FJ, Teichmann SA, Marioni JC, and Stegle O (2015). Computational analysis of cell-to-cell heterogeneity in single-cell RNA-sequencing data reveals hidden subpopulations of cells. Nat Biotechnol 33, 155–160. [DOI] [PubMed] [Google Scholar]
- Burtness B, Harrington KJ, Greil R, Soulieres D, Tahara M, de Castro G Jr., Psyrri A, Baste N, Neupane P, Bratland A, et al. (2019). Pembrolizumab alone or with chemotherapy versus cetuximab with chemotherapy for recurrent or metastatic squamous cell carcinoma of the head and neck (KEYNOTE-048): a randomised, open-label, phase 3 study. Lancet. [DOI] [PubMed] [Google Scholar]
- Butler A, Hoffman P, Smibert P, Papalexi E, and Satija R (2018). Integrating single-cell transcriptomic data across different conditions, technologies, and species. Nat Biotechnol 36, 411–420. [DOI] [PMC free article] [PubMed] [Google Scholar]
- Campbell JD, Yau C, Bowlby R, Liu Y, Brennan K, Fan H, Taylor AM, Wang C, Walter V, Akbani R, et al. (2018). Genomic, Pathway Network, and Immunologic Features Distinguishing Squamous Carcinomas. Cell reports 23, 194–212.e196. [DOI] [PMC free article] [PubMed] [Google Scholar]
- Carvalho AL, Nishimoto IN, Califano JA, and Kowalski LP (2005). Trends in incidence and prognosis for head and neck cancer in the United States: a site-specific analysis of the SEER database. Int J Cancer 114, 806–816. [DOI] [PubMed] [Google Scholar]
- Castellano G, Woltman AM, Schlagwein N, Xu W, Schena FP, Daha MR, and van Kooten C (2007). Immune modulation of human dendritic cells by complement. Eur J Immunol 37, 2803–2811. [DOI] [PubMed] [Google Scholar]
- Center, B.I.T.G.D.A. (2016). Analysis-ready standardized TCGA data from Broad GDAC Firehose 2016_01_28 run. Broad Institute of MIT and Harvard. [Google Scholar]
- Chang Q, Bournazou E, Sansone P, Berishaj M, Gao SP, Daly L, Wels J, Theilen T, Granitto S, Zhang X, et al. (2013). The IL-6/JAK/Stat3 feed-forward loop drives tumorigenesis and metastasis. Neoplasia (New York, NY) 15, 848–862. [DOI] [PMC free article] [PubMed] [Google Scholar]
- Colevas AD (2013). Population-based evaluation of incidence trends in oropharyngeal cancer focusing on socioeconomic status, sex, and race/ethnicity. Head Neck 36, 34–42. [DOI] [PubMed] [Google Scholar]
- Deaglio S, Dwyer KM, Gao W, Friedman D, Usheva A, Erat A, Chen JF, Enjyoji K, Linden J, Oukka M, et al. (2007). Adenosine generation catalyzed by CD39 and CD73 expressed on regulatory T cells mediates immune suppression. J Exp Med 204, 1257–1265. [DOI] [PMC free article] [PubMed] [Google Scholar]
- Dobin A, Davis CA, Schlesinger F, Drenkow J, Zaleski C, Jha S, Batut P, Chaisson M, and Gingeras TR (2013). STAR: ultrafast universal RNA-seq aligner. Bioinformatics 29, 15–21. [DOI] [PMC free article] [PubMed] [Google Scholar]
- Doedens AL, Phan AT, Stradner MH, Fujimoto JK, Nguyen JV, Yang E, Johnson RS, and Goldrath AW (2013). Hypoxia-inducible factors enhance the effector responses of CD8(+) T cells to persistent antigen. Nat Immunol 14, 1173–1182. [DOI] [PMC free article] [PubMed] [Google Scholar]
- Fakhry C, and D’Souza G (2013). Discussing the diagnosis of HPV-OSCC: common questions and answers. Oral Oncol 49, 863–871. [DOI] [PMC free article] [PubMed] [Google Scholar]
- Ferlay J, Soerjomataram I, Dikshit R, Eser S, Mathers C, Rebelo M, Parkin DM, Forman D, and Bray F (2015). Cancer incidence and mortality worldwide: sources, methods and major patterns in GLOBOCAN 2012. Int J Cancer 136, E359–386. [DOI] [PubMed] [Google Scholar]
- Ferris RL, Blumenschein G Jr., Fayette J, Guigay J, Colevas AD, Licitra L, Harrington K, Kasper S, Vokes EE, Even C, et al. (2016). Nivolumab for Recurrent Squamous-Cell Carcinoma of the Head and Neck. N Engl J Med 375, 1856–1867. [DOI] [PMC free article] [PubMed] [Google Scholar]
- Ferris RL, Blumenschein G Jr., Fayette J, Guigay J, Colevas AD, Licitra L, Harrington KJ, Kasper S, Vokes EE, Even C, et al. (2018). Nivolumab vs investigator's choice in recurrent or metastatic squamous cell carcinoma of the head and neck: 2-year long-term survival update of CheckMate 141 with analyses by tumor PD-L1 expression. Oral Oncol 81, 45–51. [DOI] [PMC free article] [PubMed] [Google Scholar]
- Finlay DK, Rosenzweig E, Sinclair LV, Feijoo-Carnero C, Hukelmann JL, Rolf J, Panteleyev AA, Okkenhaug K, and Cantrell DA (2012). PDK1 regulation of mTOR and hypoxia-inducible factor 1 integrate metabolism and migration of CD8+ T cells. J Exp Med 209, 2441–2453. [DOI] [PMC free article] [PubMed] [Google Scholar]
- Fortunato S, and Barthelemy M (2007). Resolution limit in community detection. Proc Natl Acad Sci U S A 104, 36–41. [DOI] [PMC free article] [PubMed] [Google Scholar]
- Garris CS, Arlauckas SP, Kohler RH, Trefny MP, Garren S, Piot C, Engblom C, Pfirschke C, Siwicki M, Gungabeesoon J, et al. (2018). Successful Anti-PD-1 Cancer Immunotherapy Requires T Cell-Dendritic Cell Crosstalk Involving the Cytokines IFN-gamma and IL-12. Immunity 49, 1148–1161.e1147. [DOI] [PMC free article] [PubMed] [Google Scholar]
- Goltsev Y, Samusik N, Kennedy-Darling J, Bhate S, Hale M, Vazquez G, Black S, and Nolan GP (2018). Deep Profiling of Mouse Splenic Architecture with CODEX Multiplexed Imaging. Cell 174, 968–981.e915. [DOI] [PMC free article] [PubMed] [Google Scholar]
- Guo B, Fu S, Zhang J, Liu B, and Li Z (2016). Targeting inflammasome/IL-1 pathways for cancer immunotherapy. Sci Rep 6, 36107. [DOI] [PMC free article] [PubMed] [Google Scholar]
- Guo X, Zhang Y, Zheng L, Zheng C, Song J, Zhang Q, Kang B, Liu Z, Jin L, Xing R, et al. (2018). Global characterization of T cells in non-small-cell lung cancer by single-cell sequencing. Nat Med 24, 978–985. [DOI] [PubMed] [Google Scholar]
- Haghverdi L, Buttner M, Wolf FA, Buettner F, and Theis FJ (2016). Diffusion pseudotime robustly reconstructs lineage branching. Nature methods 13, 845–848. [DOI] [PubMed] [Google Scholar]
- Hale JS, Youngblood B, Latner DR, Mohammed AU, Ye L, Akondy RS, Wu T, Iyer SS, and Ahmed R (2013). Distinct memory CD4+ T cells with commitment to T follicular helper- and T helper 1-cell lineages are generated after acute viral infection. Immunity 38, 805–817. [DOI] [PMC free article] [PubMed] [Google Scholar]
- Jayaram SC, Muzaffar SJ, Ahmed I, Dhanda J, Paleri V, and Mehanna H (2016). Efficacy, outcomes, and complication rates of different surgical and nonsurgical treatment modalities for recurrent/residual oropharyngeal carcinoma: A systematic review and meta-analysis. Head Neck 38, 1855–1861. [DOI] [PubMed] [Google Scholar]
- Kansy BA, Concha-Benavente F, Srivastava RM, Jie HB, Shayan G, Lei Y, Moskovitz J, Moy J, Li J, Brandau S, et al. (2017). PD-1 Status in CD8(+) T Cells Associates with Survival and Anti-PD-1 Therapeutic Outcomes in Head and Neck Cancer. Cancer Res 77, 6353–6364. [DOI] [PMC free article] [PubMed] [Google Scholar]
- Kobayashi K, Hisamatsu K, Suzui N, Hara A, Tomita H, and Miyazaki T (2018). A Review of HPV-Related Head and Neck Cancer. J Clin Med 7, 241. [DOI] [PMC free article] [PubMed] [Google Scholar]
- Koneva LA, Zhang Y, Virani S, Hall PB, McHugh JB, Chepeha DB, Wolf GT, Carey TE, Rozek LS, and Sartor MA (2018). HPV Integration in HNSCC Correlates with Survival Outcomes, Immune Response Signatures, and Candidate Drivers. Mol Cancer Res 16, 90–102. [DOI] [PMC free article] [PubMed] [Google Scholar]
- Kreimer AR, Clifford GM, Boyle P, and Franceschi S (2005). Human papillomavirus types in head and neck squamous cell carcinomas worldwide: a systematic review. Cancer Epidemiol Biomarkers Prev 14, 467–475. [DOI] [PubMed] [Google Scholar]
- Kuhn M, Wing J, Weston S, Williams A, Keefer C, Engelhardt A, Cooper T, Mayer Z, Kenkel B, Team., R.C., et al. (2019). caret: Classification and Regression Training. R package version 6.0–84. [Google Scholar]
- Kumar MP, Du J, Lagoudas G, Jiao Y, Sawyer A, Drummond DC, Lauffenburger DA, and Raue A (2018). Analysis of Single-Cell RNA-Seq Identifies Cell-Cell Communication Associated with Tumor Characteristics. Cell reports 25, 1458–1468.e1454. [DOI] [PMC free article] [PubMed] [Google Scholar]
- Lavin Y, Kobayashi S, Leader A, Amir ED, Elefant N, Bigenwald C, Remark R, Sweeney R, Becker CD, Levine JH, et al. (2017). Innate Immune Landscape in Early Lung Adenocarcinoma by Paired Single-Cell Analyses. Cell 169, 750–765.e717. [DOI] [PMC free article] [PubMed] [Google Scholar]
- LeHew CW, Weatherspoon DJ, Peterson CE, Goben A, Reitmajer K, Sroussi H, and Kaste LM (2017). The Health System and Policy Implications of Changing Epidemiology for Oral Cavity and Oropharyngeal Cancers in the United States From 1995 to 2016. Epidemiol Rev 39, 132–147. [DOI] [PubMed] [Google Scholar]
- Levine JH, Simonds EF, Bendall SC, Davis KL, Amir el AD, Tadmor MD, Litvin O, Fienberg HG, Jager A, Zunder ER, et al. (2015). Data-Driven Phenotypic Dissection of AML Reveals Progenitor-like Cells that Correlate with Prognosis. Cell 162, 184–197. [DOI] [PMC free article] [PubMed] [Google Scholar]
- Li A, Dubey S, Varney ML, Dave BJ, and Singh RK (2003). IL-8 directly enhanced endothelial cell survival, proliferation, and matrix metalloproteinases production and regulated angiogenesis. J Immunol 170, 3369–3376. [DOI] [PubMed] [Google Scholar]
- Li Q, Harden JL, Anderson CD, and Egilmez NK (2016). Tolerogenic Phenotype of IFN-gamma-Induced IDO+ Dendritic Cells Is Maintained via an Autocrine IDO-Kynurenine/AhR-IDO Loop. J Immunol 197, 962–970. [DOI] [PubMed] [Google Scholar]
- Linderman GC, Rachh M, Hoskins JG, Steinerberger S, and Kluger Y (2019). Fast interpolation-based t-SNE for improved visualization of single-cell RNA-seq data. Nature methods 16, 243–245. [DOI] [PMC free article] [PubMed] [Google Scholar]
- Linterman MA, and Hill DL (2016). Can follicular helper T cells be targeted to improve vaccine efficacy? F1000Research 5. [DOI] [PMC free article] [PubMed] [Google Scholar]
- Liu J, Lichtenberg T, Hoadley KA, Poisson LM, Lazar AJ, Cherniack AD, Kovatich AJ, Benz CC, Levine DA, Lee AV, et al. (2018). An Integrated TCGA Pan-Cancer Clinical Data Resource to Drive High-Quality Survival Outcome Analytics. Cell 173, 400–416.e411. [DOI] [PMC free article] [PubMed] [Google Scholar]
- Liu X, Yan X, Zhong B, Nurieva RI, Wang A, Wang X, Martin-Orozco N, Wang Y, Chang SH, Esplugues E, et al. (2012). Bcl6 expression specifies the T follicular helper cell program in vivo. The Journal of Experimental Medicine 209, 1841–1852. [DOI] [PMC free article] [PubMed] [Google Scholar]
- Maaten L.v.d. (2014). Accelerating t-SNE using Tree-Based Algorithms. Journal of Mechine Learning Research 15, 3221–3245. [Google Scholar]
- Maaten L.v.d., and Hinton G (2008). Visualizing Data using t-SNE. Journal of Machine Learning Research 9, 2579–2605. [Google Scholar]
- Mahnke YD, Brodie TM, Sallusto F, Roederer M, and Lugli E (2013). The who's who of T-cell differentiation: human memory T-cell subsets. Eur J Immunol 43, 2797–2809. [DOI] [PubMed] [Google Scholar]
- Milne K, Kobel M, Kalloger SE, Barnes RO, Gao D, Gilks CB, Watson PH, and Nelson BH (2009). Systematic analysis of immune infiltrates in high-grade serous ovarian cancer reveals CD20, FoxP3 and TIA-1 as positive prognostic factors. PLoS One 4, e6412. [DOI] [PMC free article] [PubMed] [Google Scholar]
- Nedergaard BS, Ladekarl M, Nyengaard JR, and Nielsen K (2008). A comparative study of the cellular immune response in patients with stage IB cervical squamous cell carcinoma. Low numbers of several immune cell subtypes are strongly associated with relapse of disease within 5 years. Gynecol Oncol 108, 106–111. [DOI] [PubMed] [Google Scholar]
- Overacre-Delgoffe AE, Chikina M, Dadey RE, Yano H, Brunazzi EA, Shayan G, Horne W, Moskovitz JM, Kolls JK, Sander C, et al. (2017). Interferon-gamma Drives Treg Fragility to Promote Anti-tumor Immunity. Cell 169, 1130–1141.e1111. [DOI] [PMC free article] [PubMed] [Google Scholar]
- Pak AS, Wright MA, Matthews JP, Collins SL, Petruzzelli GJ, and Young MR (1995). Mechanisms of immune suppression in patients with head and neck cancer: presence of CD34(+) cells which suppress immune functions within cancers that secrete granulocyte-macrophage colony-stimulating factor. Clin Cancer Res 1, 95–103. [PubMed] [Google Scholar]
- Pepper M, Pagan AJ, Igyarto BZ, Taylor JJ, and Jenkins MK (2011). Opposing signals from the Bcl6 transcription factor and the interleukin-2 receptor generate T helper 1 central and effector memory cells. Immunity 35, 583–595. [DOI] [PMC free article] [PubMed] [Google Scholar]
- Pignon JP, le Maitre A, Maillard E, and Bourhis J (2009). Meta-analysis of chemotherapy in head and neck cancer (MACH-NC): an update on 93 randomised trials and 17,346 patients. Radiother Oncol 92, 4–14. [DOI] [PubMed] [Google Scholar]
- Ramilowski JA, Goldberg T, Harshbarger J, Kloppmann E, Lizio M, Satagopam VP, Itoh M, Kawaji H, Carninci P, Rost B, et al. (2015). A draft network of ligand-receptor-mediated multicellular signalling in human. Nature communications 6, 7866. [DOI] [PMC free article] [PubMed] [Google Scholar]
- Rose K (1998). Deterministic annealing for clustering, compression, classification, regression, and related optimization problems. Proceedings of the IEEE 86, 2210–2239. [Google Scholar]
- Rose K, Gurewitz E, and Fox G (1990a). A deterministic annealing approach to clustering. Pattern Recognition Letters 11, 589–594. [Google Scholar]
- Rose K, Gurewitz E, and Fox GC (1990b). Statistical mechanics and phase transitions in clustering. Phys Rev Lett 65, 945–948. [DOI] [PubMed] [Google Scholar]
- Russell S, Angell T, Lechner M, Liebertz D, Correa A, Sinha U, Kokot N, and Epstein A (2013). Immune cell infiltration patterns and survival in head and neck squamous cell carcinoma. Head Neck Oncol 5, 24. [PMC free article] [PubMed] [Google Scholar]
- Sade-Feldman M, Yizhak K, Bjorgaard SL, Ray JP, de Boer CG, Jenkins RW, Lieb DJ, Chen JH, Frederick DT, Barzily-Rokni M, et al. (2018). Defining T Cell States Associated with Response to Checkpoint Immunotherapy in Melanoma. Cell 175, 998–1013.e1020. [DOI] [PMC free article] [PubMed] [Google Scholar]
- Sautes-Fridman C, Lawand M, Giraldo NA, Kaplon H, Germain C, Fridman WH, and Dieu-Nosjean MC (2016). Tertiary Lymphoid Structures in Cancers: Prognostic Value, Regulation, and Manipulation for Therapeutic Intervention. Front Immunol 7, 407. [DOI] [PMC free article] [PubMed] [Google Scholar]
- Schindelin J, Arganda-Carreras I, Frise E, Kaynig V, Longair M, Pietzsch T, Preibisch S, Rueden C, Saalfeld S, Schmid B, et al. (2012). Fiji: an open-source platform for biological-image analysis. Nature methods 9, 676–682. [DOI] [PMC free article] [PubMed] [Google Scholar]
- Seiwert TY, and Cohen EE (2005). State-of-the-art management of locally advanced head and neck cancer. Br J Cancer 92, 1341–1348. [DOI] [PMC free article] [PubMed] [Google Scholar]
- Shi JY, Gao Q, Wang ZC, Zhou J, Wang XY, Min ZH, Shi YH, Shi GM, Ding ZB, Ke AW, et al. (2013). Margin-infiltrating CD20(+) B cells display an atypical memory phenotype and correlate with favorable prognosis in hepatocellular carcinoma. Clin Cancer Res 19, 5994–6005. [DOI] [PubMed] [Google Scholar]
- Shimabukuro-Vornhagen A, Schlosser HA, Gryschok L, Malcher J, Wennhold K, Garcia-Marquez M, Herbold T, Neuhaus LS, Becker HJ, Fiedler A, et al. (2014). Characterization of tumor-associated B-cell subsets in patients with colorectal cancer. Oncotarget 5, 4651–4664. [DOI] [PMC free article] [PubMed] [Google Scholar]
- Son M, Santiago-Schwarz F, Al-Abed Y, and Diamond B (2012). C1q limits dendritic cell differentiation and activation by engaging LAIR-1. Proc Natl Acad Sci U S A 109, E3160–3167. [DOI] [PMC free article] [PubMed] [Google Scholar]
- Subramanian A, Tamayo P, Mootha VK, Mukherjee S, Ebert BL, Gillette MA, Paulovich A, Pomeroy SL, Golub TR, Lander ES, et al. (2005). Gene set enrichment analysis: a knowledge-based approach for interpreting genome-wide expression profiles. Proc Natl Acad Sci U S A 102, 15545–15550. [DOI] [PMC free article] [PubMed] [Google Scholar]
- Thorsson V, Gibbs DL, Brown SD, Wolf D, Bortone DS, Ou Yang TH, Porta-Pardo E, Gao GF, Plaisier CL, Eddy JA, et al. (2018). The Immune Landscape of Cancer. Immunity 48, 812–830.e814. [DOI] [PMC free article] [PubMed] [Google Scholar]
- Topalian SL, Hodi FS, Brahmer JR, Gettinger SN, Smith DC, McDermott DF, Powderly JD, Carvajal RD, Sosman JA, Atkins MB, et al. (2012). Safety, activity, and immune correlates of anti-PD-1 antibody in cancer. N Engl J Med 366, 2443–2454. [DOI] [PMC free article] [PubMed] [Google Scholar]
- Traag VA, Waltman L, and van Eck NJ (2019). From Louvain to Leiden: guaranteeing well-connected communities. Sci Rep 9, 5233. [DOI] [PMC free article] [PubMed] [Google Scholar]
- Vasanthakumar A, Liao Y, Teh P, Pascutti MF, Oja AE, Garnham AL, Gloury R, Tempany JC, Sidwell T, Cuadrado E, et al. (2017). The TNF Receptor Superfamily-NF-kappaB Axis Is Critical to Maintain Effector Regulatory T Cells in Lymphoid and Non-lymphoid Tissues. Cell reports 20, 2906–2920. [DOI] [PubMed] [Google Scholar]
- Vento-Tormo R, Efremova M, Botting RA, Turco MY, Vento-Tormo M, Meyer KB, Park JE, Stephenson E, Polanski K, Goncalves A, et al. (2018). Single-cell reconstruction of the early maternal-fetal interface in humans. Nature 563, 347–353. [DOI] [PMC free article] [PubMed] [Google Scholar]
- Vermorken JB, Mesia R, Rivera F, Remenar E, Kawecki A, Rottey S, Erfan J, Zabolotnyy D, Kienzer HR, Cupissol D, et al. (2008). Platinum-based chemotherapy plus cetuximab in head and neck cancer. N Engl J Med 359, 1116–1127. [DOI] [PubMed] [Google Scholar]
- Victora GD (2014). SnapShot: the germinal center reaction. Cell 159, 700–700.e701. [DOI] [PubMed] [Google Scholar]
- Weatherspoon DJ, Chattopadhyay A, Boroumand S, and Garcia I (2015). Oral cavity and oropharyngeal cancer incidence trends and disparities in the United States: 2000-2010. Cancer Epidemiol 39, 497–504. [DOI] [PMC free article] [PubMed] [Google Scholar]
- Weed DT, Vella JL, Reis IM, De la Fuente AC, Gomez C, Sargi Z, Nazarian R, Califano J, Borrello I, and Serafini P (2015). Tadalafil reduces myeloid-derived suppressor cells and regulatory T cells and promotes tumor immunity in patients with head and neck squamous cell carcinoma. Clin Cancer Res 21, 39–48. [DOI] [PMC free article] [PubMed] [Google Scholar]
- Wirsing AM, Rikardsen OG, Steigen SE, Uhlin-Hansen L, and Hadler-Olsen E (2014). Characterisation and prognostic value of tertiary lymphoid structures in oral squamous cell carcinoma. BMC Clin Pathol 14, 38. [DOI] [PMC free article] [PubMed] [Google Scholar]
- Wolchok JD, Chiarion-Sileni V, Gonzalez R, Rutkowski P, Grob JJ, Cowey CL, Lao CD, Wagstaff J, Schadendorf D, Ferrucci PF, et al. (2017). Overall Survival with Combined Nivolumab and Ipilimumab in Advanced Melanoma. N Engl J Med. [DOI] [PMC free article] [PubMed]
- Woo JR, Liss MA, Muldong MT, Palazzi K, Strasner A, Ammirante M, Varki N, Shabaik A, Howell S, Kane CJ, et al. (2014). Tumor infiltrating B-cells are increased in prostate cancer tissue. J Transl Med 12, 30. [DOI] [PMC free article] [PubMed] [Google Scholar]
- Wood O, Woo J, Seumois G, Savelyeva N, McCann KJ, Singh D, Jones T, Peel L, Breen MS, Ward M, et al. (2016). Gene expression analysis of TIL rich HPV-driven head and neck tumors reveals a distinct B-cell signature when compared to HPV independent tumors. Oncotarget 7, 56781–56797. [DOI] [PMC free article] [PubMed] [Google Scholar]
- Wu D, and Smyth GK (2012). Camera: a competitive gene set test accounting for inter-gene correlation. Nucleic Acids Res 40, e133. [DOI] [PMC free article] [PubMed] [Google Scholar]
- Xu C, and Su Z (2015). Identification of cell types from single-cell transcriptomes using a novel clustering method. Bioinformatics 31, 1974–1980. [DOI] [PMC free article] [PubMed] [Google Scholar]
- Yang L, and Zhang Y (2017). Tumor-associated macrophages: from basic research to clinical application. J Hematol Oncol 10, 58. [DOI] [PMC free article] [PubMed] [Google Scholar]
- Zappia L, Phipson B, and Oshlack A (2017). Splatter: simulation of single-cell RNA sequencing data. Genome Biol 18, 174. [DOI] [PMC free article] [PubMed] [Google Scholar]
- Zhang H, Meltzer P, and Davis S (2013). RCircos: an R package for Circos 2D track plots. BMC Bioinformatics 14, 244. [DOI] [PMC free article] [PubMed] [Google Scholar]
- Zheng C, Zheng L, Yoo J-K, Guo H, Zhang Y, Guo X, Kang B, Hu R, Huang JY, Zhang Q, et al. (2017). Landscape of Infiltrating T Cells in Liver Cancer Revealed by Single-Cell Sequencing. Cell 169, 1342–1356.e1316. [DOI] [PubMed] [Google Scholar]
- Zheng GX, Terry JM, Belgrader P, Ryvkin P, Bent ZW, Wilson R, Ziraldo SB, Wheeler TD, McDermott GP, Zhu J, et al. (2017). Massively parallel digital transcriptional profiling of single cells. Nature communications 8, 14049. [DOI] [PMC free article] [PubMed] [Google Scholar]
Associated Data
This section collects any data citations, data availability statements, or supplementary materials included in this article.
Supplementary Materials
Table S1. Clinical characteristics of study participants, related to Figure 1
Table S2. Overall differentially expressed genes by cluster and cell type, related to Figure 1
Table S6. Expressed ligands and receptors involved in cell-cell interactions by cell type, related to Figure 6
Table S7. Expressed ligands and receptors involved in B cell and CD4+ Tconv interactions, related to Figure 7
Data Availability Statement
Data availability
Raw sequencing data are available through the NCBI Sequence Read Archive (BioProject ID 579178) and processed gene barcode matrices will be available through the Gene Expression Omnibus database (GSE139324).
Code availability
Code for all custom algorithms are publically available in GitHub repositories. DRAGON is available at https://github.com/arc85/dragonsc, SingleSeqGSet is available at https://github.com/arc85/singleseqgset, and CellTalker is available at https://github.com/arc85/celltalker.
Raw sequencing data are available through the NCBI Sequence Read Archive (BioProject ID 579178) and processed gene barcode matrices will be available through the Gene Expression Omnibus database (GSE139324).