

Abstract
Background:
The ideal participants for Alzheimer’s disease (AD) clinical trials would show cognitive decline in the absence of treatment (i.e., placebo arm) and also would be responsive to the therapeutic intervention being studied (i.e., drug arm). One strategy to boost the power of trials is to enroll individuals who are more likely to progress targeted using data-driven predictive models.
Objective:
To investigate if machine learning (ML) models can effectively predict clinical disease progression (cognitive decline) in mild-to-moderate AD patients during the timeframe of a phase III clinical trial.
Methods:
Data from 202 participants with a diagnosis of AD at baseline from the Alzheimer’s Disease Neuroimaging Initiative (ADNI) was used to train ML classifiers that can differentiate between individuals who had declining cognitive function (DC) and individuals with stable cognitive function (SC). DC was defined as any downward change in the Alzheimer’s Disease Assessment Scale cognitive subscale (ADAS-cog) score over 12 months of follow-up. SC was defined by the absence of decline in ADAS-cog. Trained models were applied to data from 77 participants from the placebo arm of the phase III trial of Semagacestat (LFAN study) to identify subgroups of SC versus DC.
Results:
Only 74.8% of ADNI participants and 63.6% of LFAN participants had cognitive decline after one year of follow up. K-nearest neighbors (kNN) classifier had an accuracy of 68.3%, sensitivity of 80.1%, and specificity of 33.3% for identifying decliners in ADNI (training sample). In LFAN (validation sample), the model showed an overall accuracy of 61.3%, sensitivity of 65.5%, and specificity of 47.0% in identifying decliners at the 12 months of follow-up. The model had a positive predictive value of 80.8%, which was 17.2% more than the base prevalence of decliners.
Conclusions:
Machine learning predictive models can be effectively used to boost the power of clinical trials by reducing the sample size.
Keywords: Alzheimer’s disease, clinical trial, cognitive decline, machine learning, predictive analytics
INTRODUCTION
Alzheimer’s disease (AD) is the most common cause of dementia accounting for 60–80% of the cases [1]. AD is age related and with the aging of the world’s population it is becoming markedly more common [2]. Considering the increasing costs and burden of AD on the healthcare and society, disease-modifying therapies (DMTs) that will prevent or delay the onset or slow the progression of AD are urgently needed. However, since the approval of memantine in 2003, no new molecular entity for the prevention or treatment of AD have been approved [3]. This failure has occurred despite major advances in the understanding of the biology of AD and substantial investment by the NIH and the pharmaceutical industry to develop drugs for well-established and novel targets [4–6]. Failure may arise from a variety of factors including inappropriate biological targets, biological heterogeneity, late intervention, or poor selection of participants.
In AD trials, active treatment is intended to slow the rate of cognitive decline. Enrollment of individuals who will not show cognitive decline reduces the chance of detecting therapeutic effects of a drug [7]. The most common method used to select homogenous patients who are more likely to decline during a trial is by using specific inclusion and exclusion criteria. Until late 2000 s, most trials used simple enrollment criteria [8] based on demographics (e.g., age above 65), clinical history, and baseline cognitive function (e.g., mild or moderate AD) [9, 10]. More recently these criteria became stricter and in addition to previous criteria, patients need to meet certain biomarker-based criteria such as amyloid positivity on positron emission tomography (PET) scans or have evidence of neurodegeneration (e.g., hippocampal atrophy) to pass the screening step [11, 12]. While these measures can decrease heterogeneity of the enrolled patients and increase power of trial to detect the therapeutic effect, they are also associated with some tradeoff in increased trial costs, burden, and consequences. Furthermore, even with implementation of strict inclusion or exclusion criteria, a substantial number of patients fail to show any signs of cognitive decline during the follow-up [7].
One strategy to overcome this problem, and simultaneously boosting the power of trials, is to only enroll individuals likely to progress based on data-driven predictive models. Quantitative risk prediction for AD using structured data sources and classical statistical methods have been available for many years. However, predictive models have not been used in design of AD clinical trials. Machine learning (ML) techniques, which are specifically designed for the purpose of prediction, can provide incremental improvement in predictive performance using complex and high-dimensional data [13, 14]. Considering the high performance of such models, they have huge potential for practical use in “real-world” research and clinical practice. Showing effectiveness of predictive models in data from clinical trials is one of the most first steps toward implementing such methods in practice.
In this study, we aimed to investigate if ML models can be used to identify individuals who will show cognitive decline during the timeframe of a clinical trial. For this purpose, we used baseline data from the Alzheimer’s Disease Neuroimaging Initiative (ADNI), a longitudinal cohort of aging and dementia, to train ML models that can predict rate of cognitive decline in individuals with AD. Subsequently, the trained ML models were applied to baseline data from the placebo arm of Semagacestat trial, a phase III randomized clinical trial, to predict which of the individuals are more likely to have cognitive decline during follow-up. While these two datasets have substantial differences, they are both multicenter studies, have longitudinal data on patients with diagnosis of AD at enrollment, have collected imaging data, and have similar processes features (e.g., volumetric MRIs). Furthermore, showing high performance of a model developed using data from a cohort in predicting cognitive trajectory in a clinical trial’s data, would be a testament for effectiveness of such models.
METHODS
Study design and participants
Two data-sets were used for this study: I) Data used in the preparation of this article were obtained from the Alzheimer’s Disease Neuroimaging Initiative (ADNI) database (http://adni.loni.usc.edu). The ADNI was launched in 2003 as a public-private partnership, led by Principal Investigator Michael W. Weiner, MD. The primary goal of ADNI has been to test whether serial magnetic resonance imaging (MRI), PET, other biological markers, and clinical and neuropsychological assessment can be combined to measure the progression of mild cognitive impairment and early AD. The data used for our analysis were downloaded from the ADNI database in March 2019 after obtaining permission from the investigative team. The individuals included in the current study were initially recruited as part of ADNI-1, ADNI-GO, and ADNI-2 between 2005 and 2013. ADNI study was approved by the Institutional Review Boards (IRB) of all participating institutions. Informed written consent was obtained from all participants at each site. Details of the ADNI cohort and study methods are describes fully at (http://www.adni.loni.usc.edu); II) Semagacestat trial (H6L-MC-LFAN study), which is a clinical trial conducted by Eli-Lilly between December 2009 and April 2011 to evaluate the efficacy of Semagacestat, a small-molecule γ-secretase inhibitor, for treatment of AD trial. The trial was terminated before completion on the basis of a recommendation by the data and safety monitoring board and the results showed that as compared with placebo, semagacestat did not improve cognitive status, and patients receiving the higher dose had significant worsening of functional ability [15]. The research protocol was approved by the institutional review board at each institution where the trial was conducted, and all participants provided written informed consent. Other details of LFAN study, including recruitment and methods are explained previously [15].
ADNI sample included participants with mild AD and LFAN participants included participants with mild-to-moderate AD. For both studies, participants had to satisfy the criteria of the National Institute of Neurological and Communicative Disorders and Stroke–Alzheimer’s Disease and Related Disorders Association (NINCDS-ADRDA) criteria for probable AD [9], clinical dementia rating (CDR) of 0.5 or 1 [16], and Mini–Mental State Examination (MMSE) scores of 20–26 (for ADNI) or 16 to 26 (for LFAN), with higher scores indicating better cognitive function [17].
Inclusion criteria
Eligible participants for current study were all of the ADNI and LFAN participants who had a diagnosis of mild-to-moderate AD at baseline, had baseline MRI, and at least 1 year of longitudinal follow-up. A total of 202 participants from the ADNI study and 77 participants from the LFAN study met the criteria for inclusion in our study.
Neuropsychological data and APOE gene status
The following neuropsychological (NP) tests were available for both studies and used in our models:
Mini-Mental State Examination (MMSE) [17]:
A brief screening instrument for cognitive dysfunction with raw scores that range from 0 to 30, where lower scores indicate greater cognitive dysfunction.
Alzheimer’s Disease Assessment Scale cognitive subscale (ADAS-cog) [18]:
The ADAS-Cog was developed as an outcome measure for dementia interventions; its primary purpose was to be an index of global cognition in response to antidementia therapies. ADAS-cog raw scores range from 0 to 70, where higher scores indicate greater cognitive dysfunction.
Apolipoprotein E (APOE) ε4 allele frequency was available for all participants included in this study. ApoE4 status was defined as ApoE4 negative (–) if they carried no ApoE4 allele or ApoE4 positive (+) if they carried at least one ApoE4 allele.
For more information on these measures and methods of assessment, please visit ADNI website at http://www.adni.loni.usc.edu.
MRI measures
MRIs were collected using a unified protocol for each study and preprocessing for measurement of MRI volumetrics were completed using methods previously describes in detail (For more information for ADNI protocols, see http://www.adni.loni.usc.edu and for LFAN, see Doody et al. [15]). MRI volumetrics available for participants of both studies included left hippocampal volume, right hippocampal volume, ventricular volume (sum of lateral and third ventricles), and total brain volume. Considering that MRI analysis methods were different between studies (ADNI and LFAN) and to harmonize data-sets, standardized scores (Z-score = (X−μ)/σ; where X = score, μ = mean, and σ = standard deviation) for volumetric measures were computed separately for each sample and used for further analysis in this study. The MRI measures had a normal distribution in our sample and therefore converting measures using the standard score was deemed appropriate for our purpose.
Data analysis
Selection of feature-set
A total of 11 features (measures) were selected for inclusion in the ML models:
Demographics: age, sex, and education.
Genomics: ApoE4 status
Cognitive scores: MMSE, ADAS-cog
Clinical information: Geriatric depression scale (GDS) [19]
MRI volumetrics: left hippocampal volume, right Hippocampal volume, Ventricular volume (sum of lateral and third ventricles), and total brain volume.
Selection of features was based on availability of feature in both ADNI and LFAN data-sets. Considering relatively small size of this feature-set, we did not use any feature selection algorithm and all the available features were included in the models. Considering that features used in current study had considerably different ranges, in addition to MRI measures, all other continuous measures (age, education, MMSE, ADAS-cog, GDS) were normalized separately for each dataset, and Z-values were used in the models. Data normalization is considered to be essential for improving performance of ML models[20].
Predictive models
We used two ML models of decision trees (DTs)[11] and K-nearest neighbor (kNN) [21], which are proven to work well with small datasets and small feature-sets, for classification:
DTs are powerful classifiers that sequentially dichotomize the feature space into regions associated with different classes. As such, they are capable of learning arbitrarily complex Boolean functions that map the features/predictors to class labels [11]. While they are widely used due to their ease of training based on labeled data, and robustness to missing features, they are known to be unstable due to their hierarchical structure: an incorrect decision at a high node in the tree would propagate down the nodes and results in misclassification (for details, see [12]). We used a fine DT (f-DT) model in the current study.
- kNNs are among the simplest, yet effective machine learning methods that use the idea of polling among the labels of the training examples closest to a new sample, and assigning the majority vote as its predicted label. To this end, for a positive integer K, the Euclidean distance between the new sample and the elements of the training set are computer and K training examples with the smallest distance are chosen to poll from (for details, see [21]). In brief, the Euclidean distance is specified by the following formula, where p is the new sample to be labeled and q is any of the examples in the training set, each having n features. The term pi refers to the value of the ith feature of example p, while qi refers to the value of the ith feature of example q, for i = 1,2, …, n:
The value of K in kNN was determined by using different K values in the models, starting from one to the square root of the size of the training set (approximately 3 in our analysis). The K-value of 1 showed the best classification performance in the training dataset, therefore results presented in this study are based on that.
Five-fold cross-validation was used for testing validity of all ML models. Analysis and computation of machine learning models were conducted using MATLAB ©(version 2018b).
Finally, for the purpose of a head-to-head comparison between conventional statistical methods (also known as an old machine learning approach) and newer ML models, a classical logistic regression model was applied to the same feature-set to classify participants.
Analytical approach
Study design and general analytical approach is summarized in Fig. 1. We used baseline data from the ADNI participants to train ML models. Based on the longitudinal data at 12-month follow-up, ADNI participants were divided into two groups: 1) Stable cognition (SC), who had either no change in cognitive function or showed improvement in cognitive function based on ADAS-cog scores (i.e., ADAS-cog12month – ADAS-cogbaseline ≥0); and 2) Declining cognition (DC), who showed some decline in cognitive function at 12 months follow up based on ADAS-cog scores (i.e., ADAS-cog12month – ADAS-cogbaseline <0). The model with better classification performance was applied to the baseline data from LFAN study to predict cognitive trajectory (remaining stable or declining).
Fig. 1.
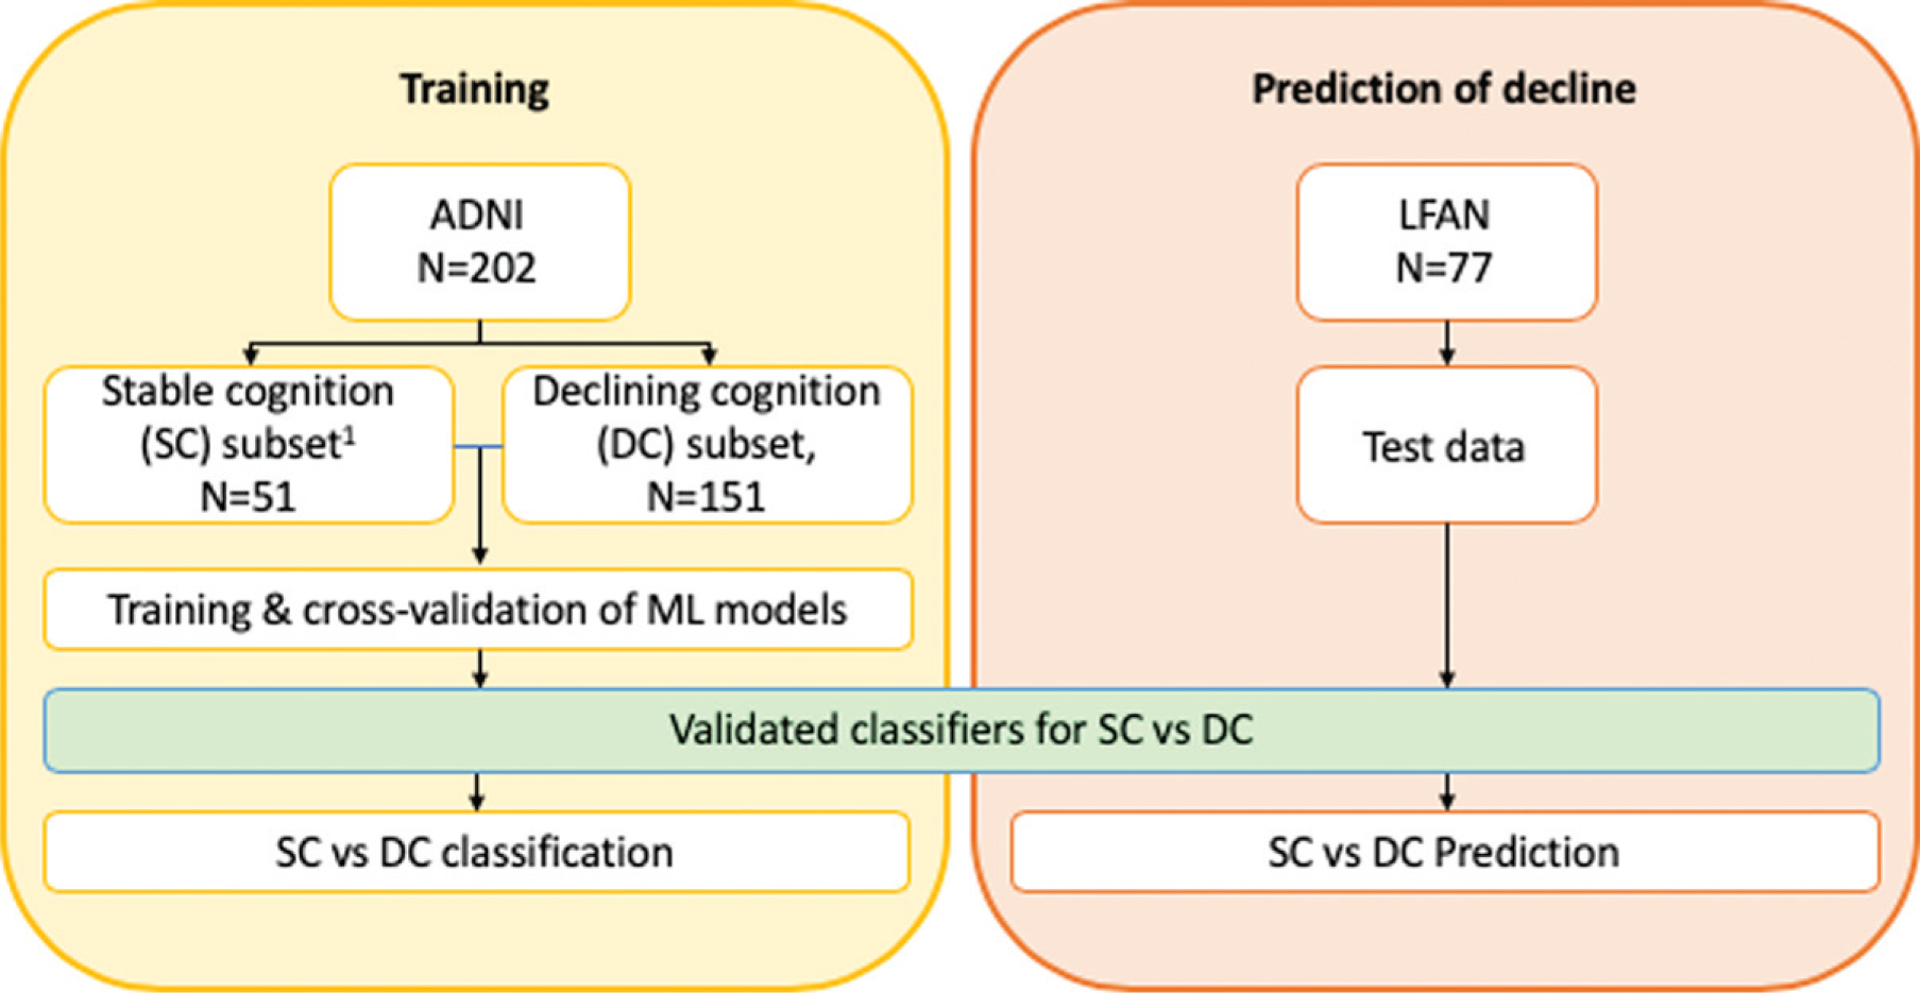
Study design diagram and schematic illustration of training models and prediction of cognitive decline. Data from ADNI were used for training the models. Participants were dichotomized to two groups based on the longitudinal change in ADAS-cog score at 12 months: stable cognition (SC) and declining cognition (DC). Models were trained to classify participants of training data-set (Yellow block). Subsequently, participants from LFAN study were introduced to the newly developed model to predict if they will have decline in cognition or will remain cognitively stable in longitudinal follow-up (Orange block).
The results from ML models were compared with actual longitudinal data at 12 months and 23 months of follow-up. The overall performance of each model was calculated based on the percentage of correct classification (accuracy), sensitivity, specificity, positive predictive value (PPV), and negative predictive value (NPV).
McNemar test was to select the most accurate ML model, which was trained using ADNI data. Based on the results of this test the best model was selected for prediction of outcomes in the validation sample (LFAN).
RESULTS
Demographics and baseline characteristics
Table 1 summarizes ADNI study participants’ demographics and clinical characteristics. ADNI participants had an average age of 74.7 years (SD = 7.7) and were 44.6% men. At 12 months follow up, 51(25.2%) of ADNI participants had no decline in cognitive function, while 151 (74.8) participants showed cognitive decline.
Table 1.
Baseline characteristics of ADNI study
| ADNI sample | Total Sample | Remained cognitively stable or improved at 12 months follow-up1 | Cognitively declined at 12 months follow-up1 |
|---|---|---|---|
| Sample size, N (%) | 202 | 51 (25.2) | 151 (74.8) |
| Sex, Men, % | 44.6 | 39.2 | 46.4 |
| APOE4 carrier, % | 70.3 | 60.8 | 73.5 |
| Age2 | 74.7 (7.7) | 74.6 (7.6) | 74.8 (7.8) |
| MMSE at Baseline | 23.2 (2.0) | 23.7 (1.7) | 23.1 (2.0) |
| ADAS-cog at baseline | 19.2 (6.7) | 18.9 (6.9) | 19.3 (6.6) |
| ADAS-cog at 12m follow-up | 23.7 (9.3) | 16.7 (6.6)* | 26.1 (8.9) |
| GDS | 1.6 (1.4) | 1.6(1.1) | 1.6 (1.5) |
| Total brain volume, cm3 | 972 (120) | 991 (135) | 966 (115) |
Based on change in ADAS-cog score.
Numbers represent mean (standard deviation) unless otherwise stated.
indicates significant differences between subgroups (p < 0.05), using t-test for continuous variables, and Chi-square test for categorical variables. MMSE, Mini–Mental State Examination; ADAS-cog, Alzheimer’s Disease Assessment Scale cognitive subscale; GDS, Geriatric Depression Scale.
Table 2 summarizes LFAN study participants’ demographics and clinical characteristics. LFAN participants had an average age of 74.2 years (SD = 8.1), and were 45.5% male. At 12 months follow up, 28 (36.4%) of LFAN participants had no decline in cognitive function, while 49 (63.6%) participants showed cognitive decline. A total of 41 were followed for 23 months in this study, of whom 15(36.6%) remained cognitively stable and 26 (63.4%) cognitively declined.
Table 2.
Baseline characteristics of LFAN study
| LFAN study | Total Sample | Remained cognitively stable or improved at 12 months follow-up1 | Cognitively declined at 12 months follow-up1 | Remained cognitively stable or improved at 23 months follow-up1 | Cognitively declined at 23 months follow-up1 |
|---|---|---|---|---|---|
| Sample size, N (%) | 77 (100) | 28 (36.4) | 49 (63.6) | 15 (36.6)3 | 26 (63.4)3 |
| Sex, Men, % | 45.5 | 57.1 | 38.8 | 40.0 | 46.2 |
| AP0E4 carrier, % | 56.5 | 43.5 | 63.0 | 61.5 | 56.5 |
| Age2 | 74.2 (8.1) | 75.0 (8.1) | 73.7 (7.9) | 73.8 (8.1) | 74.4 (8.5) |
| MMSE at Baseline | 22.2 (3.5) | 23.4 (3.2)* | 21.6 (3.5) | 23.9 (3.7) | 22.0 (3.4) |
| ADAS-cog at baseline | 18.7 (7.8) | 16.4 (7.7)* | 20.0 (7.6) | 16.8 (7.2) | 20.4 (8.5) |
| ADAS-cog at 12m follow-up | 21.9 (11.9) | 14.0 (7.5)* | 26.5(11.6) | 16.9(7.3)* | 25.5(13.5) |
| ADAS-cog at 23m follow-up | 23.8 (14.5) | 17.3 (12.1)* | 27.5 (14.5) | 14.0 (7.7)* | 29.3 (14.5) |
| GDS | 1.6 (1.6) | 1.3 (1.0) | 1.9 (1.8) | 1.5 (1.5) | 2.0 (1.7) |
| Total brain volume, cm3 | 1032 (104) | 1044 (108) | 1020 (98) | 1028 (95) | 1003 (74) |
Based on change in ADAS-cog score.
Numbers represent mean (standard deviation) unless otherwise stated. 3Data at 23m was available only for a total of 41 participants.
indicates significant differences between subgroups (p < 0.05), using t-test for continuous variables, and Chi-square test for categorical variables. MMSE, Mini–Mental State Examination; ADAS-cog, Alzheimer’s Disease Assessment Scale cognitive subscale; GDS, Geriatric Depression Scale.
Performance of predictive models in classification of SC versus DC in ADNI
Data from ADNI was used to train the predictive models to classify participants to SC versus DC subgroups. Logistic Regression model failed to classify participants (classified all participants as DC), and therefore was dropped from subsequent analysis. kNN model had an overall accuracy of 68.3%, while accuracy of DT model was 64.9%. Sensitivity, specificity, PPV and NPV of ML models are summarized in Table 3.
Table 3.
Performance of machine learning models in classifying participants with stable cognition (SC) from participants with declining cognition (DC) in ADNI sample
| Model | Sensitivity, % (CI) | Specificity, % (CI) | PPV, % (CI) | NPV, % (CI) | Accuracy, % (CI) |
|---|---|---|---|---|---|
| Decision trees (DT) | 79.5 (72.1–85.6) | 21.5 (11.3–35.3) | 75.0 (71.8–78.0) | 26.2 (16.1–39.5) | 64.9 (57.8–71.4) |
| k-Nearest | 80.1 | 33.3 | 78.0 | 36.2 | 68.3 |
| Neighborhood (kNN) | (72.8–86.1) | (20.8–47.9) | (74.3–81.4) | (25.2–48.3) | (61.4–74.7) |
PPV, positive predictive value; NPV, negative predictive value.
KNN model outperformed DT model in all measures of performance (sensitivity, specificity, PPV, and NPV). In addition, McNemar test confirmed that kNN model have a better performance in comparison with DTs (p < 0.001). Therefore, the trained kNN model was selected for predicting outcomes in LFAN study.
Performance of predictive models in LFAN
Trained models were applied to LFAN data, to predict if each participant is more like the SC group (i.e., their cognition is predicted to remain stable) or more like the DC group (i.e., their cognition is predicted to decline). Results of this prediction by ML model was compared with actual data from 12 months and 23 months of longitudinal follow-up (Table 3). The model showed an overall accuracy of 61.3%, sensitivity of 65.5%, and specificity of 47.0% in identifying decliners at the 12 months of follow-up. Models performance at 23 months of follow-up improved, with overall accuracy of 65.8%, sensitivity of 67.6%, and specificity of 65.8% in identifying decliners.
DISCUSSION
In this study we showed that using baseline information from a cohort of aging and AD (ADNI), ML predictive models can effectively identify individuals who are more likely to show cognitive decline over the follow up time in an independent sample from a phase III clinical trial of AD (LFAN). We showed that positive predictive value of the model is 80.8% at 12 months and 88.5% at 23 months, which is 17.2% and 25.1% higher than the observed base-rate of cognitive decline in the same sample (63.6%).
Many studies have previously shown that different measures such as neuropsychological tests, genomic risk scores, MRI or PET measures, or other cerebrospinal fluid (CSF) and blood-based biomarkers can predict cognitive trajectories in older adults in different stages of AD [8, 14, 22–25]. Most of these studies use longitudinal data from prospective cohorts of aging and dementia, which have the advantage information collected over extended follow-up periods. However, due to the costs, burden, and regulations, the first assessment of treatment efficacy in clinical trials is scheduled 3 to 24 months after initiation of the trial and it is expected to conclude the trial within a timeframe of 18 months to 5 years. Our results indicated that predictive models can provide approximately 17% and 25% improvement in prediction of cognitive decline at 12 months and 24 months follow-up, respectively. This could boost the power of trial by inclusion of individuals who are more likely to decline.
The idea of targeting a subgroup for analysis of treatment effects is not new [26]. In fact, recently many drug trials for prodromal AD or mild-AD have been recruiting subjects, with an inclusion criterion based on amyloid PET positivity [27] or CSF amyloid and tau [28]. We extend this approach to the selection of participants based on a machine learning classifier that combines numerous clinical measures and biomarkers. The goal is to enroll only patients likely to decline and exclude patients likely to have stable cognition. ML models do not solely rely on the absolute value of the features and account for pattern on the relationship between the features. Therefore, ML models provide a better alternative to conventional statistical methods (i.e., using cut offs or index scores) for predicting clinical outcomes [29]. A major challenge to this approach is that the statistical power must be traded off against the logistical complexity and cost of collecting and analyzing multiple biomarker assessments). This study showed that even by using a small feature-set consisted of demographics information, ApoE4, and a few neuropsychological and MRI measures, ML learning models are strong tools for prediction of clinical disease progression.
A limitation of our study is the small sample size. This is in part due to using data from an older clinical trial, in which only a small subsample of study had MRI measures. Due to the small size of LFAN study, we were not able to use the same sample for both training and validation of models and therefore we had to rely on the ADNI sample for training the ML models. That poses another limitation to this work: ADNI and LFAN studies are substantially different in design, recruitment, participant characteristics, and preprocessing of data. Furthermore, the features available in LFAN study to include in ML models were relatively small, which limited our ability to use feature engineering or more complex ML models. Training models using data from participants with longer follow-up periods (e.g., 24 months) might lead to improved performance of models. However, restricting inclusion criteria to those who had at least 24 months of follow-up (or longer) would substantially decrease the number of eligible participants for this study, which negatively impacts performance of models. Another limitation of this study is using the change in a single cognitive test (ADAS-cog) to classify participants into cognitively stable or declining groups. However, it is well known that most cognitive tests, including ADAS-cog, are prone to measurement errors and might not provide an accurate assessment for cognitive status [30], which in turn might lead to inaccurate classification scores at two different time-points as the LFAN study was designed and conducted approximately 10 years ago with specific primary and secondary outcomes, which were appropriate for that time. Therefore, many AD-related clinical and cognitive measures (i.e., cognitive domains other than memory) or biomarkers (amyloid and tau imaging, or CSF biomarkers) were not collected at all or only collected for a very small proportion of sample, making it implausible to assess the effect of these important measures in our models. Logistic regressions failed in classification of participants in our study, which might be due to small sample size, noisy data, or small differences at decision boundary (small sample). This shows the importance of features availability and sample size on performance of predictive models. Of note, in this study we trained our models to classify those who had stable cognition versus those who had any cognitive decline, which is a conservative approach. It is expected that models achieve even higher performance if the goal was to identify individuals with more rapid cognitive decline.
Despite all limitations, it is encouraging that this study indicates that ML models trained in cohorts like ADNI (and potentially in populations-based studies) can be used to boost the power of clinical trials. Future studies should be conducted to validate our findings in more recent clinical trials with larger sample size and longer duration of follow-up, which also have additional modalities of data such as amyloid and tau imaging, and blood and CSF biomarkers for prediction of clinical disease progression. Another future direction would be to employ advanced feature selection methods [31] and more complex machine learning algorithms (e.g., Ensemble methods or superLearner) to improve classification and prediction performance.
Table 4.
Performance of k-Nearest Neighborhood (kNN) models in prediction of cognitive change (stable versus decliner) in the LFAN sample
| Follow up duration | Sensitivity (%) | Specificity (%) | PPV (%) | NPV (%) | Accuracy (%) |
|---|---|---|---|---|---|
| 12 months | 65.5 (51.8–77.7) | 47.0 (23.0–72.2) | 80.8 (72.2–87.3) | 28.6 (17.8–42.5) | 61.3 (49.4–72.3) |
| 23 months | 67.6 (49.5–82.6) | 57.1 (18.41–90.1) | 88.5 (75.9–94.9) | 26.7 (14.0–44.8) | 65.8 (49.4–79.9) |
PPV, positive predictive value; NPV, negative predictive value.
ACKNOWLEDGMENTS
Lilly makes patient-level data available from Lilly-sponsored studies on marketed drugs for approved uses following approval by regulators in the US and EU and after the primary manuscript describing the results has been accepted for publication, whichever is later. Lilly is one of several companies that provide this access through the website clinicalstudydatarequest.com. Qualified researchers can submit research proposals and request anonymized data to test new hypotheses. Lilly’s data sharing policies are provided on the clinicalstudydatarequest.com site under the Study Sponsors page.
Data collection and sharing for this project was funded by the Alzheimer’s Disease Neuroimaging Initiative (ADNI) (National Institutes of Health Grant U01 AG024904) and DOD ADNI (Department of Defense award number W81XWH-12-2-0012). ADNI is funded by the National Institute on Aging, the National Institute of Biomedical Imaging and Bioengineering, and through generous contributions from the following: AbbVie, Alzheimer’s Association; Alzheimer’s Drug Discovery Foundation; Araclon Biotech; BioClinica, Inc.; Biogen; Bristol-Myers Squibb Company; CereSpir, Inc.; Cogstate; Eisai Inc.; Elan Pharmaceuticals, Inc.; Eli Lilly and Company; EuroImmun; F. Hoffmann-La Roche Ltd and its affiliated company Genentech, Inc.; Fujirebio; GE Healthcare; IXICO Ltd.; Janssen Alzheimer Immunotherapy Research & Development, LLC.; Johnson & Johnson Pharmaceutical Research & Development LLC.; Lumosity; Lundbeck; Merck & Co., Inc.; Meso Scale Diagnostics, LLC.; NeuroRx Research; Neurotrack Technologies; Novartis Pharmaceuticals Corporation; Pfizer Inc.; Piramal Imaging; Servier; Takeda Pharmaceutical Company; and Transition Therapeutics. The Canadian Institutes of Health Research is providing funds to support ADNI clinical sites in Canada. Private sector contributions are facilitated by the Foundation for the National Institutes of Health (http://www.fnih.org). The grantee organization is the Northern California Institute for Research and Education, and the study is coordinated by the Alzheimer’s Therapeutic Research Institute at the University of Southern California. ADNI data are disseminated by the Laboratory for Neuro Imaging at the University of Southern California.
This work was supported by grants from the Alzheimer’s Association (Ezzati, 2019-AACSF-641329), and the Leonard and Sylvia Marx Foundation (PI: Lipton). Dr. Lipton is also supported by grants from National Institutes of Health NIA 2 P01 AG03949, NIA 1R01AG039409-01, and the Czap Foundation.
Footnotes
Authors’ disclosures available online (https://www.j-alz.com/manuscript-disclosures/19-0822r2).
REFERENCES
- [1].Fratiglioni L, De Ronchi D, Agüero-Torres H (1999) Worldwide prevalence and incidence of dementia. Drugs Aging 15, 365–375. [DOI] [PubMed] [Google Scholar]
- [2].Prince M, Comas-Herrera A, Knapp M, Guerchet M, Karagiannidou M (2016) World Alzheimer Report 2016. Improving healthcare for people living with dementia: Coverage, quality and costs now and in the future Alzheimer Disease International, London. [Google Scholar]
- [3].Mangialasche F, Solomon A, Winblad B, Mecocci P, Kivipelto M (2010) Alzheimer’s disease: Clinical trials and drug development. Lancet Neurol 9, 702–716. [DOI] [PubMed] [Google Scholar]
- [4].Willis SL, Tennstedt SL, Marsiske M, Ball K, Elias J, Koepke KM, Morris JN, Rebok GW, Unverzagt FW, Stoddard AM, Wright E (2006) Long-term effects of cognitive training on everyday functional outcomes in older adults. JAMA 296, 2805–2814. [DOI] [PMC free article] [PubMed] [Google Scholar]
- [5].Ball K, Berch DB, Helmers KF, Jobe JB, Leveck MD, Marsiske M, Morris JN, Rebok GW, Smith DM, Tennstedt SL, Unverzagt FW, Willis SL (2002) Effects of cognitive training interventions with older adults: A randomized controlled trial. JAMA 288, 2271–2281. [DOI] [PMC free article] [PubMed] [Google Scholar]
- [6].Godyn J, Jonczyk J, Panek D, Malawska B (2016) Therapeutic strategies for Alzheimer’s disease in clinical trials. Pharmacol Rep 68, 127–138. [DOI] [PubMed] [Google Scholar]
- [7].Cummings JL, Morstorf T, Zhong K (2014) Alzheimer’s disease drug-development pipeline: Few candidates, frequent failures. Alzheimers Res Ther 6, 37. [DOI] [PMC free article] [PubMed] [Google Scholar]
- [8].Zammit AR, Hall CB, Katz MJ, Muniz-Terrera G, Ezzati A, Bennett DA, Lipton RB (2018) Class-specific incidence of all-cause dementia and Alzheimer’s disease: A latent class approach. J Alzheimers Dis 66, 347–357. [DOI] [PMC free article] [PubMed] [Google Scholar]
- [9].McKhann G, Drachman D, Folstein M, Katzman R, Price D, Stadlan EM (1984) Clinical diagnosis of Alzheimer’s disease: Report of the NINCDS-ADRDA Work Group* under the auspices of Department of Health and Human Services Task Force on Alzheimer’s Disease. Neurology 34, 939–944. [DOI] [PubMed] [Google Scholar]
- [10].Doody RS, Thomas RG, Farlow M, Iwatsubo T, Vellas B, Joffe S, Kieburtz K, Raman R, Sun X, Aisen PS (2014) Phase 3 trials of solanezumab for mild-to-moderate Alzheimer’s disease. N Engl J Med 370, 311–321. [DOI] [PubMed] [Google Scholar]
- [11].Giacobini E, Gold G (2013) Alzheimer disease therapy—moving from amyloid-[H9252] to tau. Nat Rev Neurol 9, 677. [DOI] [PubMed] [Google Scholar]
- [12].Selkoe DJ, Hardy J (2016) The amyloid hypothesis of Alzheimer’s disease at 25 years. EMBO Mol Med 8, 595–608. [DOI] [PMC free article] [PubMed] [Google Scholar]
- [13].Rathore S, Habes M, Iftikhar MA, Shacklett A, Davatzikos C (2017) A review on neuroimaging-based classification studies and associated feature extraction methods for Alzheimer’s disease and its prodromal stages. Neuroimage 155, 530–548. [DOI] [PMC free article] [PubMed] [Google Scholar]
- [14].Falahati F, Westman E, Simmons A (2014) Multivariate data analysis and machine learning in Alzheimer’s disease with a focus on structural magnetic resonance imaging. J Alzheimers Dis 41, 685–708. [DOI] [PubMed] [Google Scholar]
- [15].Doody RS, Raman R, Farlow M, Iwatsubo T, Vellas B, Joffe S, Kieburtz K, He F, Sun X, Thomas RG (2013) A phase 3 trial of semagacestat for treatment of Alzheimer’s disease. N Engl J Med 369, 341–350. [DOI] [PubMed] [Google Scholar]
- [16].Morris JC (1993) The Clinical Dementia Rating (CDR): Current version and scoring rules. Neurology 43, 2412–2414. [DOI] [PubMed] [Google Scholar]
- [17].Folstein MF, Folstein SE, McHugh PR (1975) Mini-mental state: A practical method for grading the cognitive state of patients for the clinician. J Psychiatr Res 12, 189–198. [DOI] [PubMed] [Google Scholar]
- [18].Mohs RC, Knopman D, Petersen RC, Ferris SH, Ernesto C, Grundman M, Sano M, Bieliauskas L, Geldmacher D, Clark C, Thal LJ (1997) Development of cognitive instruments for use in clinical trials of antidementia drugs: Additions to the Alzheimer’s Disease Assessment Scale that broaden its scope. The Alzheimer’s Disease Cooperative Study. Alzheimer Dis Assoc Disord 11 Suppl 2, S13–S21. [PubMed] [Google Scholar]
- [19].Ezzati A, Jiang J, Katz MJ, Sliwinski MJ, Zimmerman ME, Lipton RB (2014) Validation of the Perceived Stress Scale in a community sample of older adults. Int J Geriatr Psychiatry 29, 645–652. [DOI] [PMC free article] [PubMed] [Google Scholar]
- [20].Patro S, Sahu KK (2015) Normalization: A preprocessing stage. arXiv preprint arXiv:1503.06462 [Google Scholar]
- [21].Duda RO, Hart PE, Stork DG (2012) Pattern classification, John Wiley & Sons. [Google Scholar]
- [22].Ezzati A, Zammit AR, Harvey DJ, Habeck C, Hall CB, Lipton RB, Alzheimer’s Disease Neuroimaging Initiative (2019) Optimizing machine learning methods to improve predictive models of Alzheimer’s disease. J Alzheimers Dis 71, 1027–1036. [DOI] [PMC free article] [PubMed] [Google Scholar]
- [23].Ezzati A, Zammit AR, Habeck C, Hall CB, Lipton RB, Alzheimer’s Disease Neuroimaging Initiative (2019) Detecting biological heterogeneity patterns in ADNI amnestic mild cognitive impairment based on volumetric MRI. Brain Imaging Behav, doi: 10.1007/s11682-019-00115-6 [DOI] [PMC free article] [PubMed] [Google Scholar]
- [24].Shaffer JL, Petrella JR, Sheldon FC, Choudhury KR, Calhoun VD, Coleman RE, Doraiswamy PM, Alzheimer’s Disease Neuroimaging Initiative (2013) Predicting cognitive decline in subjects at risk for Alzheimer disease by using combined cerebrospinal fluid, MR imaging, and PET biomarkers. Radiology 266, 583–591. [DOI] [PMC free article] [PubMed] [Google Scholar]
- [25].Zammit AR, Muniz-Terrera G, Katz MJ, Hall CB, Ezzati A, Bennett DA, Lipton RB (2019) Subtypes based on neuropsychological performance predict incident dementia: Findings from the Rush Memory and Aging Project. J Alzheimers Dis 67, 125–135. [DOI] [PMC free article] [PubMed] [Google Scholar]
- [26].Frisoni GB, Fox NC, Jack CR Jr, Scheltens P, Thompson PM (2010) The clinical use of structural MRI in Alzheimer disease. Nat Rev Neurol 6, 67. [DOI] [PMC free article] [PubMed] [Google Scholar]
- [27].Honig LS, Vellas B, Woodward M, Boada M, Bullock R, Borrie M, Hager K, Andreasen N, Scarpini E, Liu-Seifert H (2018) Trial of solanezumab for mild dementia due to Alzheimer’s disease. N Engl J Med 378, 321–330. [DOI] [PubMed] [Google Scholar]
- [28].Coric V, Salloway S, van Dyck CH, Dubois B, Andreasen N, Brody M, Curtis C, Soininen H, Thein S, Shiovitz T (2015) Targeting prodromal Alzheimer disease with avagacestat: A randomized clinical trial. JAMA Neurol 72, 1324–1333. [DOI] [PubMed] [Google Scholar]
- [29].Shah ND, Steyerberg EW, Kent DM (2018) Big data and predictive analytics: Recalibrating expectations. JAMA 320, 27–28. [DOI] [PubMed] [Google Scholar]
- [30].Benge JF, Balsis S, Geraci L, Massman PJ, Doody RS (2009) How well do the ADAS-cog and its subscales measure cognitive dysfunction in Alzheimer’s disease? Dement Geriatr Cogn Disord 28, 63–69. [DOI] [PubMed] [Google Scholar]
- [31].Chandrashekar G, Sahin F (2014) A survey on feature selection methods. Comput Electr Eng 40, 16–28. [Google Scholar]