

Abstract
Background:
There is a need for valid self-report measures of core health-related quality of life (HRQoL) domains.
Objective:
To derive brief, reliable and valid health profile measures from the Patient Reported Outcomes Measurement Information System® (PROMIS®) item banks.
Methods:
Literature review, investigator consensus process, item response theory (IRT) analysis, and expert review of scaling results from multiple PROMIS data sets. We developed 3 profile measures ranging in length from 29 to 57 questions. These profiles assess important HRQoL domains with highly informative subsets of items from respective item banks and yield reliable information across mild-to-severe levels of HRQoL experiences. Each instrument assesses the domains of pain interference, fatigue, depression, anxiety, sleep disturbance, physical function, and social function using 4-, 6-, and 8-item short forms for each domain, and an average pain intensity domain score, using a 0–10 numeric rating scale.
Results:
With few exceptions, all domain short forms within the profile measures were highly reliable across at least 3 standard deviation (30 T-score) units and were strongly correlated with the full bank scores. Construct validity with ratings of general health and quality of life was demonstrated. Information to inform statistical power for clinical and general population samples is also provided.
Conclusions:
Although these profile measures have been used widely, with summary scoring routines published, description of their development, reliability, and initial validity has not been published until this article. Further evaluation of these measures and clinical applications are encouraged.
Keywords: health-related quality of life, patient-reported outcome measurement, information system, PROMIS®
Introduction
The demand for patient-reported outcome (PRO) assessment has increased for evaluations of comparative effectiveness research, quality performance, and clinical practice.1–4 The United States National Institutes of Health’s Patient-Reported Outcomes Measurement Information System® (PROMIS) represents a state- of-the-science model for standardized PRO assessment of health-related quality of life (HRQoL).5–9 There is great demand for applications of the PROMIS methodology5,6,10 to create accurate assessments of a broad range of health domains.11
With more than 100 HRQoL domains assessed within PROMIS (HealthMeasures.net/PROMIS, accessed July, 2018), it is important and useful to identify a “short list” of domains that are relevant for most health contexts. Previous research has relied on an array of generic and disease-specific questionnaires, and many studies have reported using multiple overlapping measures to capture self-reported heath. There are prior examples of “generic” or general purpose health profile measures.12–15 Nevertheless, these efforts have not used the advantages afforded by item response theory (IRT) to guide item selection and ensure broad coverage of the HRQoL continuum for multiple research and clinical practice applications. The PROMIS Profiles were designed to address this need, using patient-centered content and modern psychometric methods such as IRT, with clinical expert input.
This article is the first to describe the development of 3 adult health PROMIS Profile instruments, ranging in length from 29 to 57 items, covering 7 core HRQoL domains: pain (intensity and interference), fatigue, depression, anxiety, sleep disturbance, physical function, and satisfaction with participation in social roles. These profiles comprise 4-, 6-, or 8-item short forms of each domain, plus a 0–10 pain intensity numeric rating item. Although the development, reliability, and validity of these PROMIS Profile scores have not yet been published, Hays et al16 developed and published summary scoring for physical and mental health based on the 29-item version, and others have developed single health preference (utility) scores from the same 29-item profile.17,18 As of January 2019, these 3 PROMIS Profile instruments have been downloaded from the HealthMeasures.net website in English or Spanish more than 6000 times, and translated into more than 40 languages for international use. This article, therefore, provides the evidentiary foundation to support the extensive and growing use of the PROMIS profile instruments. We include a description of the rationale for selecting the HRQoL domains to be assessed, an overview of the item selection process for each domain, consideration of the qualitative and quantitative distinctions among the profiles of different lengths, and initial evidence for their reliability and validity. We conclude with recommendations for the administration of these tools and suggestions for further research in this area.
Methods and Results
There were 2 stages in the development of the PROMIS Profile instruments. First, we identified the HRQoL domains to be included in the measures. Second, we selected well-performing (ie, informative) items that represented the range of HRQoL content in each domain. We used 3 datasets for the second step. A subset of 3507 respondents to the PROMIS Wave 1 general population dataset were administered complete item banks.5,6,9,19,20 Participants were administered all items in an item bank except for participants assigned to physical function, who completed a random half of the items because of the large size of the item bank. The second dataset was one used to assess sleep disturbance,21,22 and the third dataset was collected to assess social health.23 Sample sizes for each domain ranged from 628 (fatigue) to 1255 (sleep disturbance). Although we used existing datasets, the analyses reported here have not been previously published.
Identification of the PROMIS Profile Domains
Informed by an extensive literature review, the PROMIS domains included in these profile measures were originally identified through activation and implementation of a Domain Framework Mapping Protocol.5,6 The Appendix Figure (see Supplemental Materials found at https://doi.org/10.1016/j.jval.2019.02.004) shows the current PROMIS Domain Framework, a taxonomy of self-reported health status. An earlier, less-detailed version of this framework was used to guide a consensus-building discussion of the most important, representative HRQoL domains to be included in the profile. The PROMIS Steering Committee (7 principal investigators and 5 NIH collaborators) included physicians, social scientists, and psychometricians who discussed the extant literature and chose the core HRQoL domains to be included in the PROMIS profiles. These domains were to be selected from among the 22 domains and subdomains included in the PROMIS Domain Framework at the time the decisions were made.
The PROMIS Steering Committee decision process began with a commitment to the inclusion of at least one domain from each of the 3 major components of self-reported HRQoL: physical, mental, and social (Appendix Figure). Considering the available literature, PROMIS Steering Committee members discussed and built consensus regarding which specific domains were to be included within each of the 3 components. The selected subcomponents, domains, and subdomains are indicated in the Appendix Figure by the blue-shaded boxes and text. In the first round of the selection process, the Steering Committee identified 3 subdomains from the physical health component (pain interference,24 fatigue,25 and physical function26), 2 subdomains from the mental health component (anxiety and depression27), and 1 subdomain from social health (satisfaction with participation in social roles).23 After confirming these 6 domains, sleep disturbance was added, based on its relevance to many health conditions and growing evidence for its central importance to a definition of positive health.21 The addition of the 0–10 numeric rating of average pain intensity was also added at this stage to provide context for the assessment of pain interference and based on its widespread use in clinical research and practice. The HRQoL domains selected for the PROMIS Profile measures therefore included the following: anxiety, depression, fatigue, pain (interference and intensity), sleep disturbance, physical function, and satisfaction with participation in social roles.
Identification of the Item Sets for Each PROMIS Domain
For each of these PROMIS domains, item banks were developed based on input from domain-specific content experts, thorough review of relevant extant outcome measures, extensive archival data analyses, and qualitative methods that aimed to incorporate feedback from clinical samples and the general population.5,6,28 These item banks were subsequently evaluated and calibrated using the graded-response model based on IRT to allow for administration as computer adaptive tests (CATs) and fixed-length short form administrations.8
Drawing from the items in these previously calibrated PROMIS item banks, item selection incorporated item statistics and input on the content from clinical experts. Preference was given to items that were relevant (based on content review) and targeted toward clinical (as opposed to healthy) populations. As a first step, items were sorted based on the total amount of information provided by each item over the interval ranging from the PROMIS T-score mean of 50 to 2 standard deviations worse than the mean. Next, 1000 CAT simulations were conducted based on the items in each item bank. Average selection order was then recorded for each item. Because of the intended use of these profiles in clinical populations, the mean for the simulated subjects was set to 1 SD worse than the mean of the general population. The sort results, along with the ranking of item information, were used to develop a list of the 15 most informative candidate items in each HRQoL domain for review and discussion by content experts.
Candidate items were evaluated by panels of 3 to 5 domain content experts in the PROMIS network. Each panel was asked to select the 8 best items from the list of 15 provided for each PROMIS domain. They were instructed to attend to clinical relevance while balancing the range of content across the 8 selected items to maintain content validity. Several criteria were considered by these panels when selecting the final items. The most important of these was the relevance of item content for clinical populations, defined based on the observation of average responses of known clinical subgroups in PROMIS Wave 1 testing.9 Other considerations included the following: (1) avoiding overlapping content across items, (2) avoiding the use of items with highly similar psychometric properties (eg, discrimination and threshold parameters), (3) avoiding the use of colloquial or awkward language, and (4) aiming for consistency of response options among the item sets. Although the expert panels were made aware of the CAT rank order of each item (from 1 to 15), they were instructed that any of the 15 items would suffice because all had emerged as the best of their respective banks on the criteria.
Once 8 items were selected for an 8-item form, items were removed to create shorter forms. Specifically, panels were instructed to remove 2 items to create a 6-item form, again attempting to maintain content coverage. Another 2 items were similarly removed to create a 4-item short form for each domain. Therefore, every 4-item short form (eg, physical function 4a) is a subset of the 6-item short form (eg, physical function 6a), which in turn is a subset of the 8-item form (eg, physical function 8a). These lengths (4, 6, or 8 items) were chosen to provide short forms with different levels of reliability to balance with the length of the scale. The length for the shortest version was supported by evidence that all but one of the 4-item sets had similar measurement precision to CAT administrations across 2 to 3 standard deviations.29 The 6- and 8-item versions are each incrementally more informative (see Figure 1).
Figure 1.
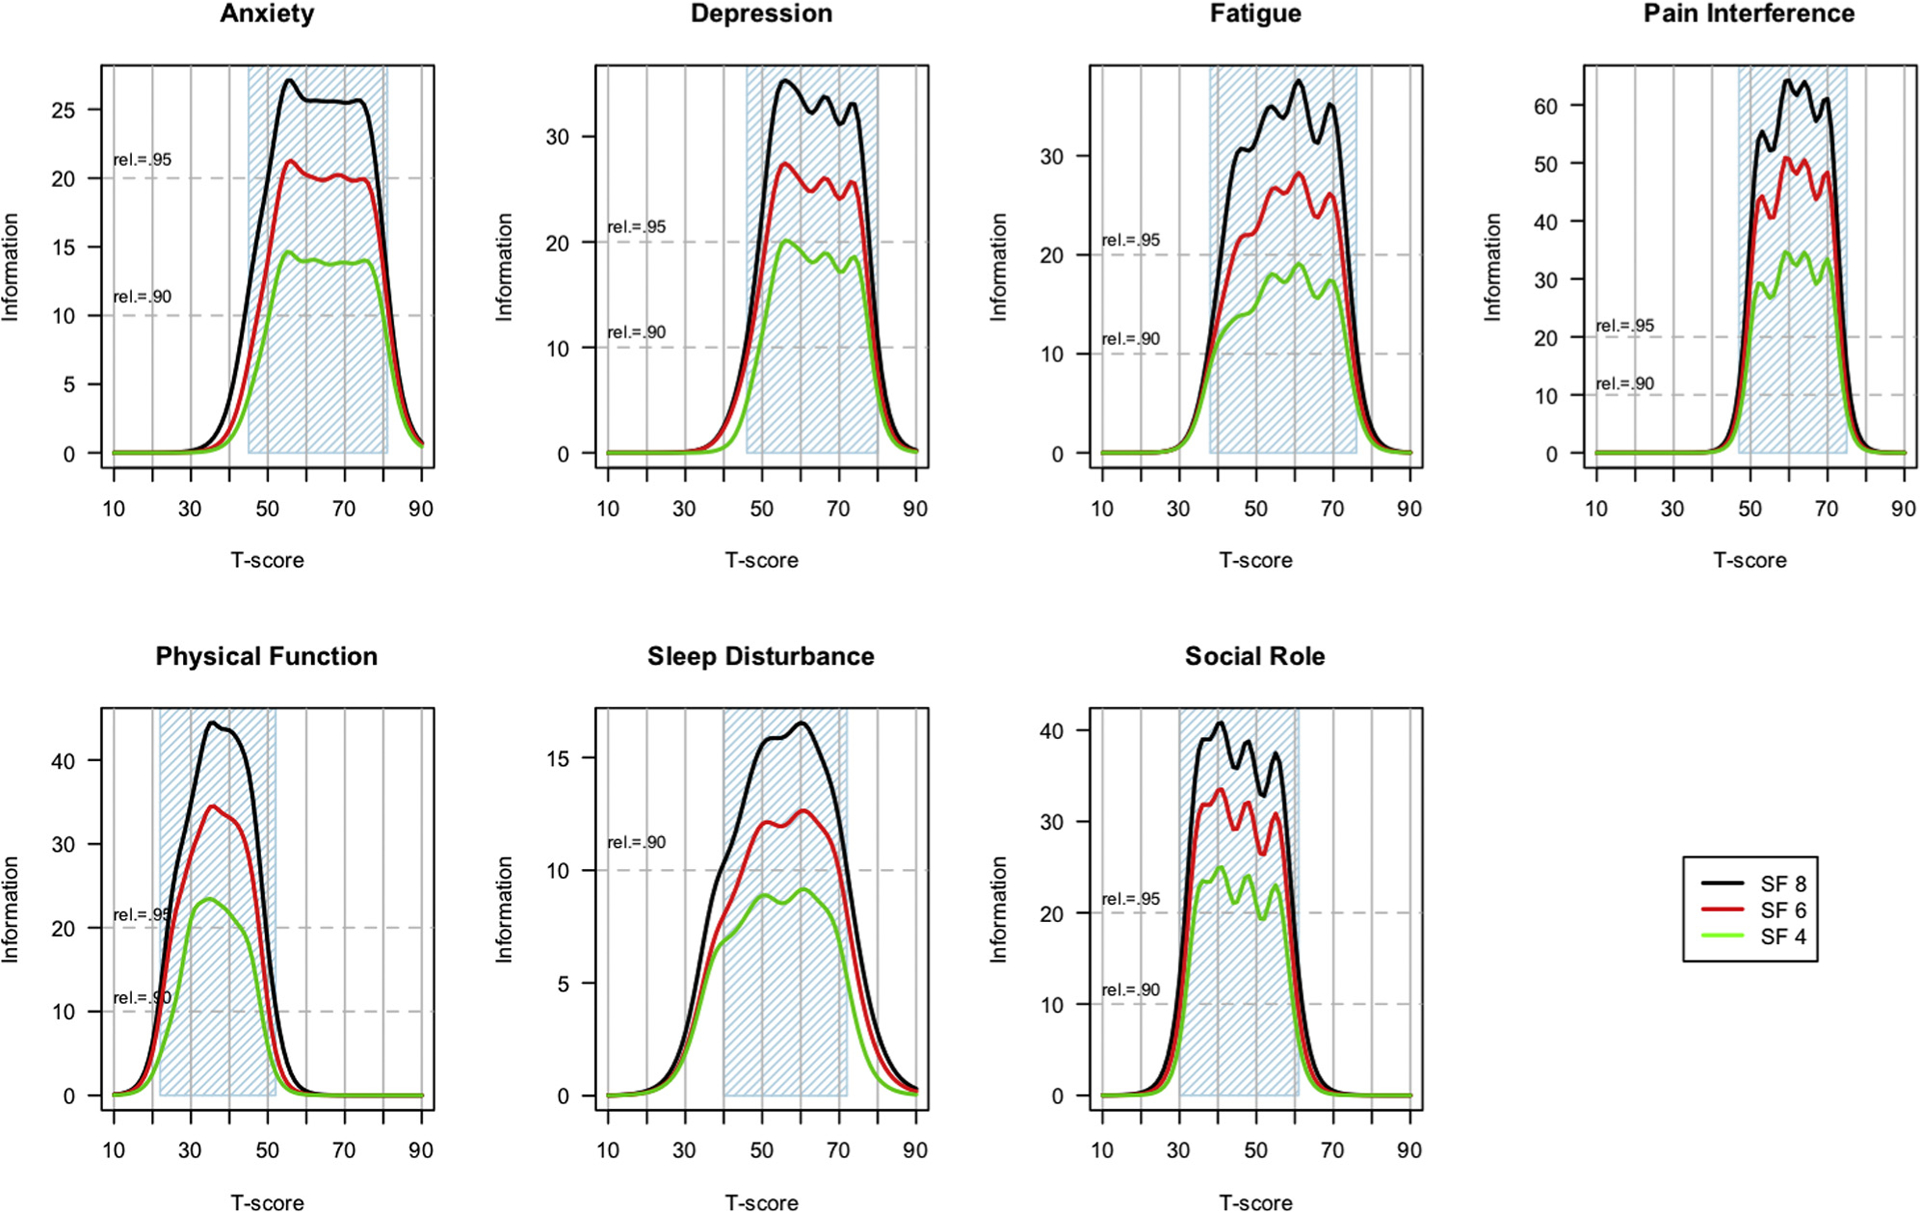
Test information functions by domain.
The Appendix Table (see Supplemental Materials found at https://doi.org/10.1016/j.jval.2019.02.004) describes several characteristics of the PROMIS Profile domains, including the operational definitions, counts of the items in each bank, and the recall period (where applicable) used for the 4-, 6-, and 8-item short forms. Items in the 2 domains that do not use a recall period (physical function and satisfaction with participation in social roles) ask about current abilities rather than experiences over the previous 7 days. In addition to the 7 domains listed in the Appendix Table, the 29-, 43-, and 57-item PROMIS Profile measures all include a single-item rating of pain intensity with a 7-day recall period and an 11-point rating scale from “0—no pain” to “10—worst pain imaginable.” All the remaining items use a 5-category response scale; the specific labels for these response options vary by domain. All of the PROMIS Profile forms are available for downloading in English and Spanish, at www.HealthMeasures.net.
The IRT scale information functions are shown for each short form across each domain in Figure 1. These information plots were generated from the IRT-based parameters (threshold and slope) associated with the items in each profile short form. These parameters were previously estimated and centered using PROMIS Wave 1 data19; see Cella et al5 and Liu et al20 for more information regarding the calibration procedures. For most domains, the general population mean is set to a T-score of 50 with SD = 1020; however, sleep disturbance was calibrated on a mixed general population and clinical sample such that the mean and distribution are likely to reflect a population that has more than the average amount of sleep disturbance.21 With IRT, reliability is not a single number associated with a given measure; rather it is, as illustrated in Figure 1, expressed as precision or “information” and it varies along the PROMIS T-score continuum. Classical reliability equivalents are provided by dotted red lines in each Figure 1 domain plot, and the blue shading indicates what could be referred to as a highly reliable range of measurement for each domain. Almost all forms of the PROMIS Profile domains (indicated with blue shading in Figure 1 for reliability ≥0.9) include mild to severe impairment. Except for the 4-item physical function short form and the 4-and 6-item sleep disturbance short forms, each short form reliably measures a range of 3 standard deviations or more (ie, ≥30 points) on the T-score metric across all domains. Longer short forms were consistently and significantly more informative (reliable), as expected, given the fully nested relationship of the short forms.
Correlations between scores on the full item bank and each of the 4-, 6-, and 8-item PROMIS short forms are shown in Figure 2. The dashed line in each figure shows the change in correlation based on the administration of each incremental item in the 8-item short form (recall that the 8-item short form includes all of the items in the 4- and 6-item forms). The correlations were above 0.9 for all forms in 6 of the 7 domains. Correlations for the physical function (PF) domain ranged from 0.83 for the 4-item form to 0.89 for the 8-item form. This is likely due to somewhat more heterogeneity of content in the PF item bank relative to the other banks and selection of PF items that emphasize mobility over other concepts such as upper extremity function and flexibility.26,30,31
Figure 2.
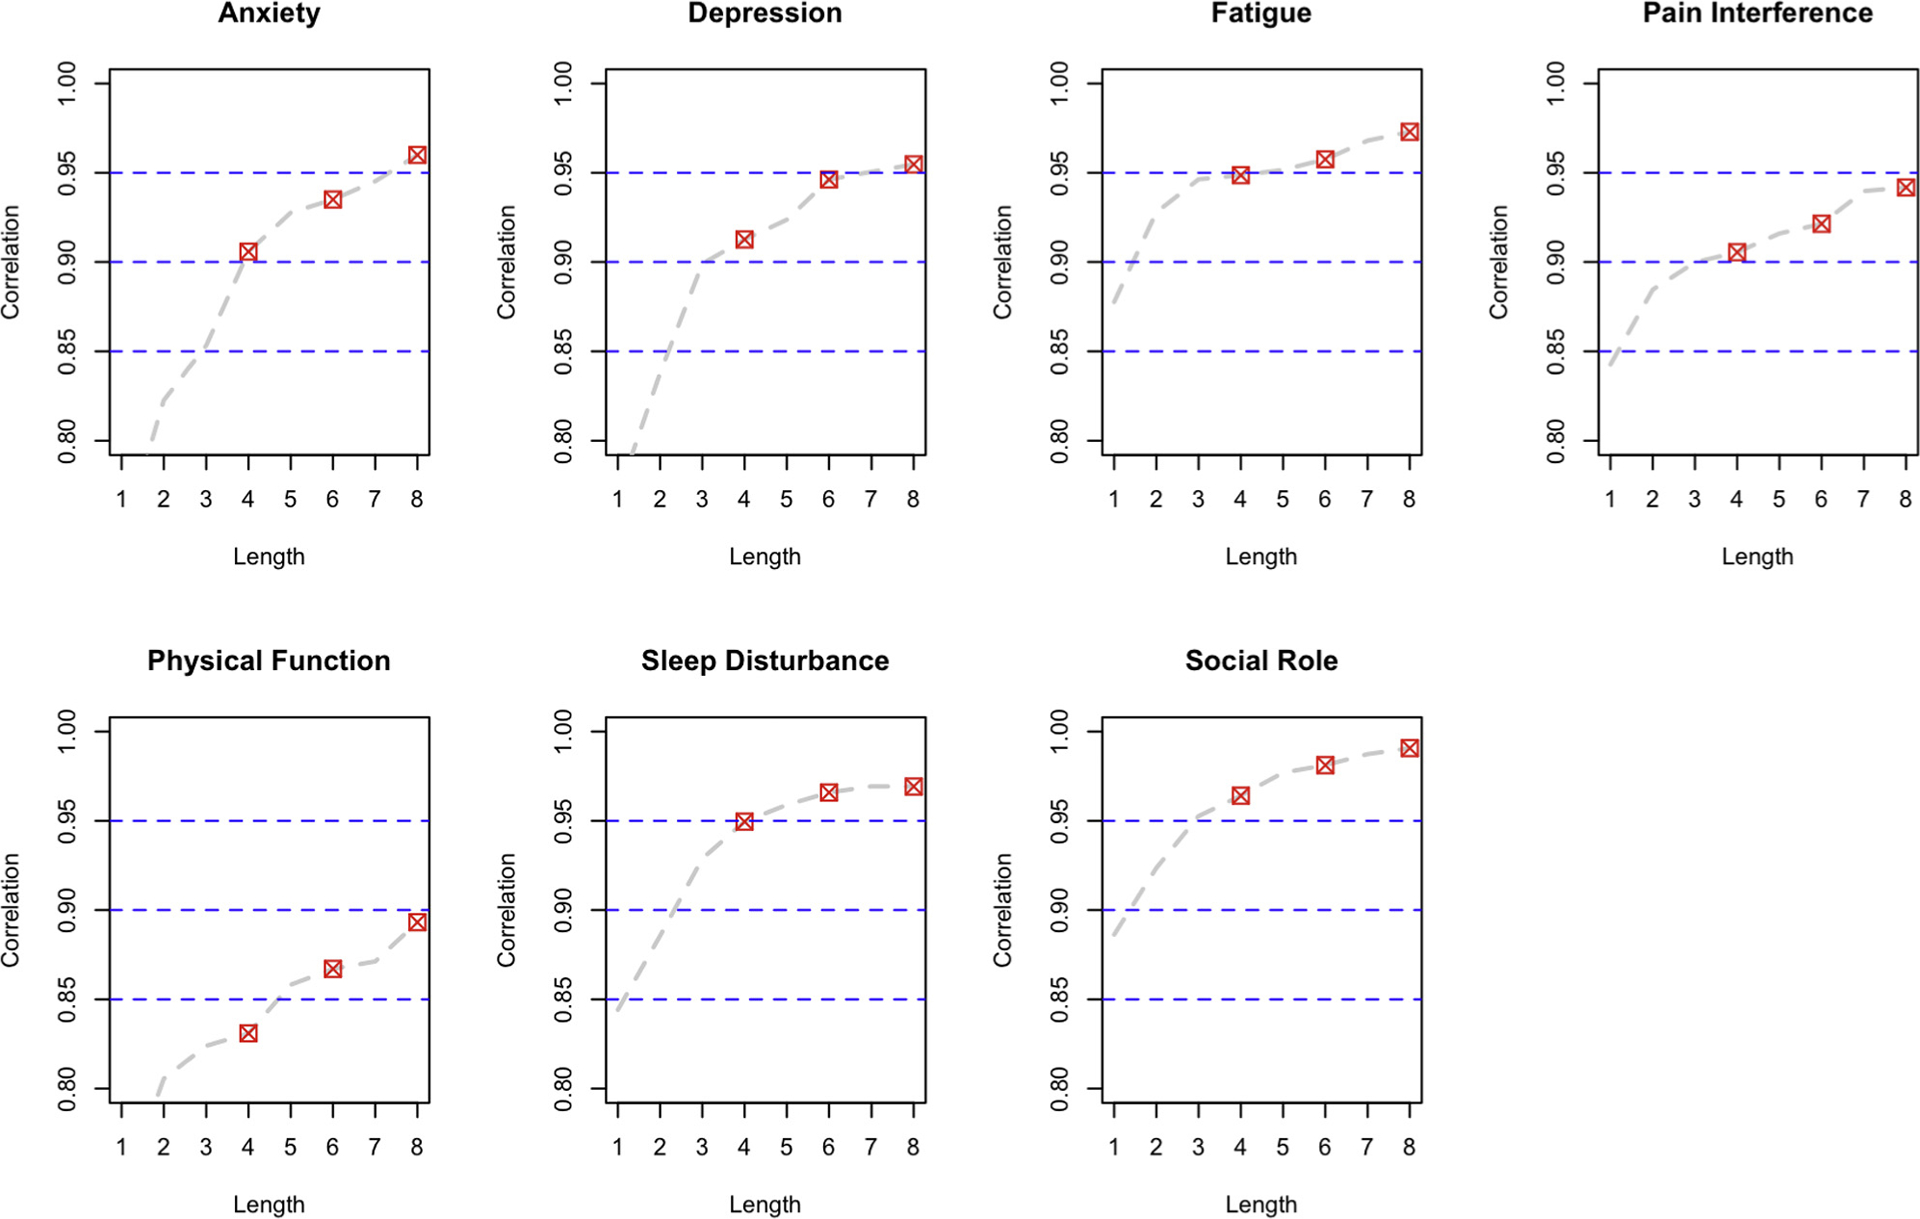
Short form correlations with full banks by domain.
Investigators often ask how much statistical power a given test will have in a planned study or experiment. These short forms were constructed to maximize their precision and efficiency in clinical samples, estimated to be 1 SD worse than the general population. It is therefore likely that they will have greater power to detect differences or change in clinical samples compared with samples drawn from the general population. Nevertheless, researchers are using these PROMIS Profiles in a wide range of disease and nondisease populations. Therefore, we illustrate power considerations for general population samples and for clinical population samples. Researchers can choose which one makes more sense for their planning purposes based on the anticipated health status of their sample. Figures 3 and 4 demonstrate estimated power to detect a small effect if the target population is centered on the general population (Figure 3) or 1 SD (10 T-score points) worse than the general population, such as in a typical clinical sample (Figure 4). The sample sizes needed for equivalent power are smaller in the clinical sample for all domains, though the differences vary considerably by domain. Power is roughly equivalent in sleep disturbance, for example, whereas the sample size needed for 80% power to detect a small effect (d = 0.2) in physical function is reduced by approximately two-thirds in a physically compromised clinical population (n = 50 for the 8-item short form) relative to the general population (n = 150 for the 8- item short form). For clinical samples, most of the increased power achieved using a longer form is present in the 6-item forms, with modest incremental gain in the 8-item forms. Thus, the PROMIS-57 Profile provides little incremental power over the PROMIS-43 Profile for all but the smallest of sample sizes.
Figure 3.
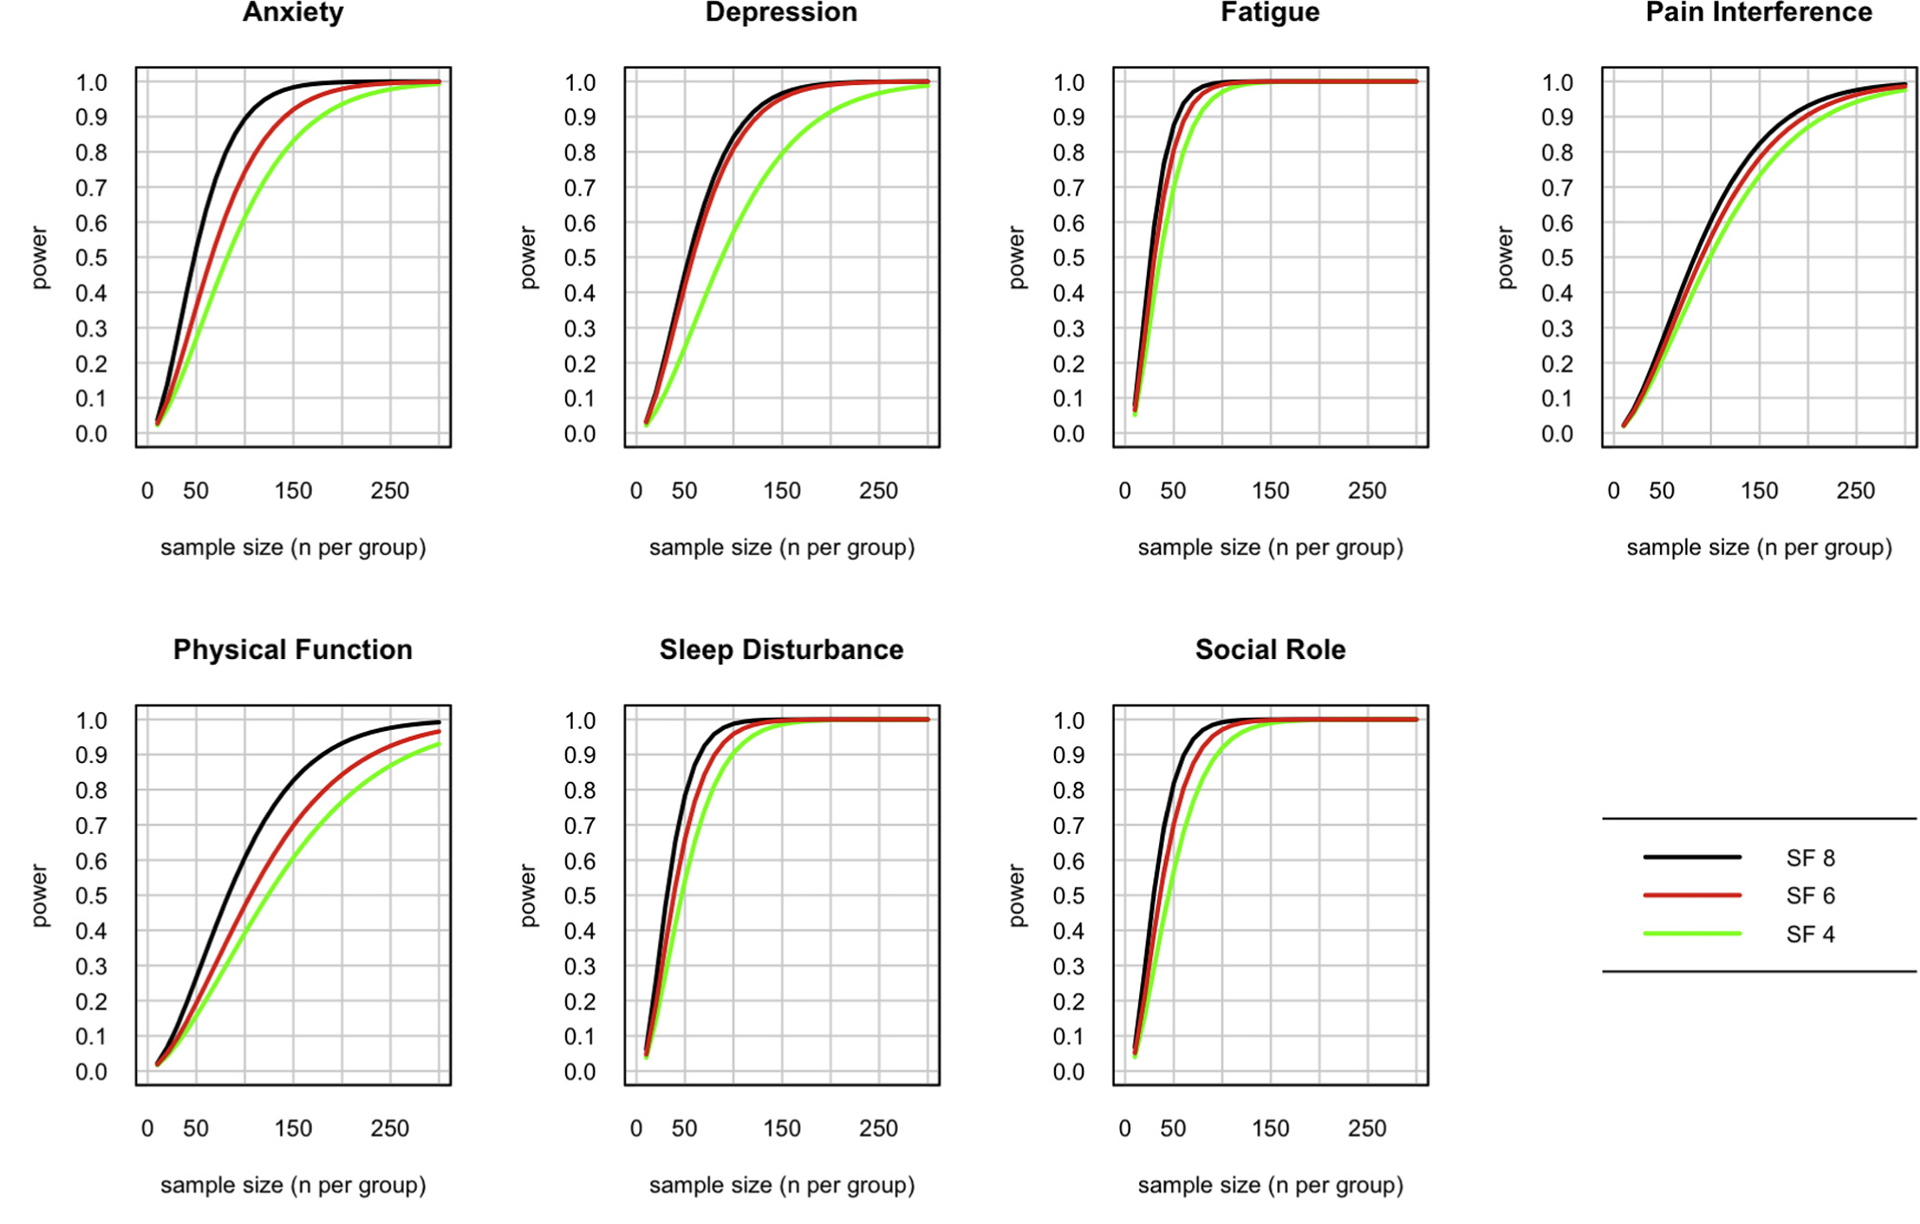
Estimated power to detect a small effect (d = 0.2) in a general population for each of the short forms by domain.
SF indicates short form.
Figure 4.
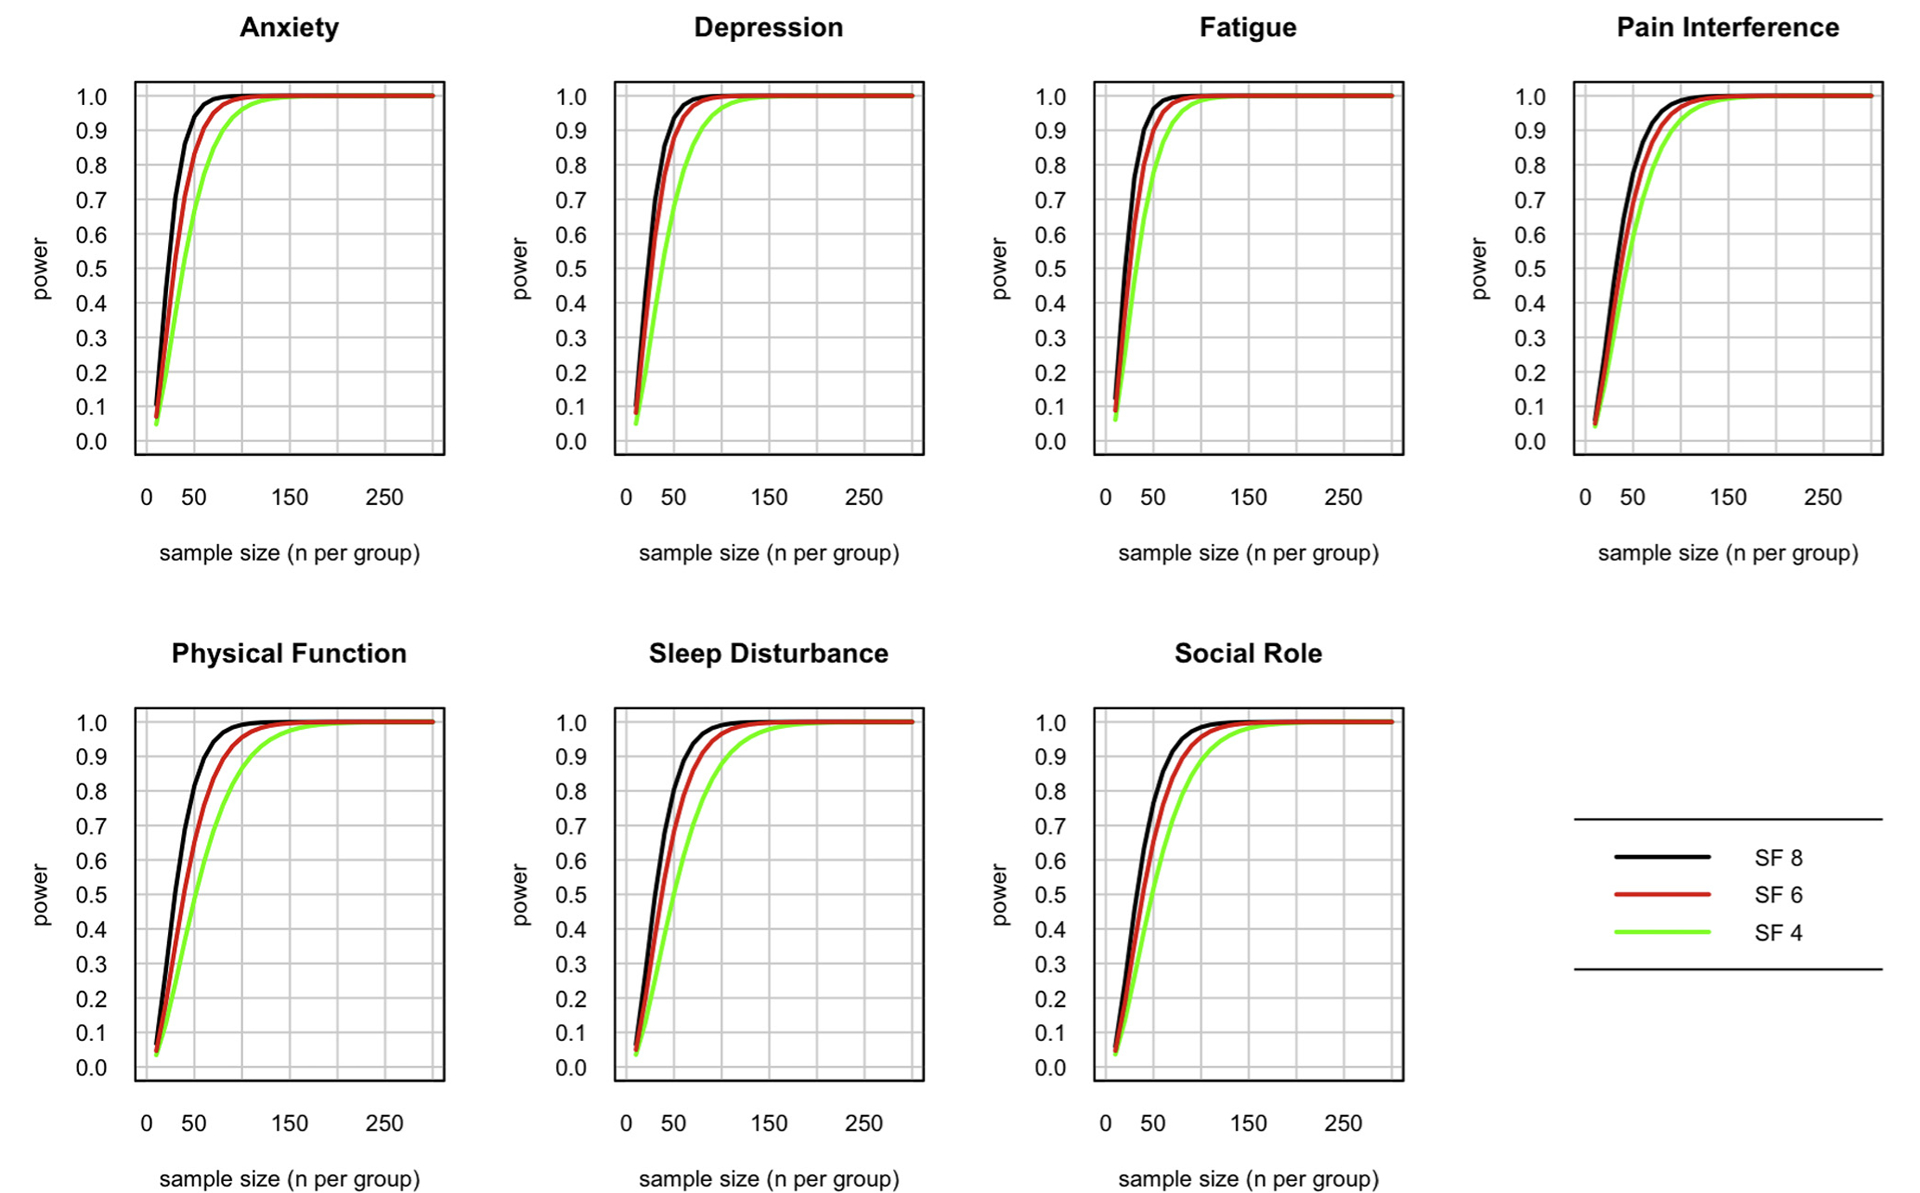
Estimated power to detect a small effect (d = 0.2) in a clinical population (1 SD below mean) for each of the short forms by domain.
SF indicates short form.
To evaluate construct validity of these profile short forms, we compared scores on the profile domains to responses to 2 questions from the PROMIS Global Health scale.32–34 First, we divided the general population sample into 5 groups based on their responses to a single-item rating of overall health, with options being “poor,” “fair,” “good,” “very good,” and “excellent.” For this analysis, we used a subset of the PROMIS Wave I general population sample having complete response data on each bank. The sample sizes ranged from 628 (fatigue) to 1255 (sleep disturbance). For each group of respondents, the mean T-score for each domain in the PROMIS Profiles is shown in Figure 5. This illustration demonstrates highly similar patterns of responding, whether participant scores are based on all items in the bank for each domain (“full bank”) or the 8-, 6-, or 4-item short forms. Figure 5 also demonstrates that the domain-specific assessments of health in the PROMIS Profiles are consistent with overall health ratings, though the distribution of T-scores does vary by domain. The group differences for depression and anxiety, for example, are greater than those observed for pain interference and physical function.
Figure 5.
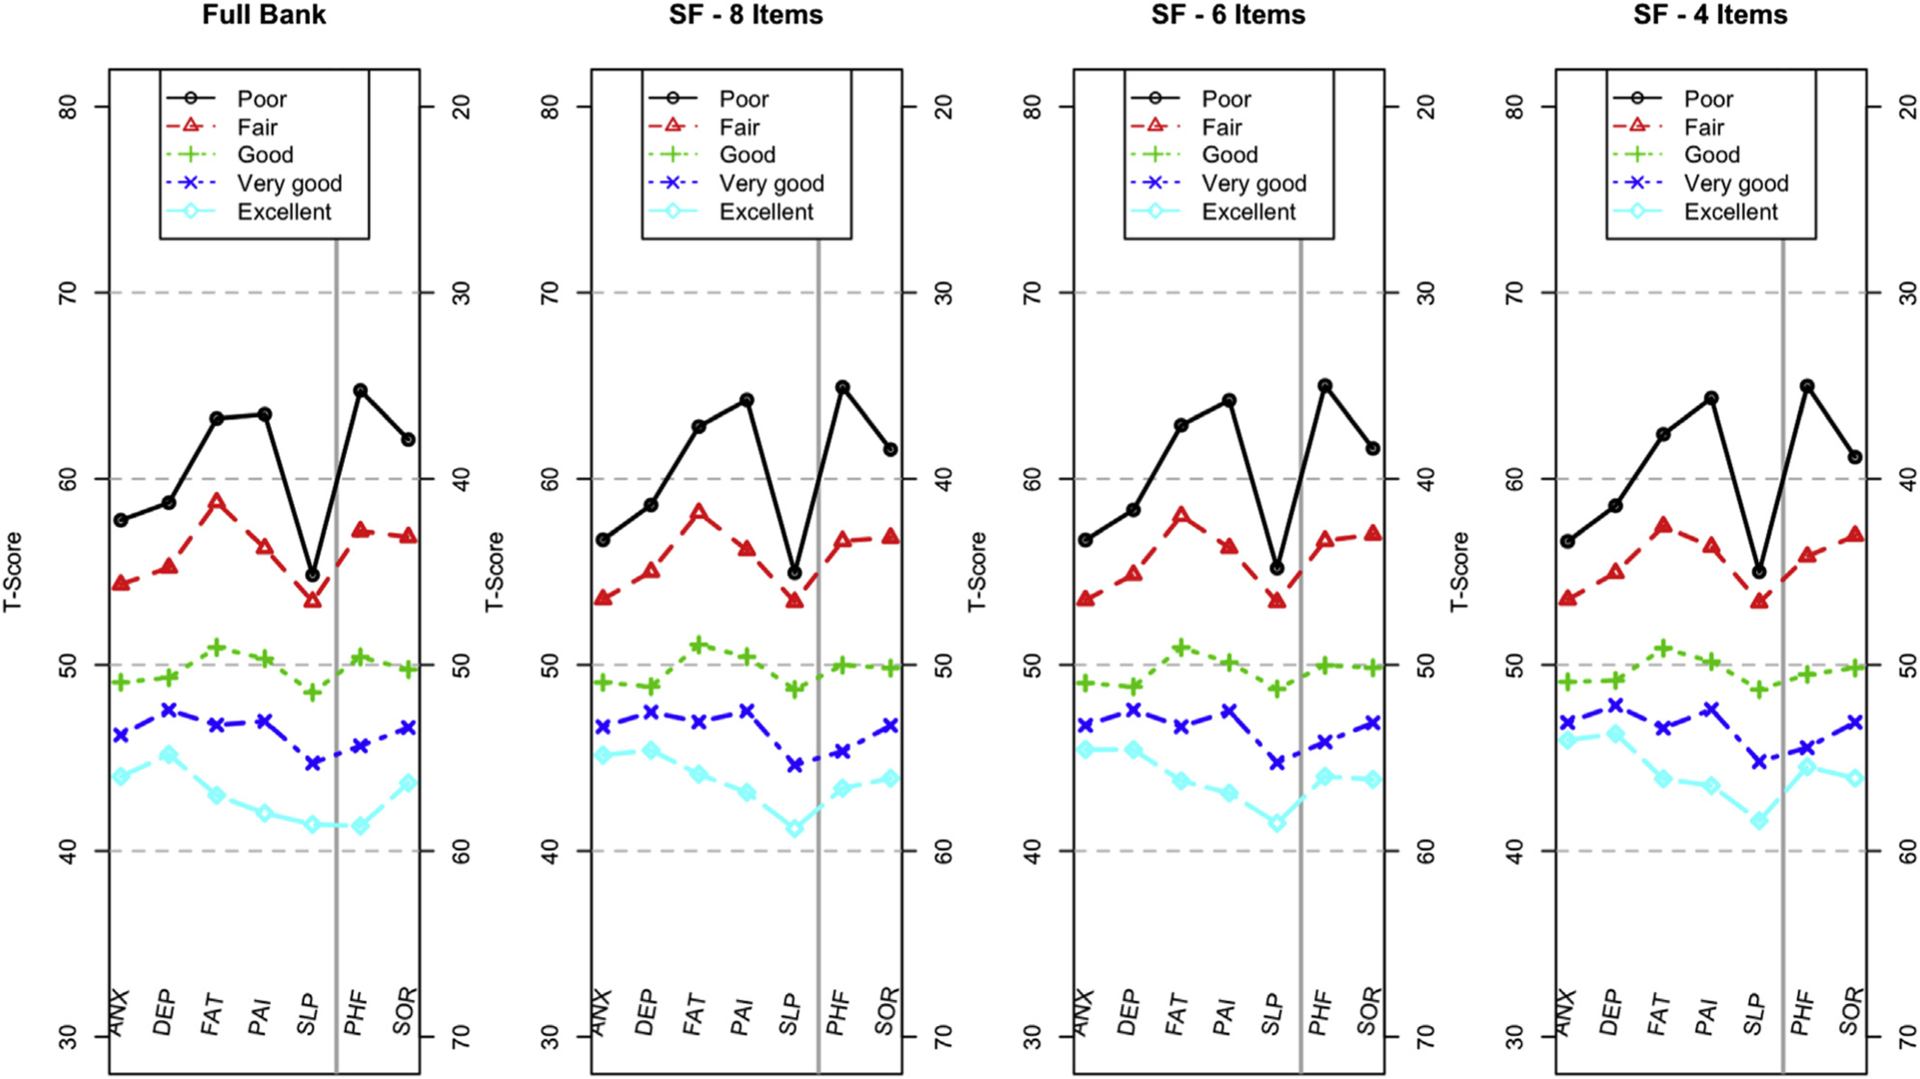
Mean T-scores by domain based on responses to the item: “In general, would you say your health is . .” The y-axis for PHF and SOR is on the right side of the panel, enabling a profile plot in which the upper part of each plot is consistently worse than the lower part of the plot.
ANX indicates Anxiety; DEP, Depression; FAT, Fatigue; PAI, Pain Interference; PHF, Physical Function; SF, short form; SLP, Sleep Disturbance; SOR, Satisfaction with Participation in Social Roles and Activities.
The same approach was used with a second question from the PROMIS Global Health Scale, asking about overall quality of life. Figure 6 demonstrates that these results are very similar to those in Figure 5, conferring additional support for the construct validity of the PROMIS Profiles.
Figure 6.
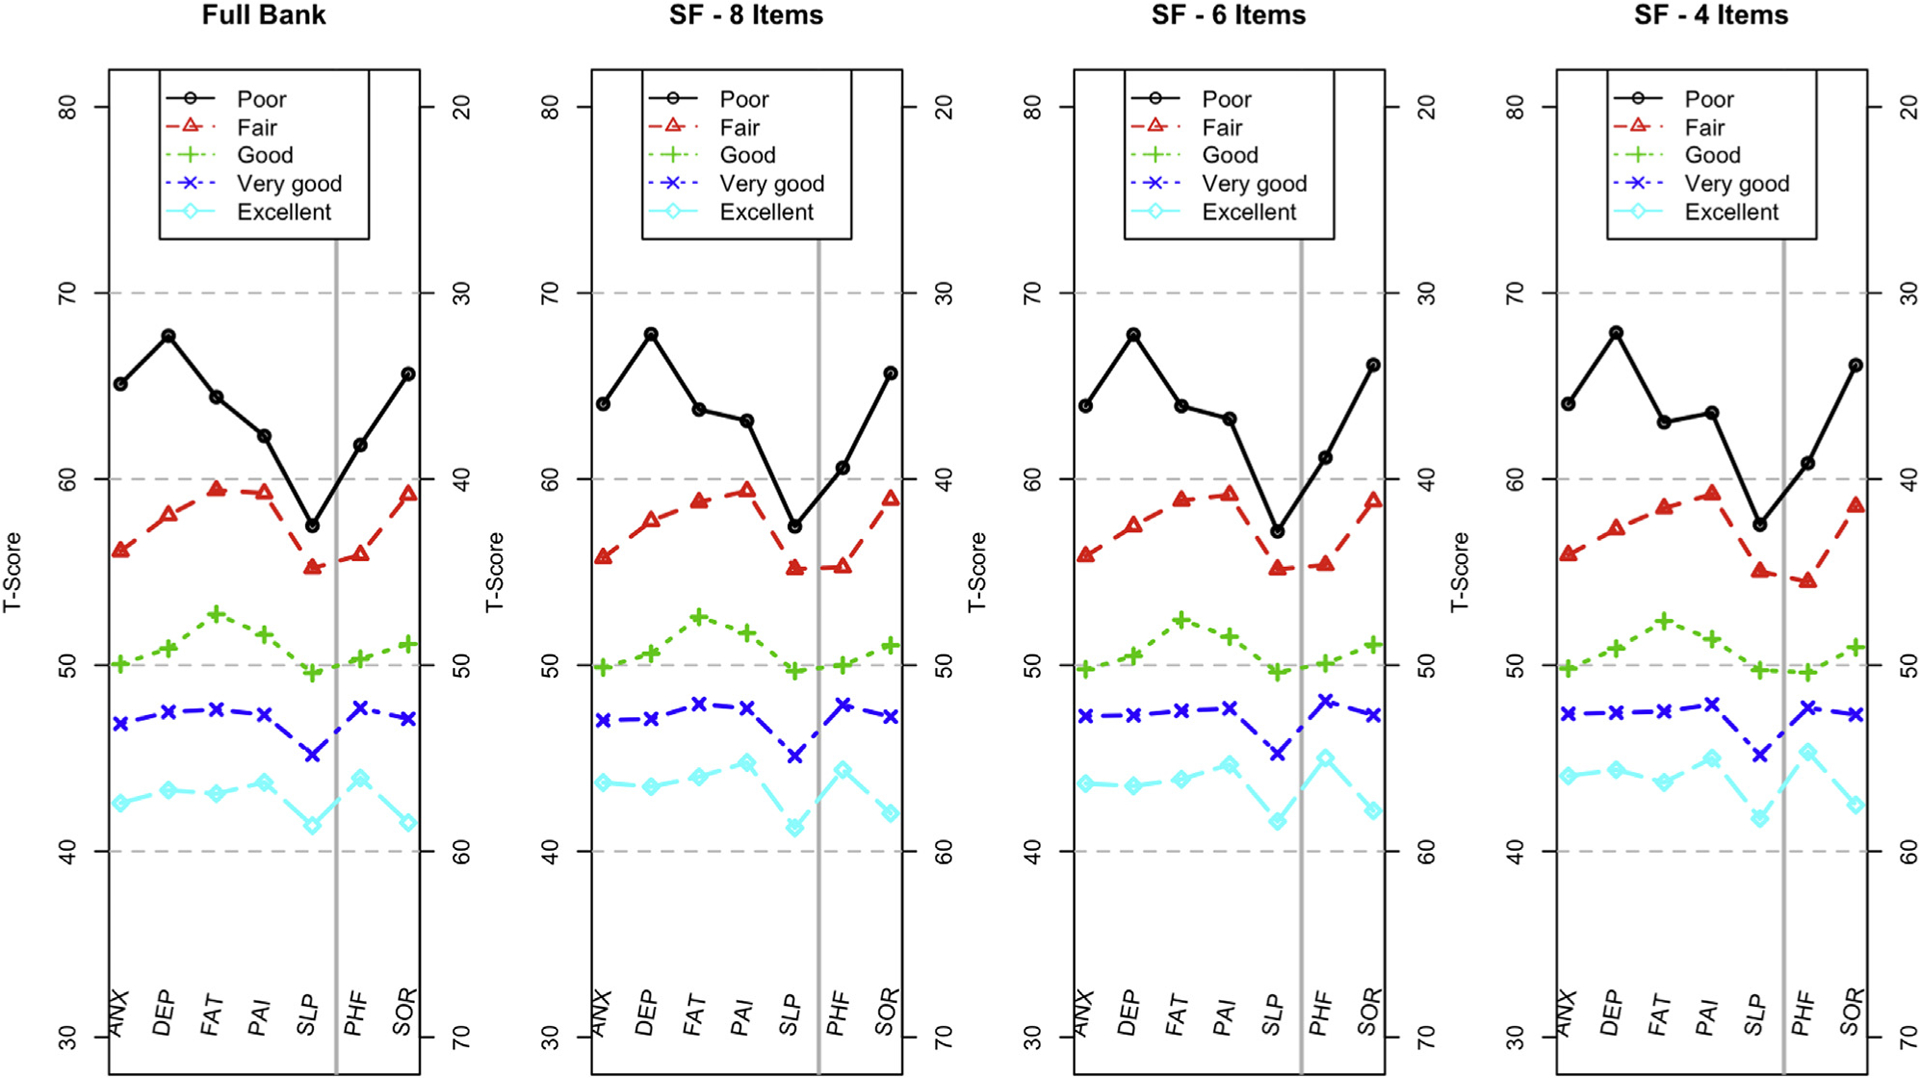
Mean T-scores by domain based on responses to the item: “In general, would you say your quality of life is … ” The y-axis for PHF and SOR is on the right side of the panel, enabling a profile plot in which the upper part of each plot is consistently worse than the lower part of the plot.
ANX indicates Anxiety; DEP, Depression; FAT, Fatigue; PAI, Pain Interference; PHF, Physical Function; SF, short form; SLP, Sleep Disturbance; SOR, Satisfaction with Participation in Social Roles and Activities.
Discussion
The value of short-form health profile instruments was evidenced by the widespread use of the SF-36/RAND-36 survey.12–15 The PROMIS Profiles are well-suited to meet the demand for a concise, multidimensional measure of core domains of patient-reported health-related quality of life. They cover 7 domains that were selected based on input from patient-reported outcomes assessment experts affiliated with the PROMIS network.
Items for each domain were selected from PROMIS item banks to maximize efficiency and minimize overlap across domains. Selection was based on the following: (1) input from domain experts about their content validity and (2) evidence for strong psychometric properties (information) after the administration of full item banks to large samples. High correlations between scores on the item banks and on the domain-specific forms suggest that the profiles offer a similar breadth of assessment with much shorter lengths. This, in turn, contributes to the utility of the PROMIS Profile measures for detecting small effects in relatively small samples.
Each of the domains in the PROMIS Profiles can also be administered as a CAT, but the profiles described here were developed in 3 fixed-length formats. Although there are many advantages to the use of CATs instead of short forms with fixed item composition (including the potential for more precise assessment with fewer items per participant, on average), there are many reasons to support the use of short forms. For one, there is strong evidence of the efficiency of PROMIS short forms in many domains.35 Not only are the scores produced by short forms and CATs highly correlated, but also there are some domains where the CATs provide only marginal benefit in terms of efficiency for most of the population, though this varies considerably by domain. Simulations with CAT, for example, suggest that anxiety and depression may be well measured by 8-item short-forms, whereas CAT versions of the physical health domains (physical function, pain interference, and fatigue) extend the range beyond short-forms considerably.29 In addition to these psychometric considerations, many clinicians and researchers prefer to administer the same items to each respondent in a cross-sectional assessment or to the same respondent across multiple administrations. In other cases, fixed-length forms are required because electronic assessment is not an option owing to technological limitations inherent to the assessment context or characteristics of those being assessed (eg, subgroup that is uncomfortable with computer based assessment). Some investigators and clinicians, including regulatory authorities, tend to prefer fixed short forms because it guarantees that all respondents answer the same questions. Given that these and other circumstances preclude the use of CATs, the PROMIS Profiles are an excellent alternative.
The results provide evidence for the construct validity of the PROMIS Profile scores. Increments in single-item ratings of overall health and quality of life (Figures 5 and 6) were associated with the same pattern of increments in PROMIS Profile scores; the patterns were uniformly distinct (nonoverlapping) across domains. Additional evidence has also been found in other published studies.16,17,36–40
The 7 core domains for these profile instruments were chosen at a time when not all PROMIS domains were fully developed. At the time of selection, 22 domains and subdomains had been calibrated (see the Appendix Figure for updated framework). Based on the degree of validation at the time the profiles were developed, the first version (v1.0) of these PROMIS Profiles used “satisfaction with ability to participate in social roles and activities” to represent social function. Nevertheless, when the “ability to participate in social roles and activities” (v2.0) item bank became available, we switched to this “ability” social health measure rather than satisfaction (from v1.0) because social participation (ability to participate) is more typically used as a research outcome. Therefore, version 2.0 and subsequent versions of the PROMIS Profiles include ability to participate in social roles rather than satisfaction with social participation. Construction of the ability short forms followed the same methodology as described presently. Also, although we began with what we found to be the most common, and therefore important, patient-reported HRQoL domains, it is possible that other HRQoL domains should be included in the PROMIS Profiles. For example, cognitive function, under construction but not yet available at the time of profile development, might be a useful core domain in some circumstances. Hanmer and colleagues18 found this to be true when constructing a multi-attribute PROMIS Preference (“PROPr”) measure. Fortunately, any researcher or clinician can add an assessment of any domain not included in the PROMIS Profiles using fixed short forms (eg, 4-, 6-, or 8-item scales), custom short forms, or CAT.
Because the PROMIS Profiles provide 7 separate scores and each domain is scored separately, the Profiles can be customized for the specific context. For instance, a study of people with chronic pain could choose to use 4 items for all domains except pain interference, which could be measured by 6 or 8 items to achieve more precision.
In conclusion, we developed 3 PROMIS Profile instruments that include high-information, content-balanced short forms from 7 core health domains (pain, fatigue, depression, anxiety, sleep, physical function, and social function). These profiles are 29, 43, and 57 items long and based on inclusion of 4-, 6-, and 8-item short forms of each domain, plus a 0 to 10 pain intensity numeric rating item. These profiles are highly reliable across mild to severe levels of clinical severity and sensitive to differences in self-reported health-related quality of life.
Supplementary Material
Acknowledgment
This work was funded by the US National Institutes of Health, grant numbers U01AR052177, U54AR057951, and U2CCA186878. The authors would like to thank James F. Fries, MD, Professor Emeritus, Stanford University, for his valuable advice and input on this article.
Footnotes
Supplemental Materials
Supplementary data associated with this article can be found in the online version at https://doi.org/10.1016/j.jval.2019.02.004.
REFERENCES
- 1.Ahmed S, Berzon RA, Revicki DA, et al. The use of patient-reported outcomes (PRO) within comparative effectiveness research: implications for clinical practice and health care policy. Med Care. 2012;50(12):1060–1070. [DOI] [PubMed] [Google Scholar]
- 2.Basch E New Frontiers in patient-reported outcomes: adverse event reporting, comparative effectiveness, and quality assessment. Annu Rev Med. 2014;65(1):307–317. [DOI] [PubMed] [Google Scholar]
- 3.Rotenstein LS, Huckman RS, Wagle NW. Making patients and doctors happier—the potential of patient-reported outcomes. N Engl J Med. 2017;377(14):1309–1312. [DOI] [PubMed] [Google Scholar]
- 4.Baumhauer JF. Patient-reported outcomes—are they living up to their potential? N Engl J Med. 2017;377(1):6–9. [DOI] [PubMed] [Google Scholar]
- 5.Cella D, Riley W, Stone A, et al. The Patient-Reported Outcomes Measurement Information System (PROMIS) developed and tested its first wave of adult self-reported health outcome item banks: 2005–2008. J Clin Epidemiol. 2010;63(11):1179–1194. [DOI] [PMC free article] [PubMed] [Google Scholar]
- 6.Cella D, Yount S, Rothrock N, et al. The Patient-Reported Outcomes Measurement Information System (PROMIS): progress of an NIH roadmap cooperative group during its first two years. Med Care. 2007;45(5 Suppl 1):S3–S11. [DOI] [PMC free article] [PubMed] [Google Scholar]
- 7.Cook KF, Jensen SE, Schalet BD, et al. PROMIS® measures of pain, fatigue, negative affect, physical function and social function demonstrate clinical validity across a range of chronic conditions. J Clin Epidemiol. 2016;73:89–102. [DOI] [PMC free article] [PubMed] [Google Scholar]
- 8.Reeve BB, Hays RD, Bjorner JB, et al. Psychometric evaluation and calibration of health-related quality of life item banks: plans for the Patient-Reported Outcomes Measurement Information System (PROMIS). Med Care. 2007;45(5 Suppl 1):S22–S31. [DOI] [PubMed] [Google Scholar]
- 9.Rothrock N, Hays R, Spritzer K, Yount SE, Riley W, Cella D. Relative to the general US population, chronic diseases are associated with poorer health-related quality of life as measured by the Patient-Reported Outcomes Measurement Information System (PROMIS). J Clin Epidemiol. 2010;63(11):1195–1204. [DOI] [PMC free article] [PubMed] [Google Scholar]
- 10.Calvert M, Kyte D, Mercieca-Bebber R, et al. Guidelines for inclusion of Patient-Reported Outcomes in Clinical Trial Protocols: the SPIRIT-PRO extension. JAMA. 2018;319(5):483–494. [DOI] [PubMed] [Google Scholar]
- 11.Riley WT, Rothrock N, Bruce B, et al. Patient-reported outcomes measurement information system (PROMIS) domain names and definitions revisions: further evaluation of content validity in IRT-derived item banks. Qual Life Res. 2010;19(9):1311–1321. [DOI] [PMC free article] [PubMed] [Google Scholar]
- 12.Stewart AL, Hays RD, Ware JE Jr. The MOS Short-Form General Health Survey: reliability and validity in a patient population. Med Care. 1988;26(7):724–735. [DOI] [PubMed] [Google Scholar]
- 13.Ware JE, Snow KK, Kosinski M, Gandek B. New England Medical Center, Health I. SF-36 Health Survey: Manual and Interpretation Guide Boston: Health Institute, New England Medical Center; 1993. [Google Scholar]
- 14.Hays RD, Sherbourne CD, Mazel RM. The RAND 36-Item Health Survey 1.0. Health Econ. 1993;2(3):217–227. [DOI] [PubMed] [Google Scholar]
- 15.Hays RD, Morales LS. The RAND-36 measure of health-related quality of life. Ann Med. 2001;33(5):350–357. [DOI] [PubMed] [Google Scholar]
- 16.Hays RD, Spritzer KL, Schalet BD, Cella D. PROMIS®−29 v2.0 profile physical and mental health summary scores. Qual Life Res. 2018;27(7):1885–1891. [DOI] [PMC free article] [PubMed] [Google Scholar]
- 17.Craig BM, Reeve BB, Brown PM, et al. US valuation of health outcomes measured using the PROMIS-29. Value Health. 2014;17(8):846–853. [DOI] [PMC free article] [PubMed] [Google Scholar]
- 18.Hanmer J, Cella D, Feeny D, et al. Selection of key health domains from PROMIS® for a generic preference-based scoring system. Qual Life Res. 2017;26:3377–3385. [DOI] [PMC free article] [PubMed] [Google Scholar]
- 19.Cella D PROMIS 1 Wave 1. 2015. http://hdl.handle.net/1902.1/21134.
- 20.Liu H, Cella D, Gershon R, et al. Representativeness of the Patient-Reported Outcomes Measurement Information System Internet panel. J Clin Epidemiol. 2010;63(11):1169–1178. [DOI] [PMC free article] [PubMed] [Google Scholar]
- 21.Buysse DJ, Moul DE, Germain A, et al. Development and validation of patient-reported outcome measures for sleep disturbance and sleep-related impairments. Sleep. 2010;33(6):781–792. [DOI] [PMC free article] [PubMed] [Google Scholar]
- 22.Yu L, Buysse DJ, Germain A, et al. Development of short forms from the PROMIS sleep disturbance and Sleep-Related Impairment item banks. Behav Sleep Med. 2011;10(1):6–24. [DOI] [PMC free article] [PubMed] [Google Scholar]
- 23.Hahn EA, DeWalt DA, Bode RK, et al. New English and Spanish social health measures will facilitate evaluating health determinants. Health Psychol. 2014;33(5):490–499. [DOI] [PMC free article] [PubMed] [Google Scholar]
- 24.Amtmann D, Cook KF, Jensen MP, et al. Development of a PROMIS item bank to measure pain interference. Pain. 2010;150(1):173–182. [DOI] [PMC free article] [PubMed] [Google Scholar]
- 25.Lai JS, Cella D, Choi SW, et al. How item banks and their application can influence measurement practice in rehabilitation medicine: A PROMIS fatigue item bank example. Arch Phys Med Rehabil. 2011;92(10 Supplement):S20–S27. [DOI] [PMC free article] [PubMed] [Google Scholar]
- 26.Rose M, Bjorner JB, Gandek B, Bruce B, Fries JF, Ware JE Jr. The PROMIS Physical Function item bank was calibrated to a standardized metric and shown to improve measurement efficiency. J Clin Epidemiol. 2014;67(5):516–526. [DOI] [PMC free article] [PubMed] [Google Scholar]
- 27.Pilkonis PA, Choi SW, Reise SP, Stover AM, Riley WT, Cella D. Item banks for measuring emotional distress from the Patient-Reported Outcomes Measurement Information System (PROMIS): depression, anxiety, and anger. Assessment. 2011;18(3):263–283. [DOI] [PMC free article] [PubMed] [Google Scholar]
- 28.DeWalt DA, Rothrock N, Yount S, Stone AA, PROMIS Cooperative Group. Evaluation of Item Candidates: The PROMIS Qualitative Item Review. Med Care. 2007;45(5 Suppl 1):S12–S21. [DOI] [PMC free article] [PubMed] [Google Scholar]
- 29.Segawa E, Schalet BD, Cella D. Understanding the difference between CATs and short-forms: a practical examination of the PROMIS Profiles and CAT item banks (under review). [Google Scholar]
- 30.Hays RD, Spritzer KL, Amtmann D, et al. Upper extremity and mobility subdomains from the Patient-Reported Outcomes Measurement Information System (PROMIS®) adult physical functioning item bank. Arch Phys Med Rehabil. 2013;94(11):2291–2296. [DOI] [PMC free article] [PubMed] [Google Scholar]
- 31.Kaat AJ, Buckenmaier CC, Cook KF, et al. The expansion and validation of a new upper extremity item bank for the Patient-Reported Outcomes Measurement Information System (PROMIS) (under review). [DOI] [PMC free article] [PubMed] [Google Scholar]
- 32.Hays RD, Bjorner J, Revicki DA, Spritzer K, Cella D. Development of physical and mental health summary scores from the Patient Reported Outcomes Measurement Information System (PROMIS) global items. Qual Life Res. 2009;18(7):873–880. [DOI] [PMC free article] [PubMed] [Google Scholar]
- 33.Hays RD, Spritzer KL, Thompson WW, Cella DUS. general population estimate for “excellent” to “poor” self-rated health item. J Gen Intern Med. 2015;30(10):1511–1516. [DOI] [PMC free article] [PubMed] [Google Scholar]
- 34.Hays RD, Schalet BD, Spritzer KL, Cella D. Two-item PROMIS® global physical and mental health scales. J Patient Rep Outcomes. 2017;1(1):2. [DOI] [PMC free article] [PubMed] [Google Scholar]
- 35.Choi S, Reise S, Pilkonis P, Hays R, Cella D. Efficiency of static and computer adaptive short forms compared to full-length measures of depressive symptoms. Qual Life Res. 2010;19(1):125–136. [DOI] [PMC free article] [PubMed] [Google Scholar]
- 36.Beaumont JL, Cella D, Phan AT, Choi S, Liu Z, Yao JC. Comparison of health-related quality of life in patients with neuroendocrine tumors with quality of life in the general US population. Pancreas. 2012;41(3):461–466. [DOI] [PubMed] [Google Scholar]
- 37.Fischer F, Gibbons C, Coste J, Valderas JM, Rose M, Leplège A. Measurement invariance and general population reference values of the PROMIS Profile 29 in the UK, France, and Germany. Qual Life Res. 2018;27:999–1014. [DOI] [PubMed] [Google Scholar]
- 38.Katz P, Pedro S, Michaud K. Performance of the PROMIS 29-item profile in rheumatoid arthritis, osteoarthritis, fibromyalgia, and systemic lupus erythematosus. Arthritis Care Res. 2017;69:1312–1321. [DOI] [PubMed] [Google Scholar]
- 39.Pusic AL, Matros E, Fine N, et al. Patient-reported outcomes 1 year after immediate breast reconstruction: results of the mastectomy reconstruction outcomes consortium study. J Clin Oncol. 2017;35:2499–2506. [DOI] [PMC free article] [PubMed] [Google Scholar]
- 40.Witter JP. The promise of patient-reported outcomes measurement information system—turning theory into reality: a uniform approach to patient-reported outcomes across rheumatic diseases. Rheum Dis Clin North Am. 2016;42(2):377–394. [DOI] [PubMed] [Google Scholar]
Associated Data
This section collects any data citations, data availability statements, or supplementary materials included in this article.