Abstract
Purpose
To determine whether the female gender is a barrier for the access to cataract surgery services in South Asia in the last two decades.
Methods
Eligible cross-sectional studies were identified via computer searches and reviewing the reference lists of the obtained articles. The cataract surgical coverage (CSC) by sex based on person and eyes at visual acuity <3/60 and 6/18 is extracted. Pooled odds ratios (ORs) for males receiving cataract surgery in comparison with females were calculated by a random effect model.
Results
Sixteen studies with 135972 subjects were included in the final analysis. The pooled ORs of CSC by sex on a person basis at visual acuity <3/60 and at visual acuity <6/18 were 1.46 (95% CI: 1.23–1.75) and 1.14 (95% CI: 1.05–1.24), respectively. For CSC on a per-eye basis at visual acuity <3/60, the associations were statistically significant, with a pooled OR of 1.40 (95% CI: 1.16–1.70). The values of population attributable risk percentage at a per-person and per-eye basis at visual acuity <3/60 were 6.28% and 7.48%, respectively. Subgroup analyses by design and location types attained similar results as the primary analyses. There was no evidence of publication bias.
Conclusions
The female gender remains a significant barrier for the access to cataract surgery in South Asia. Visual impairment, including blindness, from unoperated cataract, could be reduced by approximately 6.28% with the elimination of gender disparities to access. More efforts are needed to increase eye care service utilization by female population.
1. Introduction
In 2010, it was estimated that there were 39 million people blind globally, with 51% being attributed to cataract [1]. In particular, the female population accounts for approximately 60.0% of blindness and 57% of moderate-to-severe visual impairment [2]. South Asia, which accounts for 24.6% of the world's population, has undergone fundamental transitions in society and economic development over the past two decades. Although this region has achieved significant progress in blindness prevention, it still accounts for 32.7% of the world's blind population in 2010 [2]. In addition, the expansion rate of the blinded population was 4 times higher in females than that in males (16.1% versus 3.7%) from 1990 to 2010, which poses significant public health concerns [2, 3]. Cataract remains the leading cause of blindness, which accounts for 41.7% blindness in this region in 2010 [3].
Cataract blindness can be cured by a straightforward and cost-effective procedure. Economic analysis demonstrates that cataract surgery led to substantial improvements in quality of life, increases in income, and alleviation of poverty [4–7]. The financial return on investment of the first-eye cataract surgery was estimated to be 4567% over the 13-year model in the United States [8, 9]. Cataract surgical coverage (CSC) was recommended by the World Health Organization (WHO) for evaluating the accessibility and utilization of cataract surgical services in a given district. It was endorsed by the Global Action Plan (GAP) to assess and monitor the national eye service. CSC indicates the percentage of cataract surgeries and cataract surgical needs of the population, which reflects the actual community level situation.
Several years ago, the WHO and other nongovernment organizations (NGOs) introduced the VISION 2020 program to reduce the burden of vision loss worldwide. Considering the disproportionately high level of blindness in females, concerns over gender inequality were emphasized as the theme of the World Sight Day in 2009: Gender and eye health: equal access to care [5]. In a meta-analysis conducted 2 decades ago, Abou-Gareeb et al. reported that the chance of blindness in developing countries was 1.3 times higher in females compared to males [2, 10]. Previous anecdote meta-analysis indicated that the female gender was a barrier to the access of cataract surgery [11, 12]. However, limited studies were included in these analyses and the state of gender inequalities in access to cataract surgical services in South Asia is not well understood. Therefore, a systematic review and meta-analysis of population-based cross-sectional studies were performed to assess whether the female gender remains a significant barrier to access of cataract surgery in South Asia in the past two decades.
2. Materials and Methods
The protocol of this study was registered on the International Prospective Register of Systematic Reviews (CRD42017054426). This systematic review and meta-analysis were performed in accordance with the PRISMA statement (https://www.crd.york.ac.uk/PROSPERO/display_record.php?ID=CRD42017054426&ID=CRD42017054426) [13, 14]. Literature searches, study selection, and data extraction were conducted by two independent reviewers (QY and YC). Any disagreements were resolved by discussion and consulting a third senior reviewer (WW) if needed.
2.1. Data Sources and Searches
A systematic literature search was performed in Pubmed, Embase.com, and ISI Web of science from Jan 2000 to Jan 2019. The common keywords related to cataract surgery, cataract surgical coverage (CSC), population-based studies, and country names were used. The search strategy is detailed in Appendix 1. No language restriction was imposed. The Google Scholar Engine, Rapid Assessment of Avoidable Blindness (RAAB) repository (http://raabdata.info/repository/), and WHO website (http://www.who.int/en/) were also used to identify eligible studies. The reference lists of the included articles and related reviews were also screened to identify additional eligible studies.
2.2. Study Selection
Studies were included for analysis if they met the following criteria: (1) they were performed after 2000; (2) the study design was population-based or in the form of RAAB, national registry, or national/subnational survey of all populations; (3) the study was conducted in a general adult population; (4) the study reported the number of cataract surgery performed (person/eyes) and the number requiring cataract surgery (person/eyes) at visual acuities of <3/60 (20/400) or 6/18 (20/60), or provided the data needed to calculate them. To eliminate the bias by refractive errors, only the corrected or pinhole visual acuity was used for calculating CSC. For the same population with several studies performed at different times, only the latest one was included. For the same studies with multiple publications, only the most complete was included and the others were referenced for data extraction as needed. Hospital-based studies, studies in special settings such as leprosy villages, meeting abstracts, and studies with insufficient data were not included.
2.3. Data Extraction
For each study, the following information was collected: first author's name, year of publication, study design, location, characteristics of subjects, number of people receiving examinations, response rates, CSC by sex based on persons and eyes at different visual acuity cutoff, the number of persons/eyes operated, and the number of persons/eyes needing cataract surgery. CSC can be calculated at a per-person level or a per-eye level based at different visual acuity levels (<3/60, 6/60, and 6/18). For eyes, CSC is calculated as (a/(a + b)) × 100, where a = number of (pseudo)aphakic eyes and b = number of eyes with operable cataract (BCVA<3/60; <6/60; <6/18). For a person, CSC is calculated as ((x + y)/(x + y + z)) × 100, where x = persons with bilateral (pseudo)aphakia, y = persons with 1 (pseudo)aphakic and 1 operable cataract, and z = persons with bilateral operable cataract at different VA levels [15]. The two extreme cutoffs (3/60 and 6/18) were used in this study.
Many studies did not report raw data for calculating CSC and its 95% confidence interval (95% CI). To address this, we followed the methodology of previous meta-analysis by Lewallen et al. [11, 12]. For studies without raw data but reporting CSC by sex and their 95% CI, we calculated backwards to estimate the denominator (N), which equals to the sum of operated persons (eyes) and the number of persons (eyes) requiring cataract surgery. The following function was used: N = 1.962 × 100 × CSC × (100 − CSC)/(CSC − lower 95% CI)2. The number of operated persons (eyes) and the number of persons (eyes) requiring cataract surgery were calculated based on N and CSC at a specific level. For studies providing both raw data and CSC with 95% CI, the former was used in the meta-analysis.
2.4. Assessment of Risk and Bias
The methodological quality of the included studies was assessed using a risk and bias tool in prevalence studies [16]. It consists of ten items related to the representativeness of the sample, the sampling technique, risk of nonresponse bias, the data collection method, the case definition, the ascertainment toll, and the statistical method. Each item was scored 1 or 0 to represent a “low risk of bias” or “high risk of bias.” The total score ranged from 0 to 10 with 0–3 for high risk, 4–7 for moderate risk, and 7 and greater for low risk.
2.5. Data Synthesis and Statistical Analysis
Three methods were used to summarize the impact of the female gender on CSC. First, for each study, the respective CSC for males and females was used to calculate an OR using the formula OR = CSCmale × (100 − CSCfemale)/((100 − CSCmale) × CSCfemale) [11]. Then, the weighted average (mean) OR of these ORs was calculated based on sample sizes in each study. Second, a meta-analysis was performed using raw data to calculate the pooled ORs based on person (eyes) at a visual acuity of <3/60 and 6/18. Third, a pooled relative risk was calculated and used to estimate the blindness (visual acuity<3/60) population-attributable risk percentage (ARP) using the formula ARP = P × (RR − 1)/[P × (RR − 1) + 1], where P = proportion of female in adults population, estimated at 55% [11]. Statistic heterogeneity between studies was tested using Cochran's Q and I2 statistics, which was considered significant when P < 0.10 and/or I2 ≥ 50% [17]. A random effect model was used. Subgroup analysis was performed by study design and location type. Sensitivity analysis was also performed using single-study influence analysis. The potential publication bias was assessed using Begg's tests and Egger's test [18]. All analyses were performed using STATA version 12.0 (Stata Corp). A P value < 0.05 was considered significant, except where otherwise specified.
3. Results
3.1. Literature Search
Figure 1 shows the process of the study selection. After the title and abstract review, 53 potentially eligible studies underwent full-text review. Thirty-seven papers were excluded: 2 due to review design, 21 did not have CSC data, 12 had inadequate CSC data, and 2 had overlapping populations with included studies. Sixteen independent studies with a total of 135972 subjects were included in the final analysis [19–34].
Figure 1.
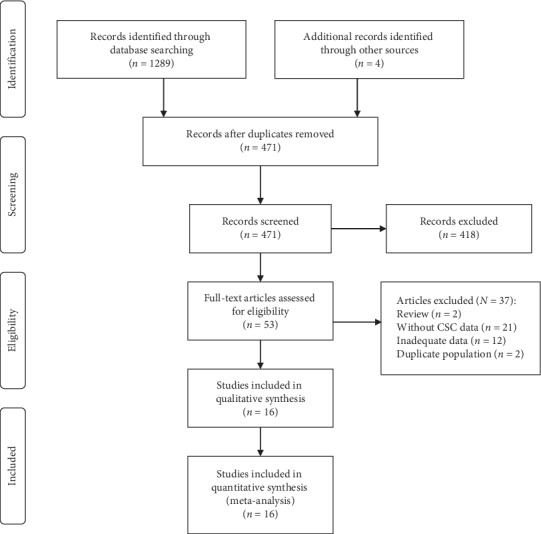
Diagram of study selection; CSC = cataract surgical coverage.
3.2. Study Characteristics
The characteristics of the included studies are presented in Table 1. Of which, 14 studies were published in peer-reviewed journals, while 2 were unpublished [32, 33]. One study was national, while others were regional. The number of examined people ranged from 1076 to 39908. Two studies were conducted in Bangladesh, one in Bhutan, four in India, five in Nepal, and four in Pakistan.
Table 1.
Characteristics of studies included in the meta-analysis.
| First author | Published year | Country | Design | Survey year | Location type | No. examined | Age group | Response rate (%) |
|---|---|---|---|---|---|---|---|---|
| Guruprasad et al. [19] | 2013 | India | PBCSS, RAAB | 2011 | Subnational, both | 2907 | ≥50 | 95.30 |
| Shaikh and Aziz [20] | 2005 | Pakistan | PBCSS, RAAB | 2003 | Subnational, rural | 1076 | ≥50 | 93.60 |
| Lepcha et al. [21] | 2013 | Bhutan | PBCSS, RAAB | 2009 | Subnational, both | 4046 | ≥50 | 98.70 |
| Thapa et al. [22] | 2011 | Nepal | PBCSS | After 2001 | Subnational, urban | 4003 | ≥40 | 83.39 |
| Sherchan et al. [23] | 2010 | Nepal | PBCSS | 2006 | Subnational, rural | 5138 | ≥50 | 86.80 |
| Sapkota et al. [24] | 2010 | Nepal | PBCSS, RAAB | 2006 | Subnational, rural | 4717 | ≥50 | 85.30 |
| Murthy et al. [25] | 2009 | India | PBCSS | 2007 | Subnational, both | 4738 | ≥50 | 91.90 |
| Jadoon et al. [26] | 2007 | Pakistan | PBCSS | 2002 | Subnational, both | 16570 | ≥30 | 95.50 |
| Anjum et al. [27] | 2006 | Pakistan | PBCSS, RAAB | 2004 | Subnational, rural | 1549 | ≥50 | 96.80 |
| Sapkota et al. [28] | 2006 | Nepal | PBCSS, RAAB | 2002 | Subnational, rural | 5002 | ≥45 | 85.30 |
| Wadud et al. [29] | 2006 | Bangladesh | PBCSS, RAAB | 2005 | Subnational, rural | 4868 | ≥50 | 91.90 |
| Haider et al. [30] | 2003 | Pakistan | PBCSS, RAAB | 2000 | Subnational, both | 1505 | ≥50 | 94.10 |
| Nirmalan et al. [31] | 2003 | India | PBCSS | 2000 | Subnational, both | 15265 | ≥50 | 92.30 |
| Khan and Jadoon [32] | 2015 | Pakistan | PBCSS, RAAB | 2015 | Subnational, urban | 3084 | ≥50 | 96.80 |
| Sapkota and Limburg [33] | 2012 | Nepal | PBCSS, RAAB | 2006–2010 | National | 39908 | ≥50 | 92.20 |
| Muhit et al. [34] | 2016 | Bangladesh | PBCSS, RAAB | 2010–2012 | Subnational, both | 21596 | ≥50 | 86.70 |
PBCSS: population-based cross-sectional study; RAAB: rapid assessment of avoidable blindness or rapid assessment of cataract surgical service.
3.3. Methodological Quality
All 16 studies were categorized as having a low bias (Table 2). Eight studies were conducted in single or multiple provinces (6 in rural and 2 in urban) and were not clear if it was representative of the national population. All studies reported the method of participant selection and the random sampling technique. The response rates in all studies were over 75.0% (median 92.25%).
Table 2.
Risk of bias of individual studies.
| First author | Published year | External validity | Internal validity | Summary item | ||||||||
|---|---|---|---|---|---|---|---|---|---|---|---|---|
| 1 | 2 | 3 | 4 | 5 | 6 | 7 | 8 | 9 | 10 | |||
| Guruprasad et al. [19] | 2013 | Yes | Yes | Yes | Yes | Yes | Yes | Yes | Yes | Yes | Yes | Low risk of bias |
| Shaikh and Aziz [20] | 2005 | No | Yes | Yes | Yes | Yes | Yes | Yes | Yes | Yes | Yes | Low risk of bias |
| Lepcha et al. [21] | 2013 | Yes | Yes | Yes | Yes | Yes | Yes | Yes | Yes | Yes | Yes | Low risk of bias |
| Thapa et al. [22] | 2011 | No | Yes | Yes | Yes | Yes | Yes | Yes | Yes | Yes | Yes | Low risk of bias |
| Sherchan et al. [23] | 2010 | No | Yes | Yes | Yes | Yes | Yes | Yes | Yes | Yes | Yes | Low risk of bias |
| Sapkota et al. [24] | 2010 | No | Yes | Yes | Yes | Yes | Yes | Yes | Yes | Yes | Yes | Low risk of bias |
| Murthy et al. [25] | 2009 | Yes | Yes | Yes | Yes | Yes | Yes | Yes | Yes | Yes | Yes | Low risk of bias |
| Jadoon et al. [26] | 2007 | Yes | Yes | Yes | Yes | Yes | Yes | Yes | Yes | Yes | Yes | Low risk of bias |
| Anjum et al. [27] | 2006 | No | Yes | Yes | Yes | Yes | Yes | Yes | Yes | Yes | Yes | Low risk of bias |
| Sapkota et al. [28] | 2006 | No | Yes | Yes | Yes | Yes | Yes | Yes | Yes | Yes | Yes | Low risk of bias |
| Wadud et al. [29] | 2006 | No | Yes | Yes | Yes | Yes | Yes | Yes | Yes | Yes | Yes | Low risk of bias |
| Haider et al. [30] | 2003 | Yes | Yes | Yes | Yes | Yes | Yes | Yes | Yes | Yes | Yes | Low risk of bias |
| Nirmalan et al. [31] | 2003 | Yes | Yes | Yes | Yes | Yes | Yes | Yes | Yes | Yes | Yes | Low risk of bias |
| Khan and Jadoon [32] | 2015 | No | Yes | Yes | Yes | Yes | Yes | Yes | Yes | Yes | Yes | Low risk of bias |
| Sapkota and Limburg [33] | 2012 | Yes | Yes | Yes | Yes | Yes | Yes | Yes | Yes | Yes | Yes | Low risk of bias |
| Muhit et al. [34] | 2016 | Yes | Yes | Yes | Yes | Yes | Yes | Yes | Yes | No | Yes | Low risk of bias |
1 = was the study's target population a close representation of the national population in relation to relevant variables? 2 = was the sampling frame a true or close representation of the target population? 3 = was some form of random selection used to select the sample, OR; was a census undertaken? 4 = was the likelihood of nonresponse bias minimal? 5 = were data collected directly from the subjects? 6 = was an acceptable case definition used in the study? 7 = was the study instrument that measured the parameter of interest shown to have reliability and validity? 8 = was the same mode of data collection used for all subjects? 9 = was the length of the shortest prevalence period for the parameter of interest appropriate? 10 = were the numerator and denominator for the parameter of interest appropriate?
3.4. Weighted Mean OR
Table 3 shows the CSC by sex based on persons or eyes at different visual acuity levels. For CSC based on persons at the blind level, the CSC values were higher in males than in females in all except three studies. For studies reporting CSC based on other levels, similar phenomena were observed. The weighted mean OR by sample size was 1.5, 1.1, 1.4, and 1.1 at different levels, respectively.
Table 3.
Cataract surgical coverage (CSC) in male and female at different visual acuity level.
| First author | Published year | CSC (person, VA <3/60) | CSC (person, VA <6/18) | CSC (eyes, VA <3/60) | CSC (eyes, VA <6/18) | ||||||||
|---|---|---|---|---|---|---|---|---|---|---|---|---|---|
| Male | Female | OR | Male | Female | OR | Male | Female | OR | Male | Female | OR | ||
| Guruprasad et al. [19] | 2013 | 84.6 | 79.7 | 1.4 | NA | NA | — | 72.1 | 67.8 | 1.2 | NA | NA | — |
| Shaikh and Aziz [20] | 2005 | NA | NA | — | NA | NA | — | 51.9 | 47.8 | 1.2 | NA | NA | — |
| Lepcha et al. [21] | 2013 | 77.8 | 67.7 | 1.7 | NA | NA | — | 61.5 | 51.3 | 1.5 | NA | NA | — |
| Thapa et al. [22] | 2011 | 85.3 | 93.9 | 0.4 | NA | NA | — | NA | NA | — | NA | NA | — |
| Sherchan et al. [23] | 2010 | 61.7 | 70.8 | 0.7 | NA | NA | — | NA | NA | — | NA | NA | — |
| Sapkota et al. [24] | 2010 | 39.3 | 35.8 | 1.2 | NA | NA | — | NA | NA | — | NA | NA | — |
| Murthy et al. [25] | 2009 | 75.5 | 69.7 | 1.3 | NA | NA | — | NA | NA | — | NA | NA | — |
| Jadoon et al. [26] | 2007 | 79.6 | 74.9 | 1.3 | 44.6 | 42.8 | 1.1 | 64.5 | 58.4 | 1.3 | 42.8 | 38.6 | 1.2 |
| Anjum et al. [27] | 2006 | 68.9 | 51.6 | 2.1 | NA | NA | — | 49.5 | 41.3 | 1.4 | NA | NA | — |
| Sapkota et al. [28] | 2006 | 68.1 | 52.6 | 1.9 | NA | NA | — | NA | NA | — | NA | NA | — |
| Wadud et al. [29] | 2006 | 63.5 | 59.0 | 1.2 | 34.5 | 36.4 | 0.9 | 34.6 | 34.9 | 1.0 | 17.4 | 18.7 | 0.9 |
| Haider et al. [30] | 2003 | 92.8 | 73.9 | 4.6 | 53.3 | 45.5 | 1.4 | 75.7 | 63.7 | 1.8 | 39.1 | 33.1 | 1.3 |
| Nirmalan et al. [31] | 2003 | 74.4 | 60.5 | 1.9 | NA | NA | — | 67.7 | 46.8 | 2.4 | NA | NA | — |
| Khan and Jadoon [32] | 2015 | 92.5 | 92.6 | 1.0 | 75.5 | 71.5 | 1.2 | 77.0 | 75.2 | 1.1 | 62.0 | 54.0 | 1.4 |
| Sapkota and Limburg [33] | 2012 | 87.6 | 82.9 | 1.5 | 55.7 | 53.5 | 1.1 | 68.9 | 65.7 | 1.2 | 40.0 | 38.8 | 1.1 |
| Muhit et al. [34] | 2016 | 76.6 | 64.3 | 1.8 | 35.1 | 30.5 | 1.2 | 61.5 | 49.7 | 1.6 | 20.1 | 21.3 | 0.9 |
| Overall weighted mean | 1.5 | 1.1 | 1.4 | 1.1 | |||||||||
OR, odds ratio; NA, not available; VA, visual acuity.
3.5. Meta-Analysis and PAR
Meta-analysis was used for 15 studies. The meta-analysis of CSC by sex on a person basis (visual acuity <3/60) showed a pooled OR of 1.46 (95% CI: 1.23–1.75) for males use of cataract surgery compared with females (Figure 2). The heterogeneity was significant (P < 0.001; I2 = 67.6%), and a random effect model was adopted. Results were similar for the meta-analysis of CSC by sex on a person basis at a visual acuity <6/18, with a pooled OR of 1.14 (95% CI: 1.05–1.24) with no significant heterogeneity among studies (P=0.349; I2 = 10.4%) (Figure 3). Regarding the CSC on an eye basis at visual acuity <3/60, the associations were statistically significant, with a pooled OR of 1.40 (95% CI: 1.16–1.70) (Figure 4). Only 5 studies were available for meta-analysis of CSC on an eye basis at visual acuity <6/18, and the pooled OR was not significant due to substantial heterogeneity among studies (Figure 5).
Figure 2.
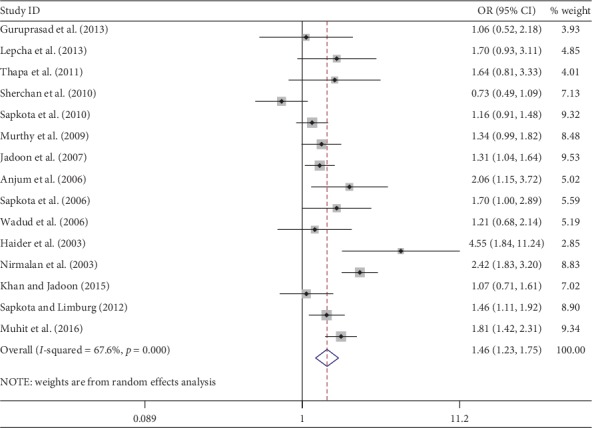
Forest plot showing the meta-analysis of CSC by sex on a person basis at visual <3/60 level. CSC = cataract surgical coverage; OR = odds ratio; CI = confidence interval.
Figure 3.
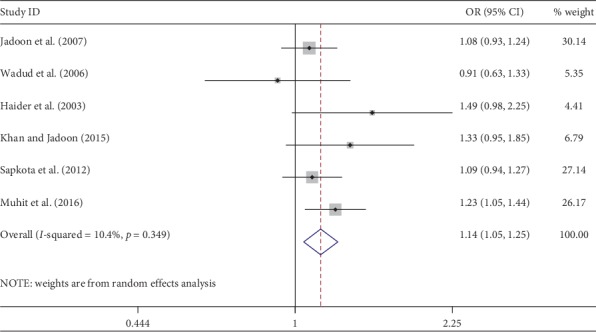
Forest plot showing the meta-analysis of CSC by sex on a person basis at visual <6/18 level. CSC = cataract surgical coverage; OR = odds ratio; CI = confidence interval.
Figure 4.
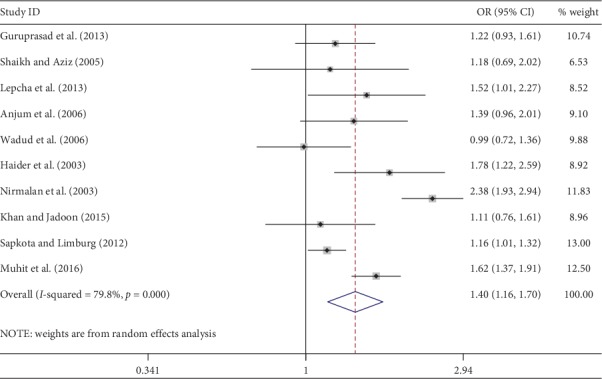
Forest plot showing the meta-analysis of CSC by sex on an eye basis at visual <3/60 level. CSC = cataract surgical coverage; OR = odds ratio; CI = confidence interval.
Figure 5.
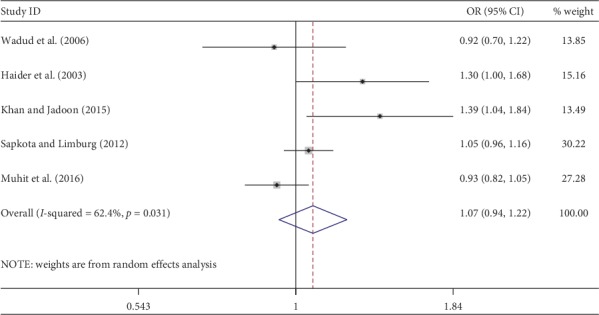
Forest plot showing the meta-analysis of CSC by sex on an eye basis at visual <6/18 level. CSC = cataract surgical coverage; OR = odds ratio; CI = confidence interval.
Subgroup analyses by design and location types produced similar results as the primary analyses (Figures 6–12). Further sensitivity analyses that omitted one study at a time and calculated the pooled ORs for the remaining studies yielded consistent results (Figures 13 and 14). There was no evidence of publication bias, as indicated by nonsignificant Begg's tests (P=0.488) and Egger's tests (P=0.173) in persons at VA <3/60. The values of ARP at a person and eye basis were 6.28% and 7.48%, respectively.
Figure 6.
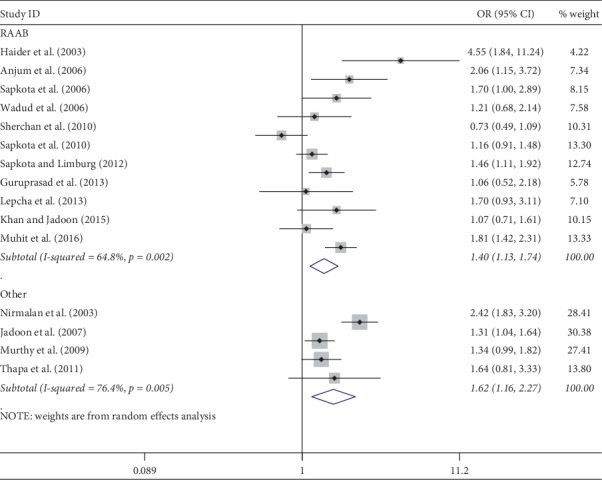
Subgroup analysis of CSC by design on a person basis at visual <3/60 level. CSC = cataract surgical coverage; OR = odds ratio; CI = confidence interval.
Figure 7.
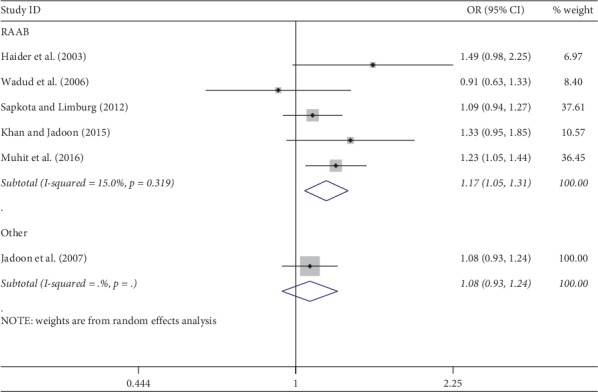
Subgroup analysis of CSC by design on a person basis at visual <6/18 level. CSC = cataract surgical coverage; OR = odds ratio; CI = confidence interval.
Figure 8.
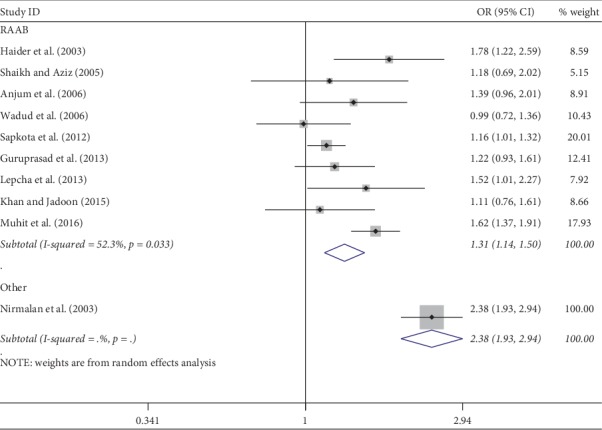
Subgroup analysis of CSC by design on an eye basis at visual <3/60 level. CSC = cataract surgical coverage; OR = odds ratio; CI = confidence interval.
Figure 9.
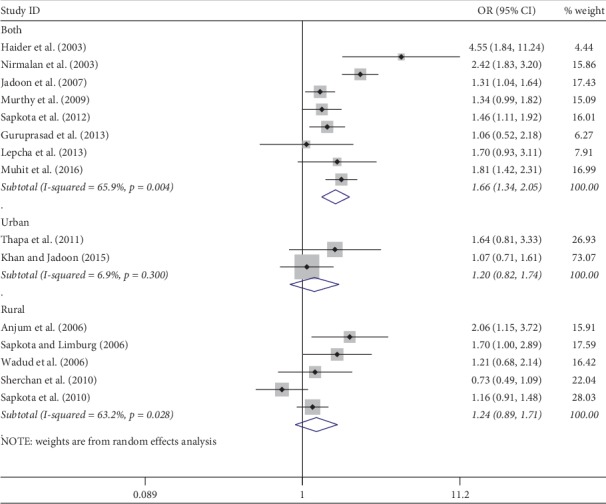
Subgroup analysis of CSC by location on a person basis at visual <3/60 level. CSC = cataract surgical coverage; OR = odds ratio; CI = confidence interval.
Figure 10.
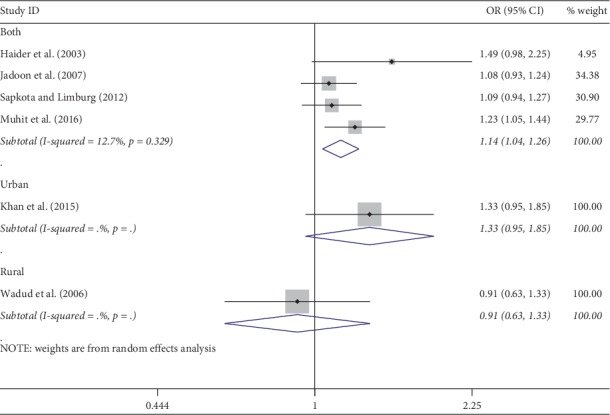
Subgroup analysis of CSC by location on a person basis at visual <6/18 level. CSC = cataract surgical coverage; OR = odds ratio; CI = confidence interval.
Figure 11.
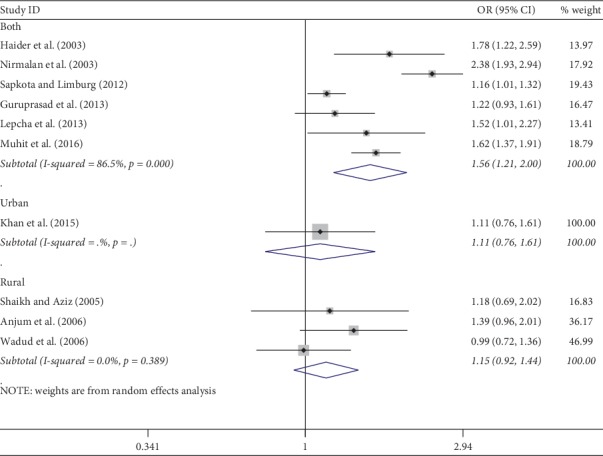
Subgroup analysis of CSC by location on an eye basis at visual <3/60 level. CSC = cataract surgical coverage; OR = odds ratio; CI = confidence interval.
Figure 12.
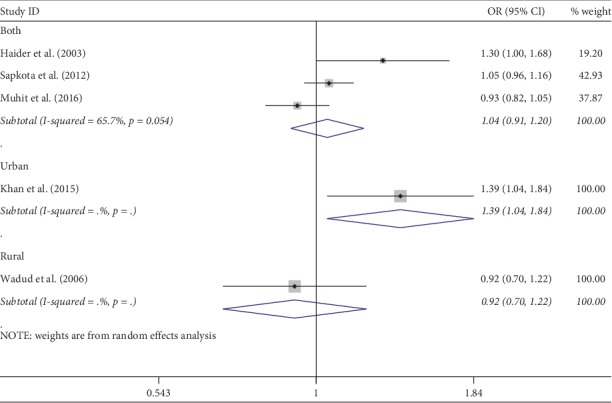
Subgroup analysis of CSC by location on an eye basis at visual <6/18 level. CSC = cataract surgical coverage; OR = odds ratio; CI = confidence interval.
Figure 13.
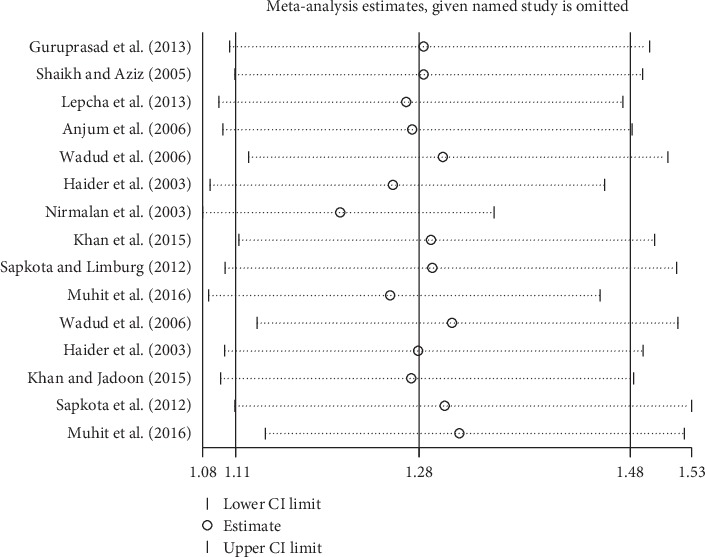
Sensitivity analysis of CSC on an eye. CSC = cataract surgical coverage; CI = confidence interval.
Figure 14.
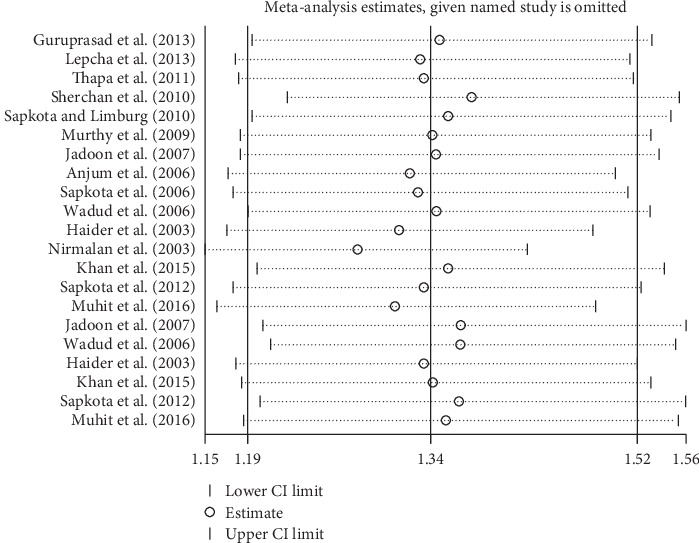
Sensitivity analysis of CSC on a person. CSC = cataract surgical coverage; CI = confidence interval.
4. Discussion
This study first provides a summary of gender inequity in CSC in South Asia with 16 eligible including 5 countries. Most studies were performed in subnational regions using the RAAB design. Our results demonstrated that the female gender remains a significant barrier to the access of cataract surgery in South Asia, with males having 1.46 odds of receiving cataract surgery compared to females per-person at blind VA. A very similar meta-analysis from India has been recently published in the British Journal of Ophthalmology. Prasad et al. reported that CSC was found to be 27% lower in women than men in India, and it could be improved by 13.4% in women if the gender gap in coverage is eliminated [35]. This is also supported by our findings, where women do not receive cataract surgery at the same rate as men do, and closing this gender gap may be a much-needed step.
Although gender inequity remains a significant problem in Nepal; however, it is not necessarily true for all programs. The pooled OR of CSC at blind VA was 1.09 (95% CI: 0.77–1.54) based on 5 studies in Nepal. Sherchan et al. reported that in the past 10 years, blindness prevalence, particularly due to cataract, has decreased and cataract surgical coverage has increased in the Lumbini Zone and Chitwan District. Cataract and other surgical services are equitably distributed by age and sex throughout all districts in the service area [23]. In another example in Nepal, Thapa et al. reported that the cataract surgical coverage was 90.36% and was high in females and illiterate subjects in Bhaktapur [22]. These are all indicators that cataract intervention programs have been successful in these areas.
Our study confirmed and extended previous efforts on the gender disparities in eye disease/service. In 2001, Abou-Gareeb et al. [10] reported that the prevalence of blindness was higher in females compared to males, which did not analyze the cataract blindness. In 2009, Lewallen et al. reported that the pooled OR of CSC was 1.71 (95%CI: 1.48–1.97) based on persons at visual acuity <6/60 [11]. However, these studies were limited by the inclusion of relatively outdated studies, with only a few studies from South Asia, and did not access raw data from their selected studies. Furthermore, the studies only used CSC person data at a visual acuity <6/60 with various methods. In Latin America, Cart et al. [15] reported that gender did not play a significant role in access to cataract surgery. Our results were consistent with the analyses by Lewallen et al. [11, 12]. The strength of this analysis lies in the inclusion of a large number of studies from 5 countries, use of raw data, multiple analyses at different levels, and use of data that reflect current situations with respect to cataract surgery programs and access. Furthermore, we observed progress in alleviating gender inequity. It was estimated that cataract blindness could have been reduced to a rate of 12.5% in 2000 and 10.8% in 2008 if the males and females had the same CSC rates [11, 12]. Our results suggest that this figure may have been reduced to 6.28% in South Asia, indicating persistent efforts aimed at reducing the gender gap in eye care access are warranted.
Possible explanations for the gender inequity in CSC are related to the social, economic, and cultural differences between males and females [12, 36]. The use of cataract surgical services was reported to be associated with the cost of cataract surgery and transportation, awareness of cataract surgery, and community-based education [37]. Females generally had higher illiteracy rates, especially amongst the elderly, reducing access to such information regarding treatment. It has been reported that the literacy of the affected person and their family members was a key predictor of receiving cataract surgery in South India [31]. Females may also have fewer financial resources to pay for eye care and transportation to hospitals compared to their male family counterparts. Various epidemiology studies confirmed the higher prevalence of cataract in females compared to males [10, 38]. The circumstances in South Asia are complex and may be related to work role, education, and economic decision-making power. Further research is needed to better understand these phenomena.
Our results have major implication in planning blindness prevention programs. Equal access to eye care could substantially reduce blindness in South Asian countries. For cataract programs, it was estimated that the proportion of cataract surgery performed in females should be 60%–65% to produce an equal CSC between genders [10]. Action should be taken to reduce the gender gap in CSC to achieve the blindness prevention target set out by the GAP. An anecdotal study in Pakistan showed that the following interventions can effectively address the barrier to cataract surgery: reducing surgical cost, flexibility of service time, reducing the need for accompanying family members, providing transport, and educational outreach [39]. As women have a higher incidence of cataract and longer life expectancy, a higher rate of cataract surgery in female populations should be emphasized in cataract programs. The female cataract surgery account for 59%–66% of all cataract surgery in developed countries such as France and Sweden [40, 41]. Therefore, strategies aimed at increasing eye care service utilization, especially access of cataract surgery by women, are warranted.
This study has several limitations. First, most of the included studies were not designed specifically to assess the gender inequity in access to cataract surgery. The risk and bias of these studies were not evaluated; however, as the majority was of the RAAB format using standardized methodologies and the results were considered to be reliable. Second, CSCs were calculated based on all operated eyes; however, those receiving the surgery may not necessarily have had visual impairment preoperatively. Nevertheless, our findings were robust as sensitivity analysis yielded virtually unchanged results. Third, most studies were performed in subnational areas, and for large countries such as India, substantial variations may exist across regions. Fourth, this study only included five countries in South Asia, including India, Pakistan, Nepal, Bangladesh, and Bhutan. Sri Lanka and Maldives were not included because relevant studies conducted in these two countries were fewer and they did not meet the inclusion criteria. Finally, the CSC does not take surgical quality into account. In a rural Southern Indian population, it was reported that 7.2% of blindness was iatrogenic and attributed to cataract surgery. Gender gaps in CSC and cataract surgical outcomes should be evaluated in further cataract program analyses.
5. Conclusions
In summary, the female gender remains a significant barrier to the access of cataract surgery in South Asia. We propose that once the female population achieves an equal CSC compared to males, the prevalence of cataract blindness can be reduced by around 6.28% in this region. Factors impeding females' access to cataract surgery should be taken into account when planning blindness prevention programs, and CSC targets should be relative to gender. More efforts are needed to increase the utilization of eye care services in South Asia, and especially the female population's access to cataract surgery.
Appendix
1. Search Strategy
“Cataract Extraction” [Mesh]
“Phacoemulsification” [Mesh]
“Lens Implantation, Intraocular” [Mesh]
“Phakic Intraocular Lenses” [Mesh]
Phacoemulsification [Title/Abstract]
“Extracapsular cataract extraction” [Title/Abstract]
“Manual small incision cataract surgery” [Title/Abstract]
Phaco [Title/Abstract] OR Phako [Title/Abstract]
ECCE [All Fields] OR MSICS [All Fields] OR SICS [All Fields]
Intraocular lens∗[All Fields] OR intraocular lens∗[All Fields] OR IOL∗[All Fields]
“cataract surgical coverage” [All Fields]
“cataract surgery coverage” [All Fields]
CSC [All Fields]
#1OR #2 OR #3 OR #4 OR #5 OR #6 OR #7OR #8 OR #9 OR #10 OR #11 OR #12 OR #13
“Sex Factors” [Mesh]
Gender [All Fields]
Female [All Fields]
Sex [All Fields]
#15 OR #16 OR #17 OR #18
“Epidemiology” [Mesh]
“Cross-Sectional Studies” [Mesh]
Epidemiology [All Fields]
“population-based study” [All Fields]
#20 OR #21 OR #22 OR #23
South Asia [All Fields]
India [All Fields] OR Pakistan [All Fields] OR Bangladesh [All Fields] OR Maldives [All Fields] OR Sri Lanka [All Fields] OR Bhutan [All Fields] OR Nepal [All Fields]
#25 OR #26
#14 AND #19 AND #24 AND #27
Conflicts of Interest
The authors declare that there are no conflicts of interest.
Authors' Contributions
WW and BQ conceptualised the study. WW, YC, and QY were involved in methodology. QY and CT performed literature search. YC and JZ conducted study evaluation and selection. QY and CT performed raw data extraction. WW and YC performed data analysis. WW provided statistical advice. BQ was involved in supervision and validation. QY and YC wrote the first draft. WW, WY, and YC were involved in writing, reviewing, and editing.
References
- 1.Pascolini D., Mariotti S. P. Global estimates of visual impairment: 2010. British Journal of Ophthalmology. 2012;96(5):614–618. doi: 10.1136/bjophthalmol-2011-300539. [DOI] [PubMed] [Google Scholar]
- 2.Stevens G. A., White R. A., Flaxman S. R., et al. Global prevalence of vision impairment and blindness. Ophthalmology. 2013;120(12):2377–2384. doi: 10.1016/j.ophtha.2013.05.025. [DOI] [PubMed] [Google Scholar]
- 3.Jonas J. B., George R., Asokan R., et al. Prevalence and causes of vision loss in central and South Asia: 1990–2010. British Journal of Ophthalmology. 2014;98(5):592–598. doi: 10.1136/bjophthalmol-2013-303998. [DOI] [PubMed] [Google Scholar]
- 4.Essue B. M., Li Q., Hackett M. L., et al. A multicenter prospective cohort study of quality of life and economic outcomes after cataract surgery in vietnam. Ophthalmology. 2014;121(11):2138–2146. doi: 10.1016/j.ophtha.2014.05.014. [DOI] [PubMed] [Google Scholar]
- 5.Finger R. P., Kupitz D. G., Fenwick E., et al. The impact of successful cataract surgery on quality of life, household income and social status in South India. PLoS One. 2012;7(8) doi: 10.1371/journal.pone.0044268.e44268 [DOI] [PMC free article] [PubMed] [Google Scholar]
- 6.Polack S., Eusebio C., Mathenge W., et al. The impact of cataract surgery on health related quality of life in Kenya, the Philippines, and Bangladesh. Ophthalmic Epidemiology. 2010;17(6):387–399. doi: 10.3109/09286586.2010.528136. [DOI] [PubMed] [Google Scholar]
- 7.Polack S., Eusebio C., Mathenge W., et al. The impact of cataract surgery on activities and time-use: results from a longitudinal study in Kenya, Bangladesh and the Philippines. PLoS One. 2010;5(6) doi: 10.1371/journal.pone.0010913.e10913 [DOI] [PMC free article] [PubMed] [Google Scholar]
- 8.Brown M. M., Brown G. C., Lieske H. B., Lieske P. A. Financial return-on-investment of ophthalmic interventions. Current Opinion in Ophthalmology. 2014;25(3):171–176. doi: 10.1097/icu.0000000000000040. [DOI] [PubMed] [Google Scholar]
- 9.Brown G. C., Brown M. M., Menezes A., Busbee B. G., Lieske H. B., Lieske P. A. Cataract surgery cost utility revisited in 2012. Ophthalmology. 2013;120(12):2367–2376. doi: 10.1016/j.ophtha.2013.04.030. [DOI] [PubMed] [Google Scholar]
- 10.Abou-Gareeb I., Lewallen S., Bassett K., Courtright P. Gender and blindness: a meta-analysis of population-based prevalence surveys. Ophthalmic Epidemiology. 2001;8(1):39–56. doi: 10.1076/opep.8.1.39.1540. [DOI] [PubMed] [Google Scholar]
- 11.Lewallen S., Mousa A., Bassett K., Courtright P. Cataract surgical coverage remains lower in women. British Journal of Ophthalmology. 2009;93(3):295–298. doi: 10.1136/bjo.2008.140301. [DOI] [PubMed] [Google Scholar]
- 12.Lewallen S., Courtright P. Gender and use of cataract surgical services in developing countries. Bulletin of the World Health Organization. 2002;80(80):300–303. [PMC free article] [PubMed] [Google Scholar]
- 13.Shamseer L., Moher D., Clarke M., et al. Preferred reporting items for systematic review and meta-analysis protocols (PRISMA-P) 2015: elaboration and explanation. BMJ. 2015;349(1):p. 7647. doi: 10.1136/bmj.g7647. [DOI] [PubMed] [Google Scholar]
- 14.Stroup D. F. Meta-analysis of observational studies in epidemiology. JAMA. 2000;283(15):2008–2012. doi: 10.1001/jama.283.15.2008. [DOI] [PubMed] [Google Scholar]
- 15.Carter M. J., Limburg H., Lansingh V. C., Silva J. C., Resnikoff S. Do gender inequities exist in cataract surgical coverage? Meta-analysis in Latin America. Clinical & Experimental Ophthalmology. 2012;40(5):458–466. doi: 10.1111/j.1442-9071.2011.02722.x. [DOI] [PubMed] [Google Scholar]
- 16.Hoy D., Brooks P., Woolf A., et al. Assessing risk of bias in prevalence studies: modification of an existing tool and evidence of interrater agreement. British Journal of Ophthalmology. 2012;65(9):934–849. doi: 10.1016/j.jclinepi.2011.11.014. [DOI] [PubMed] [Google Scholar]
- 17.Higgins J. P., Green S. Cochrane Handbook for Systematic Reviews of Interventions. London, UK: The Cochrane Collaboration; 2011. [Google Scholar]
- 18.Egger M., Davey S. G., Schneider M. Bias in meta-analysis detected by a simple, graphical test. BMJ. 1997;315(7109):629–634. doi: 10.1136/bmj.315.7109.629. [DOI] [PMC free article] [PubMed] [Google Scholar]
- 19.Guruprasad B. S., Krishnamurthy D., Narendra D. P., et al. Changing scenario of cataract blindness in Kolar District, Karnataka, South India. The utility of rapid assessment of avoidable blindness in reviewing programs. Ophthalmic Epidemiology. 2013;20(2):89–95. doi: 10.3109/09286586.2012.759597. [DOI] [PubMed] [Google Scholar]
- 20.Shaikh S. P., Aziz T. M. Rapid assessment of cataract surgical services in age group 50 years and above in Lower Dir district Malakand, Pakistan. JCPSP. 2005;15(3):145–148. [PubMed] [Google Scholar]
- 21.Lepcha N. T., Chettri C. K., Getshen K., et al. Rapid assessment of avoidable blindness in Bhutan. Ophthalmic Epidemiol. 2013;20(4):212–219. doi: 10.3109/09286586.2013.794902. [DOI] [PubMed] [Google Scholar]
- 22.Thapa S. S., Berg R. V., Khanal S., et al. Prevalence of visual impairment, cataract surgery and awareness of cataract and glaucoma in Bhaktapur district of Nepal: the Bhaktapur Glaucoma Study. BMC Ophthalmology. 2011;11:2–118. doi: 10.1186/1471-2415-11-2. [DOI] [PMC free article] [PubMed] [Google Scholar]
- 23.Sherchan A., Kandel R. P., Sharma M. K., et al. Blindness prevalence and cataract surgical coverage in Lumbini Zone and chetwan district of Nepal. British Journal of Ophthalmology. 2010;94(2):161–166. doi: 10.1136/bjo.2008.155408. [DOI] [PubMed] [Google Scholar]
- 24.Sapkota Y. D., Sunuwar M., Naito T., et al. The prevalence of blindness and cataract surgery in rautahat district, Nepal. Ophthalmic Epidemiology. 2010;17(2):82–89. doi: 10.3109/09286581003624947. [DOI] [PubMed] [Google Scholar]
- 25.Murthy G. V., Vashist P., John N., et al. Prevalence and vision-related outcomes of cataract surgery in Gujarat, India. Ophthalmic Epidemiology. 2009;16(6):400–409. doi: 10.3109/09286580903315809. [DOI] [PMC free article] [PubMed] [Google Scholar]
- 26.Jadoon Z., Shah S.P., Bourne R., et al. Cataract prevalence, cataract surgical coverage and barriers to uptake of cataract surgical services in Pakistan: the Pakistan National Blindness and Visual Impairment Survey. British Journal of Ophthalmology. 2007;91(10):1269–1273. doi: 10.1136/bjo.2006.106914. [DOI] [PMC free article] [PubMed] [Google Scholar]
- 27.Anjum K. M., Qureshi M. B., Khan M. A., et al. Cataract blindness and visual outcome of cataract surgery in a tribal area in Pakistan. British Journal of Ophthalmology. 2006;90(2):135–138. doi: 10.1136/bjo.2005.078527. [DOI] [PMC free article] [PubMed] [Google Scholar]
- 28.Sapkota Y. D., Pokharel G. P., Nirmalan P. K., et al. Prevalence of blindness and cataract surgery in Gandaki Zone, Nepal. British Journal of Ophthalmology. 2006;90(4):411–416. doi: 10.1136/bjo.2005.082503. [DOI] [PMC free article] [PubMed] [Google Scholar]
- 29.Wadud Z., Kuper H., Polack S., et al. Rapid assessment of avoidable blindness and needs assessment of cataract surgical services in Satkhira District, Bangladesh. British Journal of Ophthalmology. 2006;90(10):1225–1229. doi: 10.1136/bjo.2006.101287. [DOI] [PMC free article] [PubMed] [Google Scholar]
- 30.Haider S., Hussain A., Limburg H. Cataract blindness in chakwal district, Pakistan: results of a survey. Ophthalmic Epidemiology. 2003;10(4):249–258. doi: 10.1076/opep.10.4.249.15907. [DOI] [PubMed] [Google Scholar]
- 31.Nirmalan P. K., Padmavathi A., Thulasiraj R. D. Sex inequalities in cataract blindness burden and surgical services in south India. British Journal of Ophthalmology. 2003;87(7):847–849. doi: 10.1136/bjo.87.7.847. [DOI] [PMC free article] [PubMed] [Google Scholar]
- 32.Khan M., Jadoon M. RAAB repository: peshawar district of Pakistan. 2015. https://s3-eu-west-1.amazonaws.com/raabdata/PK_KhyberP_Peshawar_2014_RPTS_9s76g29jFK.zip.
- 33.Sapkota Y. D., Limburg H. Epidemiology of blindness, Nepal. 2012. http://www.iapb.org/sites/iapb.org/files/Epidemiology%20of%20Blindness,%20Nepal.pdf.
- 34.Muhit M., Wadud Z., Islam J., et al. Generating evidence for program planning: rapid assessment of avoidable blindness in Bangladesh. Ophthalmic Epidemiology. 2016;23(3):176–184. doi: 10.3109/09286586.2016.1155716. [DOI] [PubMed] [Google Scholar]
- 35.Prasad M., Malhotra S., Kalaivani M., et al. Gender differences in blindness, cataract blindness and cataract surgical coverage in India. British Journal of Ophthalmology. 2019;2018:313562. doi: 10.1136/bjophthalmol-2018-313562. [DOI] [PubMed] [Google Scholar]
- 36.Joseph S., Ravilla T., Bassett K., et al. Gender issues in a cataract surgical population in South India. Ophthalmic Epidemiology. 2013;20(2):96–101. doi: 10.3109/09286586.2013.766756. [DOI] [PubMed] [Google Scholar]
- 37.Finger R. P. Cataracts in India: current situation, access, and barriers to services over time. Ophthalmic Epidemiology. 2007;14(3):112–118. doi: 10.1080/09286580601114967. [DOI] [PubMed] [Google Scholar]
- 38.Pradhan S. Prevalence of blindness and cataract surgical coverage in Narayani Zone, Nepal: a rapid assessment of avoidable blindness (RAAB) study. British Journal of Ophthalmology. 2017;10:1–4. doi: 10.1136/bjophthalmol-2017-310716. [DOI] [PubMed] [Google Scholar]
- 39.Haider S., Hussain A. Gender and use of cataract surgical services: experiences from munawwar memorial hospital in district chakwal, Pakistan. Community Eye Health. 2004;17(49):p. 14. [PMC free article] [PubMed] [Google Scholar]
- 40.Daien V., Le Pape A., Heve D., Carriere I., Villain M. Incidence and characteristics of cataract surgery in France from 2009 to 2012. Ophthalmology. 2015;122(8):1633–1638. doi: 10.1016/j.ophtha.2015.04.017. [DOI] [PubMed] [Google Scholar]
- 41.Behndig A., Montan P., Stenevi U., Kugelberg M., Lundström M. One million cataract surgeries: Swedish national cataract register 1992–2009. Journal of Cataract & Refractive Surgery. 2011;37(8):1539–1545. doi: 10.1016/j.jcrs.2011.05.021. [DOI] [PubMed] [Google Scholar]


