

Abstract
Rationale:
Macrophages are essential regulators of atherosclerosis. They secrete cytokines, process lipoproteins and cholesterol, and take up apoptotic cells. Multiple subsets of plaque macrophages exist and their differential roles are emerging.
Objective:
Here, we explore macrophage heterogeneity in atherosclerosis plaques using transgenic fluorescent mice in which subsets of macrophages are labeled by GFP, YFP, neither or both. The objective was to define migration patterns of the visible subsets and relate them to their phenotypes and transcriptomes.
Methods and Results:
Apoe−/− Cx3cr1GFP Cd11cYFP mice have 4 labeled groups of macrophages in their aortas. The visible subsets show varying movement characteristics. GFP and GFP+YFP+ macrophages extend and retract dendritic processes, dancing on the spot with little net movement while YFP macrophages have a more rounded shape and migrate along the arteries. RNA sequencing of sorted cells revealed significant differences in the gene expression patterns of the 4 subsets defined by GFP and YFP expression, especially concerning chemokine and cytokine expression, matrix remodeling, and cell shape dynamics. Gene set enrichment analysis showed that GFP+ cells have similar transcriptomes to cells found in arteries with tertiary lymphoid organs and regressing plaques while YFP+ cells were associated progressing and stable plaques.
Conclusions:
The combination of quantitative intravital imaging with deep transcriptomes identified four subsets of vascular macrophages in atherosclerosis that have unique transcriptomic profiles. Our data are the first to link vascular macrophage transcriptomes to their in vivo migratory function. Future work on the functional significance of the change in gene expression and motility characteristics will be needed to fully understand how these subsets contribute to disease progression.
Keywords: Macrophage, atherosclerosis, transcriptome, intravital imaging, two-photon microscopy
Subject Terms: Atherosclerosis
Graphical Abstract
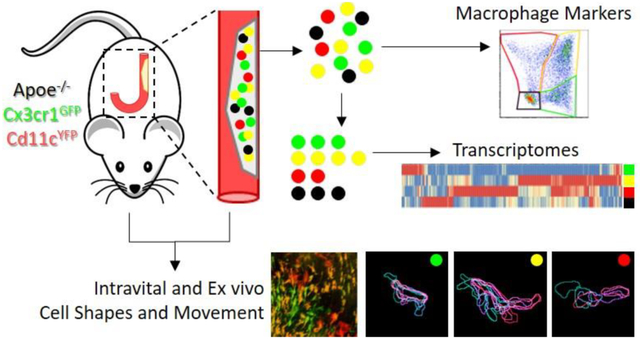
Macrophages within atherosclerotic plaques demonstrate a variety of pro- and anti-inflammatory functions, including cholesterol uptake, clearance of apoptotic cells, and communication with other immune cells through the secretion of cytokines and chemokines. It is known that atherosclerotic macrophages are highly heterogeneous, and recently at least 10 different subsets have been described based on their transcriptomes. Here, we utilize a fluorescent reporter mouse in which four different subsets can be delineated based on their expression of GFP and YFP. The fluorescent markers enable characterizing the subsets by functional assays, including flow cytometry and microscopy, along with cell sorting for deep RNA sequencing. Using intravital two-photon microscopy of the atherosclerotic carotid arteries, we visualized differences in shape and movement characteristics between the visible subsets. Furthermore, these four subsets show variations in their expression of genes in pathways involved in cell migration, inflammation, and extracellular matrix remodeling, as well as in their relationships to published macrophage subset transcriptomes. Our data are the first to link vascular macrophage transcriptomes to in vivo migratory function.
INTRODUCTION
Macrophages are ubiquitous tissue-resident cells. In mice, most tissues are seeded with macrophages derived from embryonic progenitor cells1. Their phenotype is strongly influenced by their ontogeny, their tissue of residence2 and the inflammatory status3. At steady state, vascular macrophages are mainly derived from CX3CR1+ embryonic precursor cells with little contribution from blood monocytes4. During atherosclerosis, blood monocytes infiltrate arterial lesions and vascular macrophages also proliferate locally. In early lesions, monocyte recruitment accounts for 70% of new macrophages, but in mature lesions, local proliferation predominates (~90%)5. Furthermore, mouse atherosclerotic lesions contain foam cells derived from smooth muscle cells6 and macrophages7. All these cells are regulators of atherosclerotic disease progression and control the size and content of atherosclerotic plaques by taking up lipoproteins, secreting pro- and anti-inflammatory cytokines, recruiting innate and adaptive leukocytes, and clearing apoptotic cells8.
Macrophages in atherosclerotic mouse arteries are highly heterogeneous. This is evident even at the flow cytometry level using surface markers like CD11b, CX3CR1, MHCII, CD11c, F4/80, and CD649,10. Moreover, single cell RNA sequencing (scRNA-Seq) has identified multiple macrophage subsets within plaques based on gene expression11–13. Cochain et al. identified inflammatory macrophages, resident-like macrophages, and Trem2-hi macrophages as well as a population of monocyte-derived dendritic cells (DCs) in Ldlr−/− mice fed a high fat diet (HFD)11. Inflammatory macrophages expressed pro-atherogenic genes, but also some inhibitors of macrophage activation. Resident-like macrophages shared some genes with vascular macrophages in healthy mice and M2-like macrophages. Trem2-hi macrophages may have a specialized role in atherosclerotic lesion calcification.
Lin et al. used scRNA-Seq to profile CD11b+ cells derived from CX3CR1+ monocytes in progressing and regressing plaques in Cx3cr1CreERT2-IRES-YFP/+Rosa26fl-tdTomato/+ mice, which allows fate-mapping of cells expressing Cx3cr1 at the time of a tamoxifen injection13. Atherosclerosis was initiated by injection of a viral vector to lower LDLR while feeding Western Diet (WD); regression was initiated by using an antisense oligonucleotide to lower ApoB and switching to chow diet. 11 clusters of Cx3cr1+ macrophages were described, 3 of which share characteristics with the subsets described by Cochain, et al. Lin et al. found a spectrum of macrophage activation states, both pro- and anti-inflammatory. Progressing plaques are more heterogeneous than regressing plaques.
Kim, et al. used scRNAseq to characterize all leukocytes isolated from arteries of HFD-fed Ldlr−/− mice14. They found 8 clusters of macrophages with distinct differentially expressed genes and cell functions. They further contrasted the transcriptomes of foamy macrophages, which pick up the lipid tracer BODIPY, from non-foamy macrophages and found that foamy macrophages showed decreased expression of inflammation-related genes with increased expression of cholesterol-handling related genes.
Our group previously combined mass cytometry (CyTOF) and scRNA-Seq to study vascular leukocytes in Apoe−/−15 mice on chow diet or WD12. The macrophage population was enriched for iNos signaling and interferon regulatory factor activation, and their gene signature was enriched for genes associated with ruptured plaques. CyTOF revealed four macrophage clusters.
Taken together, previous work identified many macrophage subsets in atherosclerotic aortas using Ldlr−/−, Apoe−/−, and experimentally-induced atherosclerosis models. Although some functions were inferred from gene ontology and pathway analysis, both scRNA-Seq and CyTOF require cell sorting by flow cytometry; thus, information on the cell shape, location, and movement is lost. Also, scRNA-Seq transcriptomes are relatively shallow, with an average of 140012 – 240014 genes detected per cell. Furthermore, no surface markers are known that could be used to sort the macrophage subsets.
Here, we used fluorescent reporter mice to investigate macrophage subsets in atherosclerotic lesions. Using fluorescence to identify the subsets enables a wider variety of functional assays including intravital microscopy to assess shapes, sizes, movements and migration in the live atherosclerotic artery wall in vivo. Sorting the subsets based on GFP, knocked into the Cx3cr1 allele16; YFP, driven by the CD11c promoter17; both; or neither enabled deep sequencing with RNA-seq to further probe the phenotype of these cell.
METHODS
Data availability.
All custom image processing algorithms, including those for dynamic color gradient thresholding, centroid-adjusted dancing, and GFP-YFP bleedthrough correction, have been made publicly available and can be accessed on GitHub (https://github.com/saramcardle/Image-Analysis-Scripts). The raw sequencing data for the 18 bulk RNAseq samples passing QC inspection are available on the NCBI Gene Expression Omnibus repository (GSE137819, https://www.ncbi.nlm.nih.gov/geo/query/acc.cgi?acc=GSE137819). All other data and methods used in the analysis, and materials used to conduct the research will be made available to any researcher for the purpose of reproducing the results or replicating the procedures. All data, methods, materials are available upon personal request at the La Jolla Institute for Immunology, CA, USA (contact: kley@lji.org).
Mice.
Apoe−/−, Cd11cYFP, and Cx3cr1GFP mice were bred to each other to create the Cx3cr1GFP/+ Cd11cYFP Apoe−/− strain used in this study. Mice were kept in specific pathogen-free conditions in an AAALAC-approved barrier facility, and all experiments were performed in accordance with IACUC standards. All mice were fed WD starting at 6 to 8 weeks of age, continuing for up to 5 months.
Flow cytometry and fluorescence-activated cell sorting.
For cell surface marker analysis, aortas were taken from male and female Cx3cr1GFP/+ Cd11cYFP Apoe−/− mice that had been fed WD for 5 months. The tissue was enzymatically digested49 and single cell suspensions were stained for CD45, CD64, CD11b, CD103, CD11c, F4/80, MHCII, and 7AAD. Gates were determined by fluorescence-minus-one controls. All analysis was performed in FlowJo (Tree Star).
For sorting arterial leukocytes for RNA sequencing, aortas and carotid arteries were taken from male and female Cx3cr1GFP/+ Cd11cYFP Apoe−/− mice that had been fed WD for 5 months. 25 mice were used total and all arteries (both carotids and aortas) were pooled into 7 batches of 3–4 mice for digestion and sorting. Cells were gated for live CD45+ singlet cells, and then sorted into GFP, DP, YFP, and DN populations into Trizol LS using a FACSAria II.
Bulk RNA sequencing and analysis.
RNA was extracted from the sorted GFP, DP, YFP, and DN cells using an RNeasy Mini Kit (Qiagen). At this stage, two sets of samples were combined because too few cells had been sorted. Samples were sequenced with Single Read 50 base pair reads on an Illumina HiSeq4000. Mapping was performed to the mm10 mouse genome. Post-mapping quality control checks were used to exclude poor quality samples. 6 out of 24 samples were removed due to having uneven gene body coverage, higher AT content, and more reads mapped outside of exons. The remaining 18 samples were used for all subsequent analysis.
Only genes with a raw read count >7 in at least one sample were used. Differential expression was calculated between all pairs of samples (6 total tests) using DESeq228. Genes were filtered for those that had a Benjamini-Hochberg adjusted p<0.05 and a log fold change ≥2 in at least one comparison. 892 genes passed these criteria and were called differentially expressed. Genes that were differentially upregulated by more than one group based on these criteria were assigned to the group with the highest expression based on log fold change (or the reverse, for downregulated genes). Morpheus (Broad Institute) was used to generate all heat maps and hierarchical clustering. GSEA33 was performed with GenePattern50 (Broad Institute), using standard settings, except with a minimum set size of 10 and gene-based permutations. Enriched and activated pathways were calculated in Ingenuity Pathway Analysis (Qiagen)51 using default settings.
Single Cell RNA sequencing.
Raw data for the single cell RNAseq was taken from previously work, and the methods have been described12. Briefly, aortas from 10 Apoe−/− mice fed WD for 12 weeks were enzymatically digested. 2077 live aortic leukocytes from the pooled cells were successfully encapsulated with the 10xGenomics platform and single cell transcriptomes were obtained. Cells expressing both Adgre and Cd68 were selected as macrophages with the SeqGeq genomic gating tool (Tree Star Software). t-SNE dimensionality reduction followed by k-means clustering was used to cluster the cells into 4 populations.
Imaging.
Cx3cr1GFP/+ Cd11cYFP Apoe−/− mice fed WD were used for all imaging experiments. For whole mount imaging, an aorta was fixed with 4% paraformaldehyde and stained with Hoechst. The tissue was imaged with a Leica SP5 multiphoton microscope using 920 nm excitation and 3 detection channels.
Ex vivo imaging of live cells in the aorta was performed similarly to previous work22, but was performed on a Leica SP8 with HyD GaAsP detectors. The explanted aorta was kept in a dish with heated, oxygenated, circulating RPMI during imaging.
ILTIS25 intravital imaging utilized the same optical set-up, though the blue channel was used to detect collagen via second harmonic generation. Briefly, after mice were anesthetized, the right carotid artery was gently surgically exposed and kept wet with heated phenol-free RPMI. A pulse-oximeter was used to trigger image acquisition during approximate diastole of each heartbeat. Stacks of 25–40 z steps (3–5 μm apart) were acquired every 30–50 seconds. Post processing to remove motion artifacts has been described previously25. Briefly, images at each location and timepoint with high similarity were selected then Mistica minimum spanning tree-based course image alignment52 registered the images to create the final 3-dimensional movies.
Image analysis.
For the qualitative evaluation of cell motion, maximum intensity projections of the intravital movies were generated and the GFP and YFP channels were assigned random pseudocolors. The movies were given to blinded judge unfamiliar with the work who was asked to categorize each cell as “dancing”, “migrating”, or not moving. Monocytes (small, round cells, moving in a single direction due to blood flow) were skipped. Only healthy cells showing some discernible movement were used for the statistics.
To segment the macrophages in the intravital movies, we adapted dynamic color gradient thresholding27 to create a novel 3D segmentation algorithm. Initial surfaces were generated in Matlab based on intensity and texture in both the GFP and YFP channels simultaneously. Manual correction of cell boundaries and semi-automatic tracking was performed in Imaris (Bitplane). The final cell tracks were transferred back to Matlab for further quantification.
“Centroid-adjusted Dancing” is a novel measure of how much a cell’s shape changes between two timepoints. After aligning cells so that their centroids are colocalized, “dancing” is a measure of how much the cell boundaries change, calculated as the number of voxels that do not overlap divided by the total number of voxels occupied in either timepoint.
Alternatively, the images of aorta explants acquired on the SP8 were processed using a pixel classification tool (iLastik23), trained to recognize cells or background. The probability maps and raw channel intensities were imported into Matlab to calculate shape statistics.
RESULTS
Single cell RNA-seq was used to gain initial insights into atherosclerotic plaque macrophage heterogeneity. scRNAseq of aortic leukocytes from Apoe−/− mice fed WD for 12 weeks using the 10x Genomics platform12 identified 195 macrophages based on genomic gating for the two macrophage marker genes Cd68 and Adgre1, which encodes F4/80 (Fig. 1A). After filtering for variable genes, dimensionality reduction by tSNE and automatic k-means clustering18, four macrophage clusters emerged (Fig. 1B) that had significant differential gene expression (Fig. 1C, Online Table I). Itgax, which encodes CD11c, was highly expressed in clusters 3 and 4 while the chemokine receptor Cx3cr1 was highly expressed in clusters 1 and 4 (Fig. 1D). Cell-cell heterogeneity within each group is visible in a freely clustered heat map of the top 35 genes (Fig. 1E). To explore biological functions of the four macrophage subsets, we subjected the data to Ingenuity Pathway Analysis (IPA, Fig. 1F). Cluster 1 was enriched for inflammation and transcription, cluster 2 for apoptosis, cluster 3 for proliferation, survival, and motility and cluster 4 for inflammation, phagocytosis, and motility (Fig. 1F). Representative genes driving the inflammation, apoptosis, proliferation, phagocytosis, and motility signatures are shown as heatmaps in Fig. 1G.
Figure 1: Single Cell RNAseq of macrophages in the atherosclerotic aorta12.
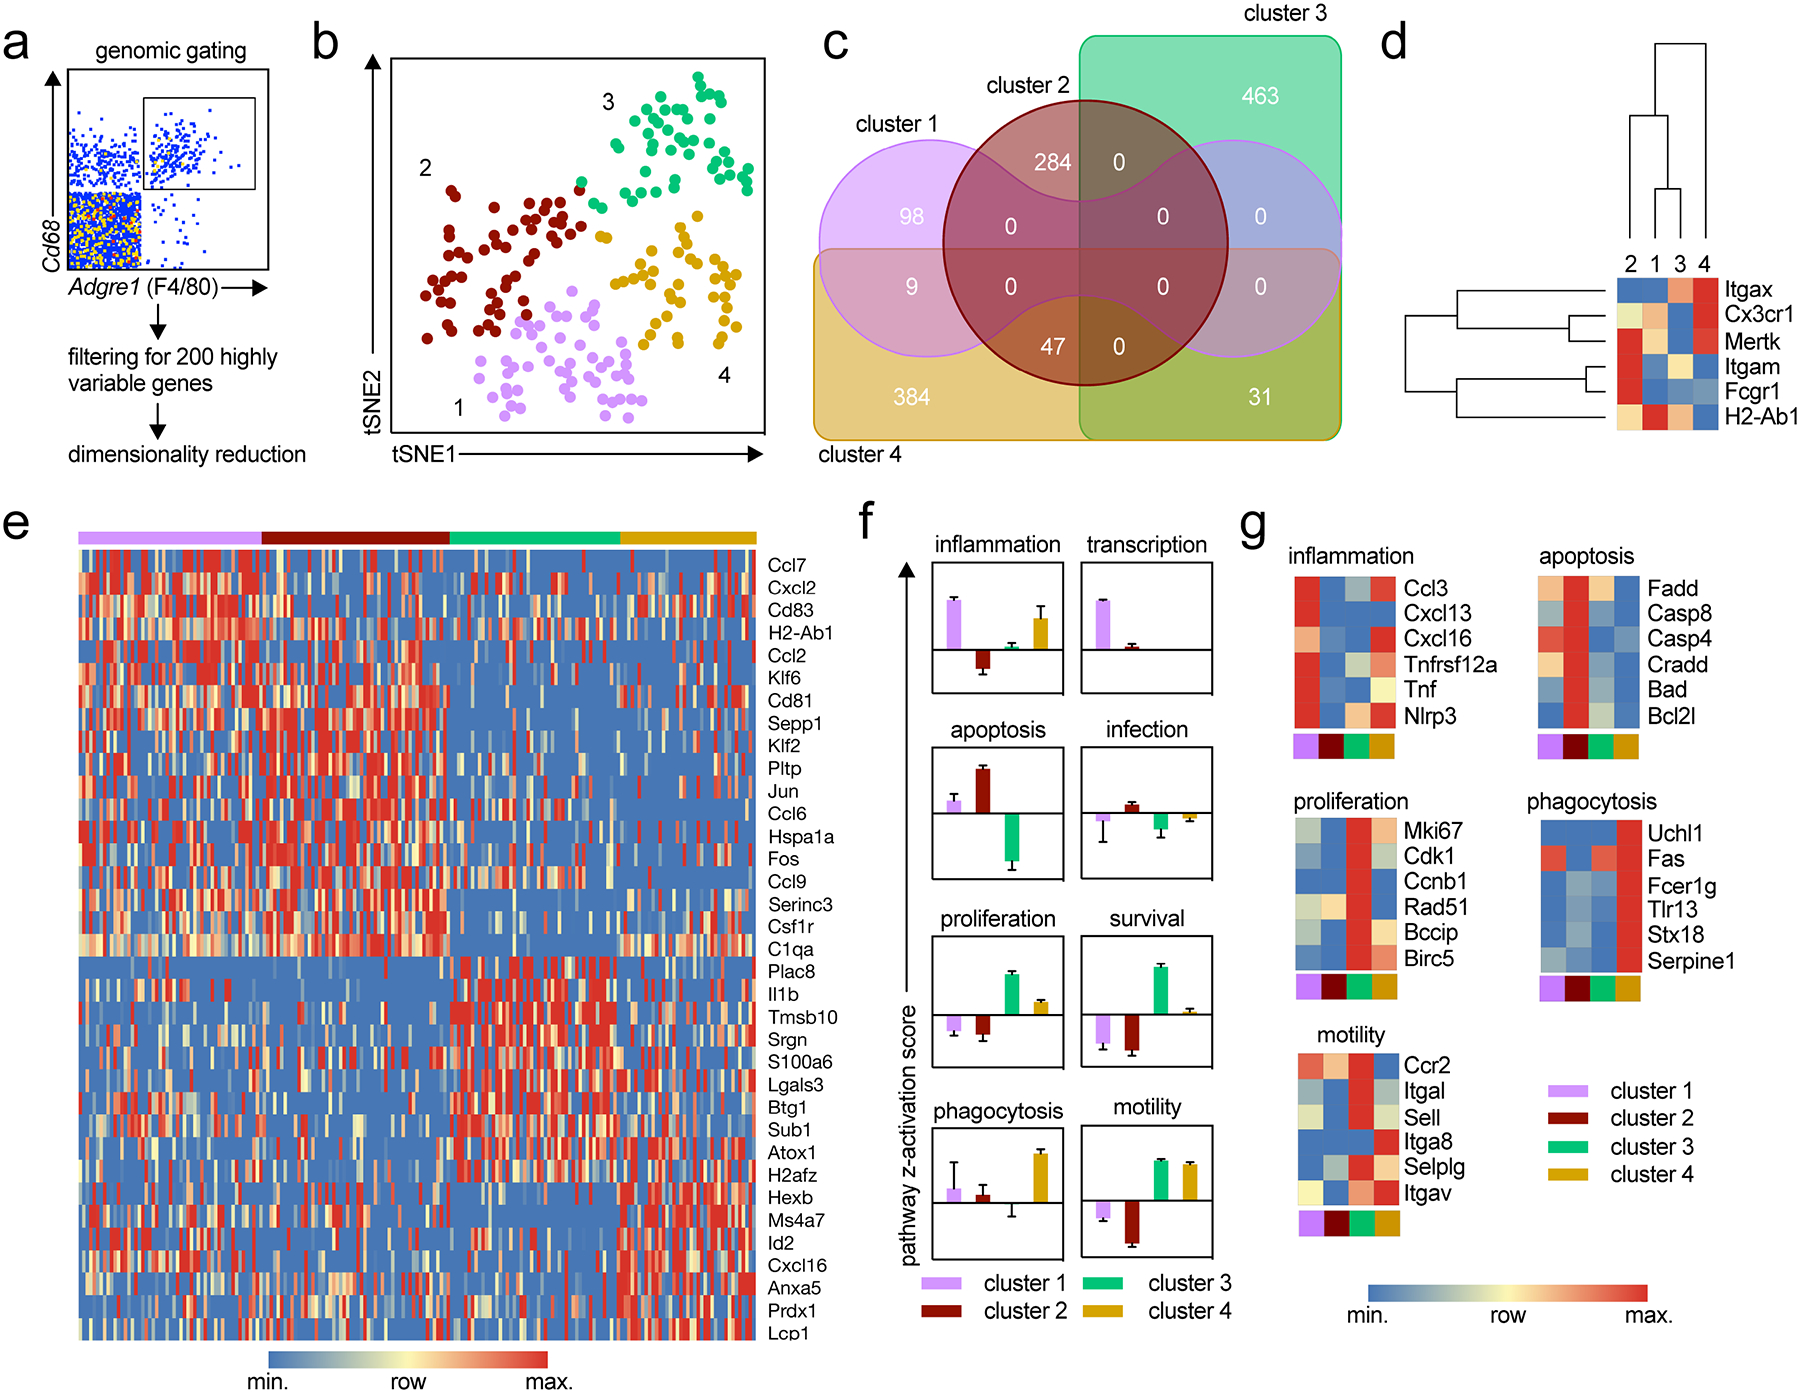
The transcriptomes of single CD45+ cells from aortas from Apoe−/− mice fed WD for 12 weeks were sequenced with the 10x genomic platform. A) 195 macrophages were identified by high expression of Adgre1 (F4/80) and Cd68. B) The 200 most variable genes were identified with SeqGeq and the cells were clustered with tSNE dimensionality reduction. 4 groups were identified using k-means clustering with automatic determination of the number of clusters. C) Differentially expressed genes for each cluster were calculated with cutoffs for FDR<5% (Benjamini-Hochberg) and p<0.05 (two-sided T-test, 10000 permutations) on the full gene set of all macrophages in the 4 populations (one-versus-all comparison). Venn diagram shows the number of unique DE genes for each cluster or shared between clusters. D) The 4 macrophage groups were hierarchically clustered based on their expression of common myeloid markers (Itgax (CD11c), Cx3cr1, Mertk, Itgam (CD11b), Fcgr1 (CD64), and H2-Ab1 (MHCII). E) Expression of the top DE genes for each cluster is shown as a heat map. F) IPA revealed activation (positive z score) or inhibition (negative z score) of pathways relevant to inflammation and atherosclerosis by each macrophage cluster. Bar graph shows average Z score (± standard deviation) of the pathways indicated. G) Normalized expression of DE genes relevant to each of the pathways by each macrophage cluster.
Based on the finding that Itgax and Cx3cr1 are two key determinants of macrophage subset, fluorescent reporter mice for these genes were crossed to generate Cx3cr1GFP/+Cd11cYFPApoe−/− mice16,17. These mice enable separation of 4 macrophage subsets based purely on fluorescence, a convenient, non-destructive means that facilitates imaging, flow cytometry, and deep RNA sequencing experiments. The mice were healthy, fertile and were >96% C57BL/6 by genome-wide SNP analysis.
The four groups of aortic leukocytes delineated by GFP and YFP expression were characterized on the basis of macrophage cell surface markers using flow cytometry. (Fig. 2A, fluorescence-minus-one controls in Online Figure I). The relative gene expression levels shown in Fig. 1D suggested that cluster 1 may correspond to GFP+, cluster 4 to GFP+YFP+ (Double Positive, DP), cluster 3 to the YFP+, and cluster 2 to GFP-YFP- (Double Negative, DN) cells. The DP were the most abundant group with almost 40% of all CD45+ cells, followed by GFP+ and DN (25% each) and YFP+ (10%, Fig. 2B). Each of the four populations were gated for the macrophage marker F4/8019,20. ~90% of GFP, YFP, and DP cells were macrophages as defined by F4/80 expression (Fig. 2C, D). Among the DN cells, ~60% were F4/80+ macrophages (Fig. 2D). Among all F4/80+ cells, DP were the most frequent (40%), followed by GFP+ (30%), DN (20%), and YFP+ (10%, Fig. 2B). Among the F4/80+ cells, the proportion expressing CD11b or c varies between groups, with very few expressing CD11c only (Fig. 2E, F). The F4/80+ macrophages in the four groups also showed different levels of MHC-II and CD64 (Fig. 2G,H). Cells expressing nearly every combination of F4/80, CD64, CD11b, CD11c, and MHCII were observed, except no CD11b-CD64+ cells were found (Online Table II). Overall, the GFP+, DP, and YFP+ groups showed high levels of classical myeloid markers, while the F4/80+ GFP-YFP- macrophages lacked many of these markers.
Figure 2: Flow cytometry of atherosclerotic aortic leukocytes.
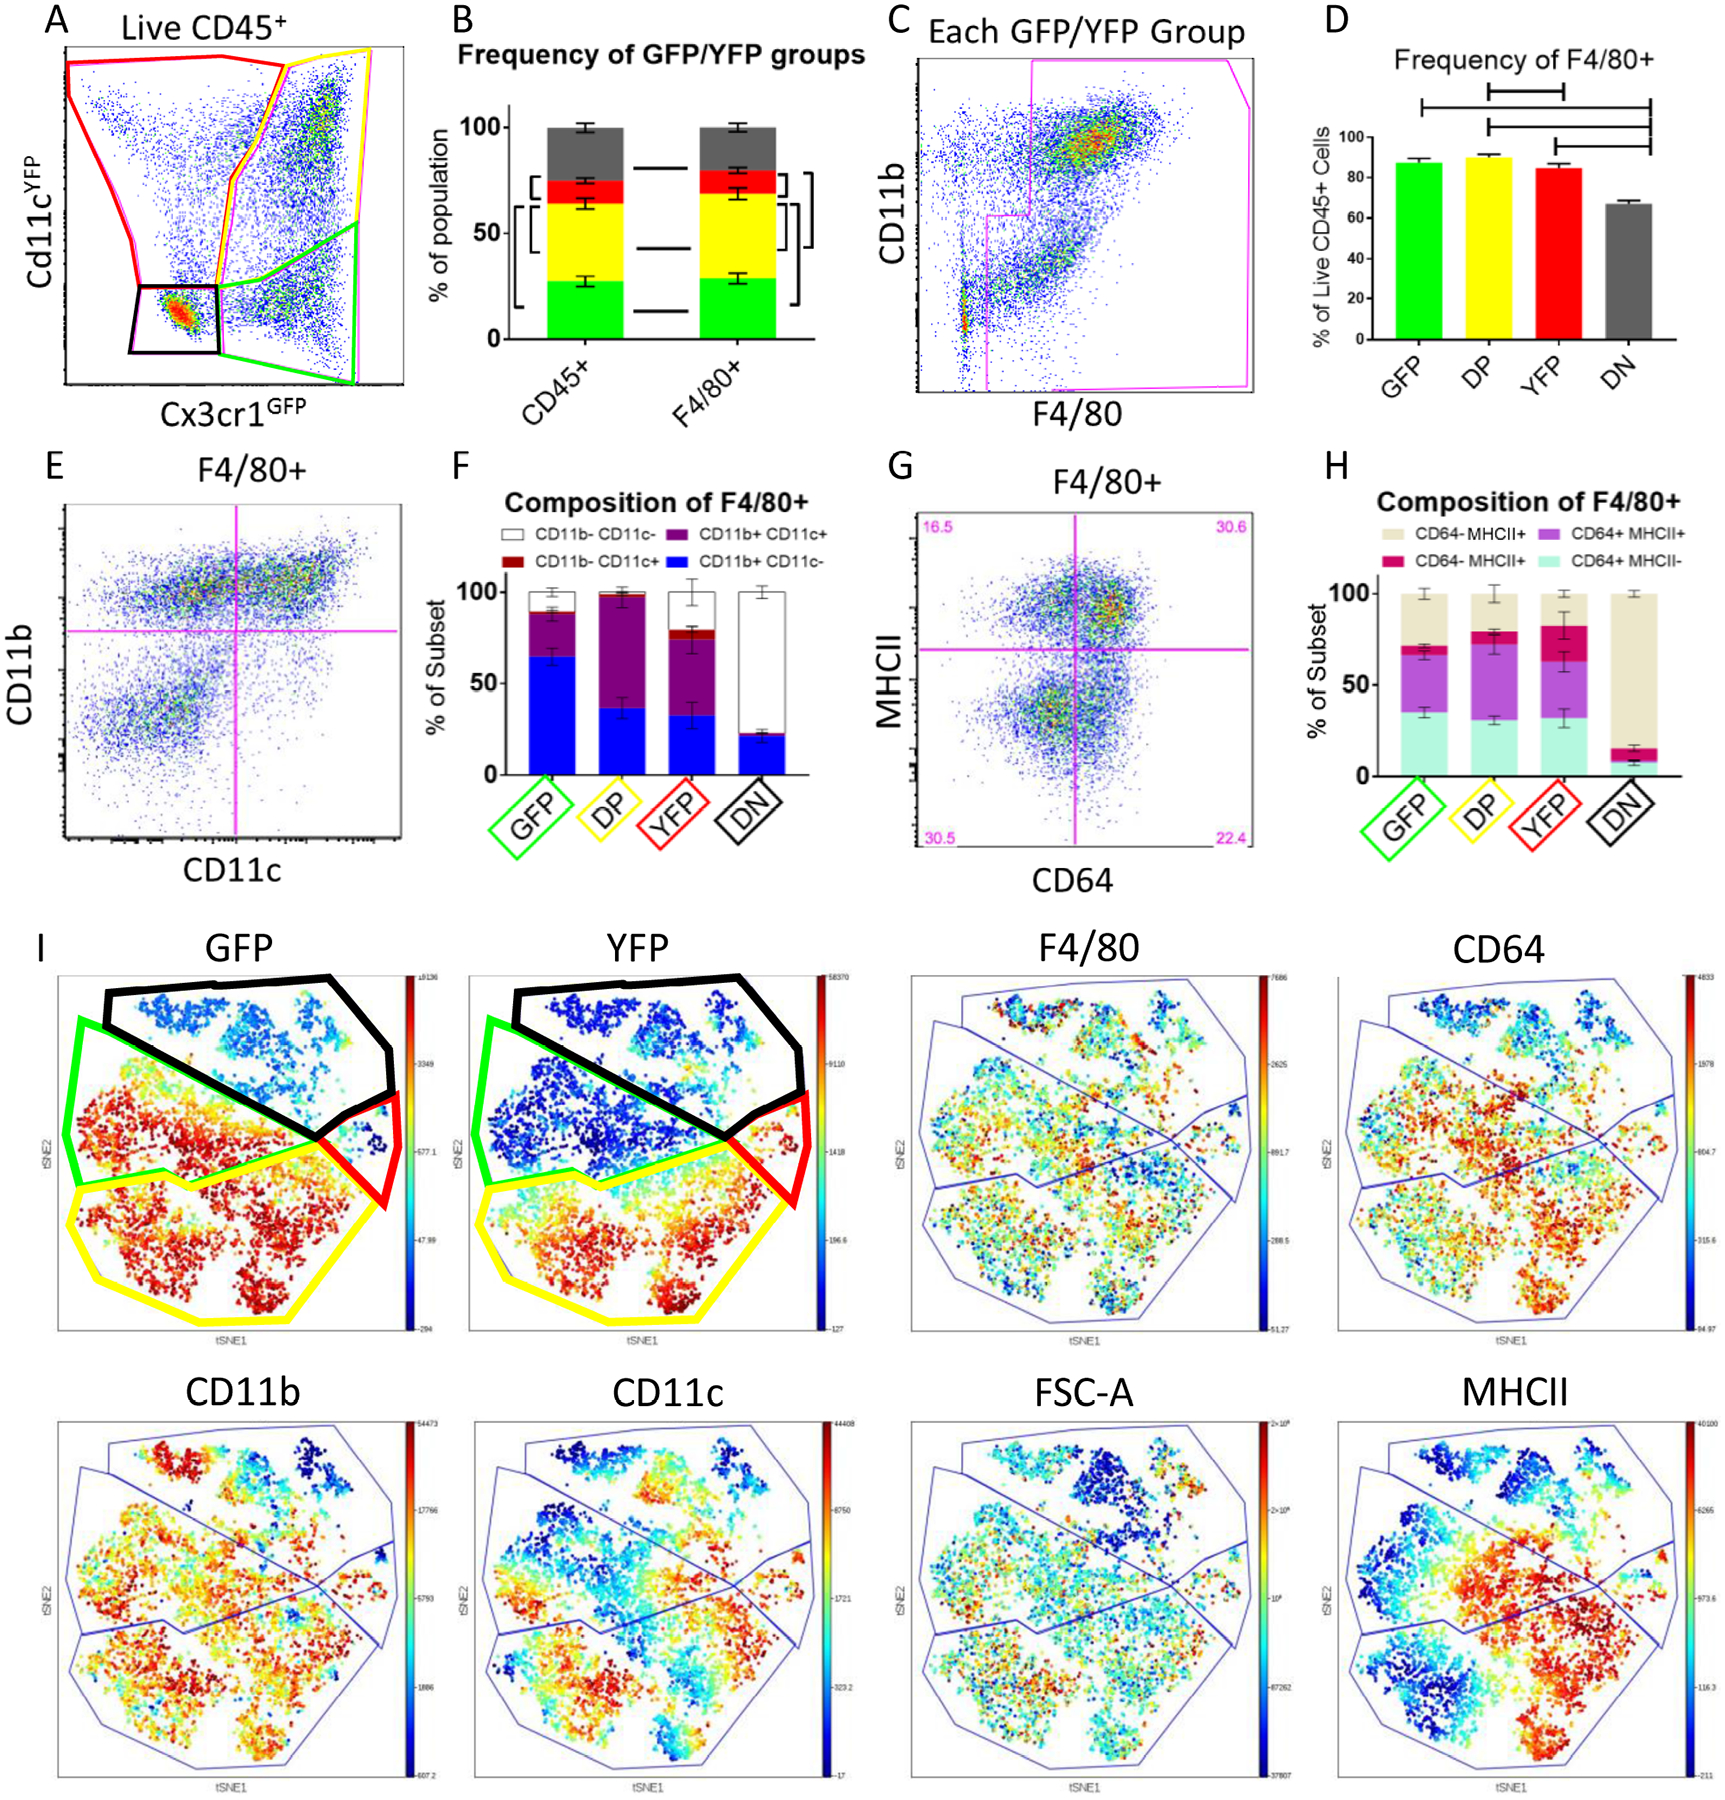
A) Live CD45+ leukocytes were gated into 4 groups based on GFP and YFP. Representative of n=8. B) Frequency of each fluorescent group within live CD45+ aortic cells. Bars show changes in frequency that are p<.05 by two-way ANOVA with the Holm-Sidak correction. C) Each group is further gated on F4/80 (based on FMO control, Online Figure I) to identify macrophages. D) Frequency of F4/80+ cells among all CD45+ leukocytes in each of the fluorescent subsets. Bars show changes in frequency that are p<.05 by two-way ANOVA with the Holm-Sidak correction. The aortic macrophages are characterized by CD11b and CD11c (E) representative plot and F) frequency), and CD64 and MHCII (G) representative plot and H) frequency). I) viSNE was performed on all F4/80+ macrophages. Example rainbow plots showing relative expression levels of 8 major markers. Boundaries were drawn based on the GFP and YFP expression plots. All data come from n=8 aortas.
The F4/80+ macrophages were clustered based on their expression of the various myeloid markers using viSNE21 (Fig. 2I). The clustering was dominated by expression of GFP and YFP, confirming the validity of the 4 subsets. Gates corresponding to the GFP, DP, YFP, and DN populations are shown on the viSNE plots in Fig. 2I. After the fluorescent reporters, the cells clustered into sub-populations based primarily on MHC-II and then CD11c, suggesting these are important determinants of macrophage phenotype. However, smaller clusters are still visible within the 4 larger groups, suggesting again that aortic macrophages have high phenotypic variability. The DN macrophages showed the most variety, with a small subpopulation that is CD11bhiCD11c- and another that is small (FSC-A low) and CD11c+.
To probe the function and behavior of these cells within atherosclerotic arteries, we turned to imaging. Aortas explanted from Cx3cr1GFP/+CD11cYFPApoe−/− mice fed WD for 6–10 weeks were imaged with two-photon microscopy (Fig. 3A, B), using techniques similar to22. Collagen in the arterial wall was visualized by second-harmonic generation (SHG). The macrophages in the aortic plaque had a variety of shapes, with some rounded and others more elongated or dendritic-shaped. The cells were segmented using pixel-classification23 and their shapes were quantified with custom Matlab scripts. DP cells were significantly smaller than GFP cells (1250 μm3 vs 1720 μm3, p<.05, Fig. 3C). YFP cells were significantly more spherical with fewer extensions than the other two groups (p<.05, Fig. 3D).
Figure 3: Imaging of fluorescent cells in atherosclerotic plaques.
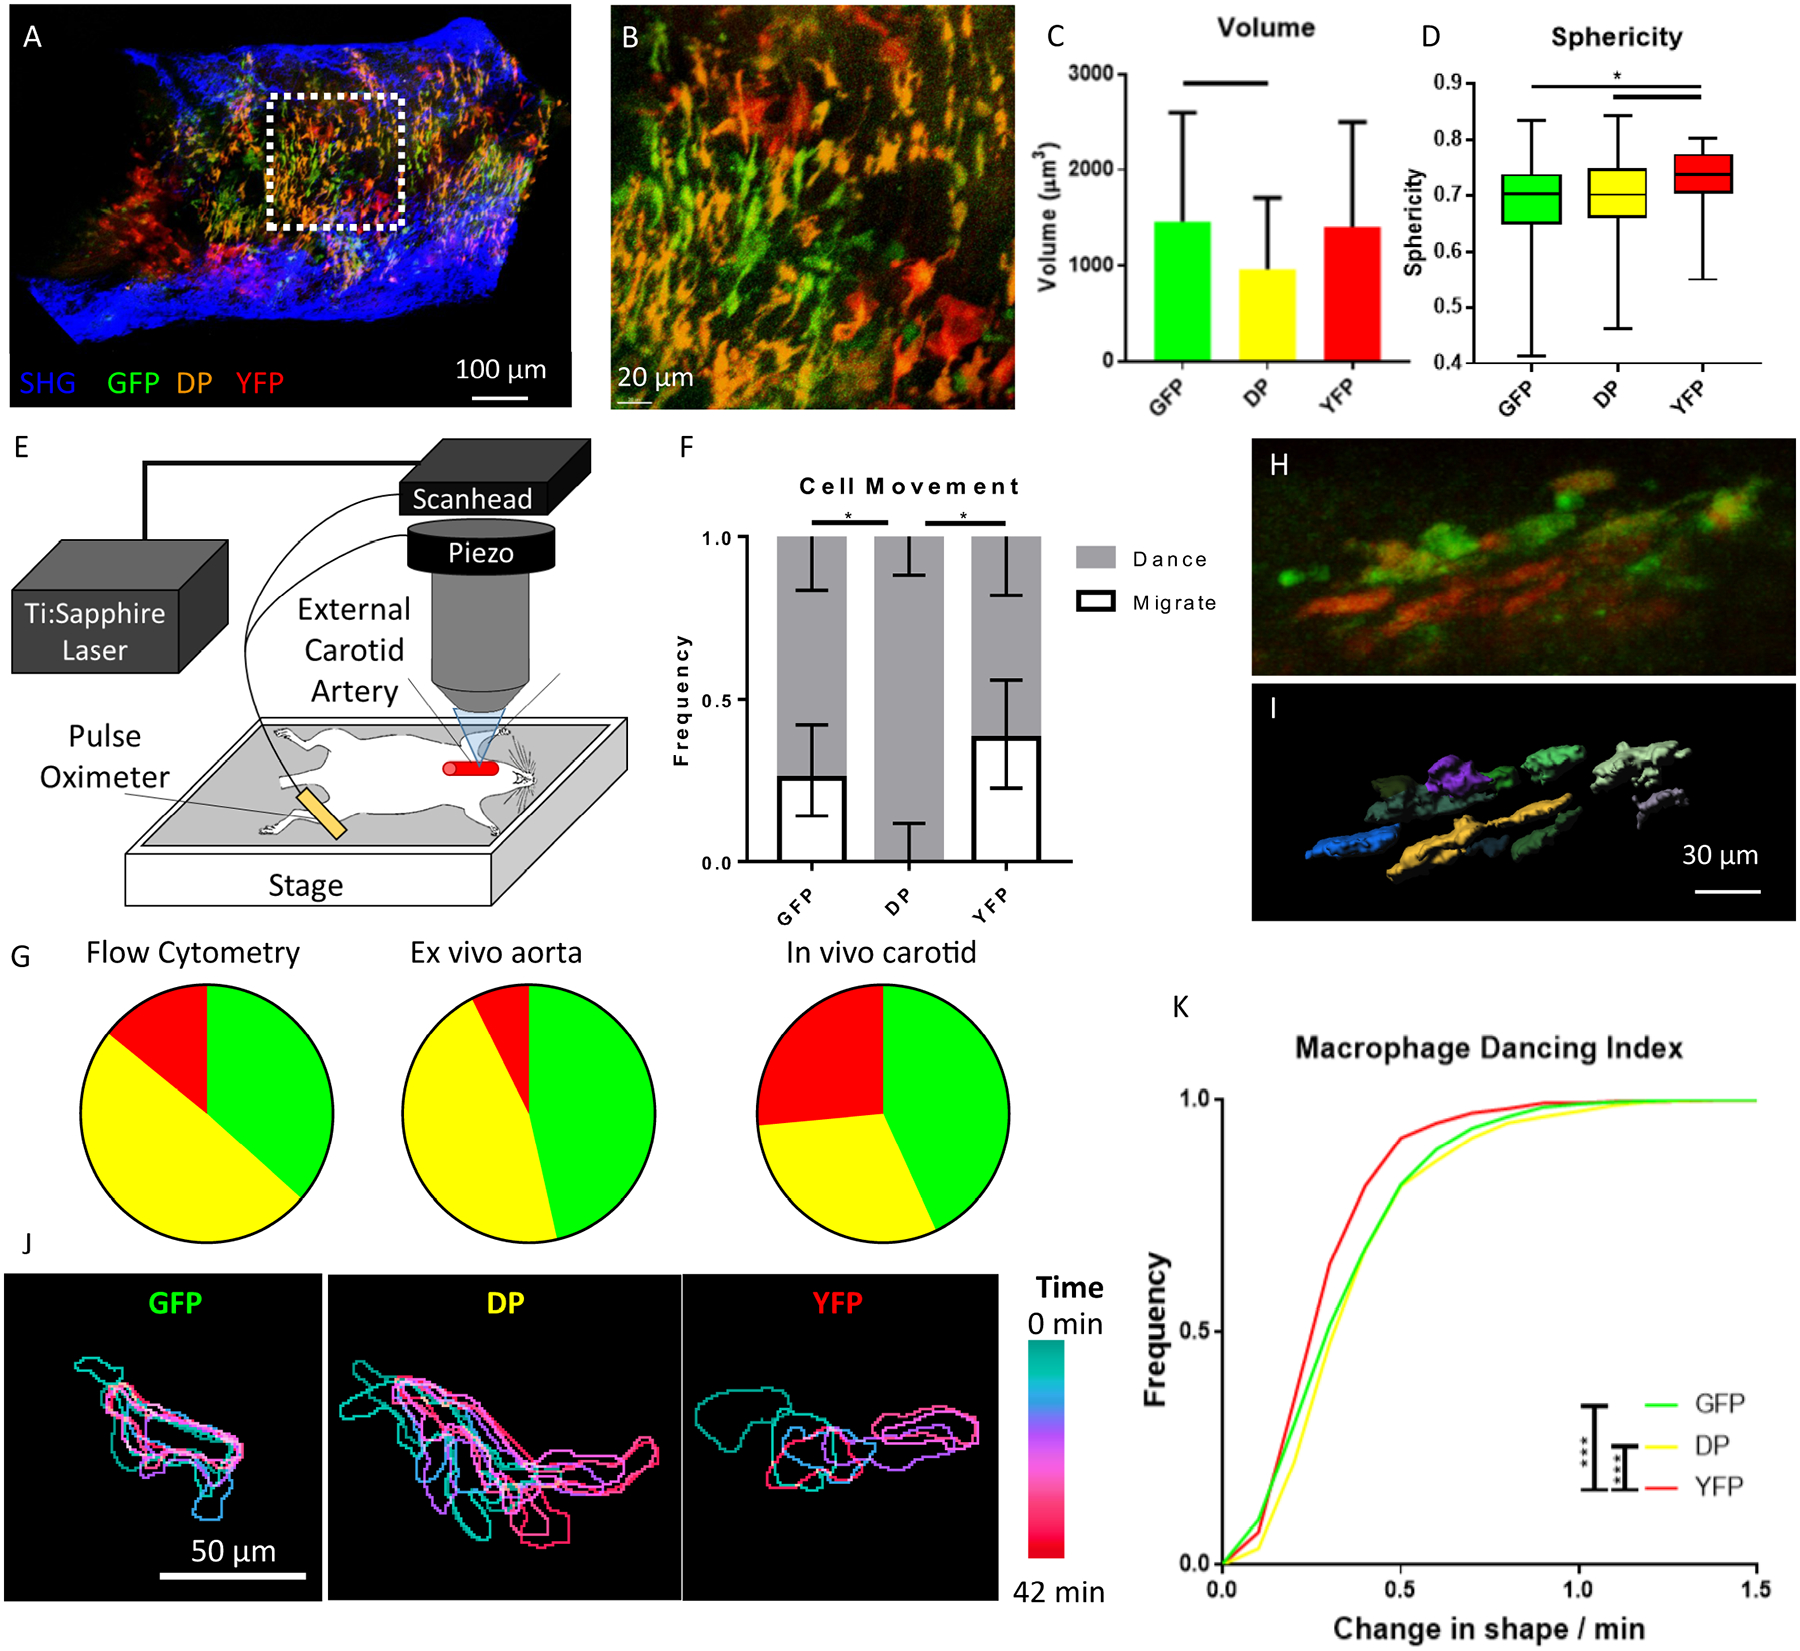
A) An aorta explanted from an Apoe−/− Cx3cr1GFP/+CD11cYFP mouse fed WD and imaged with two-photon microscopy shows GFP, DP, and YFP cells in the wall. B) Zoom-in on the white dotted box, showing details of the shape and cell-cell contact of macrophages in the atherosclerotic arterial wall. C) Volume and D) Sphericity of the 3 subsets of cells in the ex vivo aorta. Mean ± SD of n=187, 186, and 30 cells, respectively. Bars indicate p<.05 by the Kruskal-Wallis non-parametric test with Dunn’s correction for multiple comparisons. E) Equipment setup for intravital imaging of the carotid artery, adapted from25. F) Qualitative assessment of cell motion of the 3 visible phenotypes by a blinded judge. 95% confidence intervals were calculated using the Wilson/Brown method. * indicates the confidence intervals on the Migrate group do not overlap. G) The fraction of the GFP, DP, and YFP populations among all fluorescent cells in the aorta by flow cytometry (left), in the imaged aortic explants (middle), and among all moving cells in the intravital carotid artery movies (right). H) Representative maximum intensity projection of an image acquired via intravital imaging of the carotid artery of an Apoe−/− Cx3cr1GFP/+CD11cYFP mouse fed WD. See Online Videos I–II for more examples. I) Imaris surface rendering of cells from H. Each cell is shown in a different color to emphasize boundaries. J) Example movement of a representative GFP, DP, and YFP cell, demonstrating types of motion. The position of each cell in 7 different time points (7 min apart) was overlaid. Each color represents a different time point; ILTIS intravital microscopy. K) Cumulative frequency distributions of macrophage “dancing” motion in the carotid artery in vivo for each fluorescent group. A total of n=439 (GFP), 764 (DP), and 837 (YFP) cell motions were detected, where each point quantifies the change in each cell (normalized to cell size) between 2 successive time points. Distribution differences tested by Kolmogorov-Smirnov test. * p<.05; *** p<.0001
Intravital imaging enables visualization of dynamic cell behavior in the most biologically relevant context24. We used the ILTIS25 system to image the arterial wall of atherosclerotic Apoe−/−Cx3cr1GFP/+CD11cYFP mice fed WD for 5 months using two-photon microscopy (Fig. 3E–J). Briefly, each mouse was anesthetized and the external carotid artery was surgically exposed and left untouched so that pulsatile blood flow continued freely without compression artifacts26. Image acquisition was triggered by a pulse oximeter such that a single image of the artery was taken during the calmest portion of every heartbeat (Fig. 3E). In these movies of the intimal plaque, all three visible cell types can be seen in contact with each other. Many moved in a dancing-on-the-spot pattern, in which the cells extend their processes but show little net displacement (Online Video I), while others showed directed migration (Online Video II, see also25). The motion pattern of each cell was qualitatively classified by a blinded investigator. All DP cells were classified as dancing, whereas 20% of GFP+ cells and 30% of YFP+ cells showed interstitial motility (Fig. 3F). GFP, DP, and YFP cells were observed in similar proportions in the intravital imaging, ex vivo imaging, and flow cytometry (Fig. 3G). Additionally, cells were segmented using a custom Matlab script based on dynamic color gradients27 (Fig. 3H–I). Outlines of representative cells of each of the 3 subsets (Fig. 3J) accent the difference between dancing motion (GFP and DP) vs. migration (YFP). We developed a centroid-adjusted “dancing index” to quantify this pattern, which measures the change in cell shape across all time points and all cells, independent of net migration. YFP+ cells showed a significantly lower dancing index than GFP+ and DP cells (Fig. 3K), indicating their cell shape was more stable over time.
To obtain deep transcriptomes of these subsets, we flow sorted live CD45+ cells for GFP+, YFP+, DP, and DN populations, as shown in Fig. 2A, from the carotids and aortas harvested from 25 mice (pooled into 6 groups of 3–7 mice) for RNA sequencing. 18 of the 24 samples passed post-sequencing quality controls, including having at least 75% mapped reads, fewer than 2% of reads mapped outside exons and UTRs, and even 5’ to 3’ gene coverage (Online Figure II). Differential expression was calculated between all pairs of groups using DESeq228 and any genes found in multiple comparisons was assigned to the group with the most extreme fold change. Therefore, genes that are expressed in all groups, including many common leukocyte and macrophage markers, are not found in this list, because they are not differentially expressed.
187 of the DE genes were significantly overexpressed in GFP+ cells, 25 genes in DP cells, 622 genes in YFP cells, and 41 genes in DN cells (Fig. 4A, Online Table III). Based on IPA analysis, the genes that were differentially expressed amongst the 4 cell populations were enriched for chondroitin and dermatan biosynthesis, inhibition of matrix metalloproteases, coagulation, IL-17a and f pathways, and complement (Fig. 4B, Online Table IV). Pathway analysis of GFP+ cells (Fig. 4C, Online Table V) showed activation of pathways for cellular infiltration by phagocytes and inhibition of pathways of migration and cell protrusion. Interestingly, the GFP cells were also enriched for genes associated with mortality and cell death. The YFP cells showed a roughly opposite pattern: migration, cell protrusion and microtubule dynamics pathways were activated, while morbidity and mortality pathways were inhibited. The DP group had an activation pattern similar to the YFP group, but milder (smaller z-scores). All three types of visible macrophages (GFP+, YFP+, DP) showed activation of cell movement, migration and infiltration pathways compared to the reference DN cells.
Figure 4.
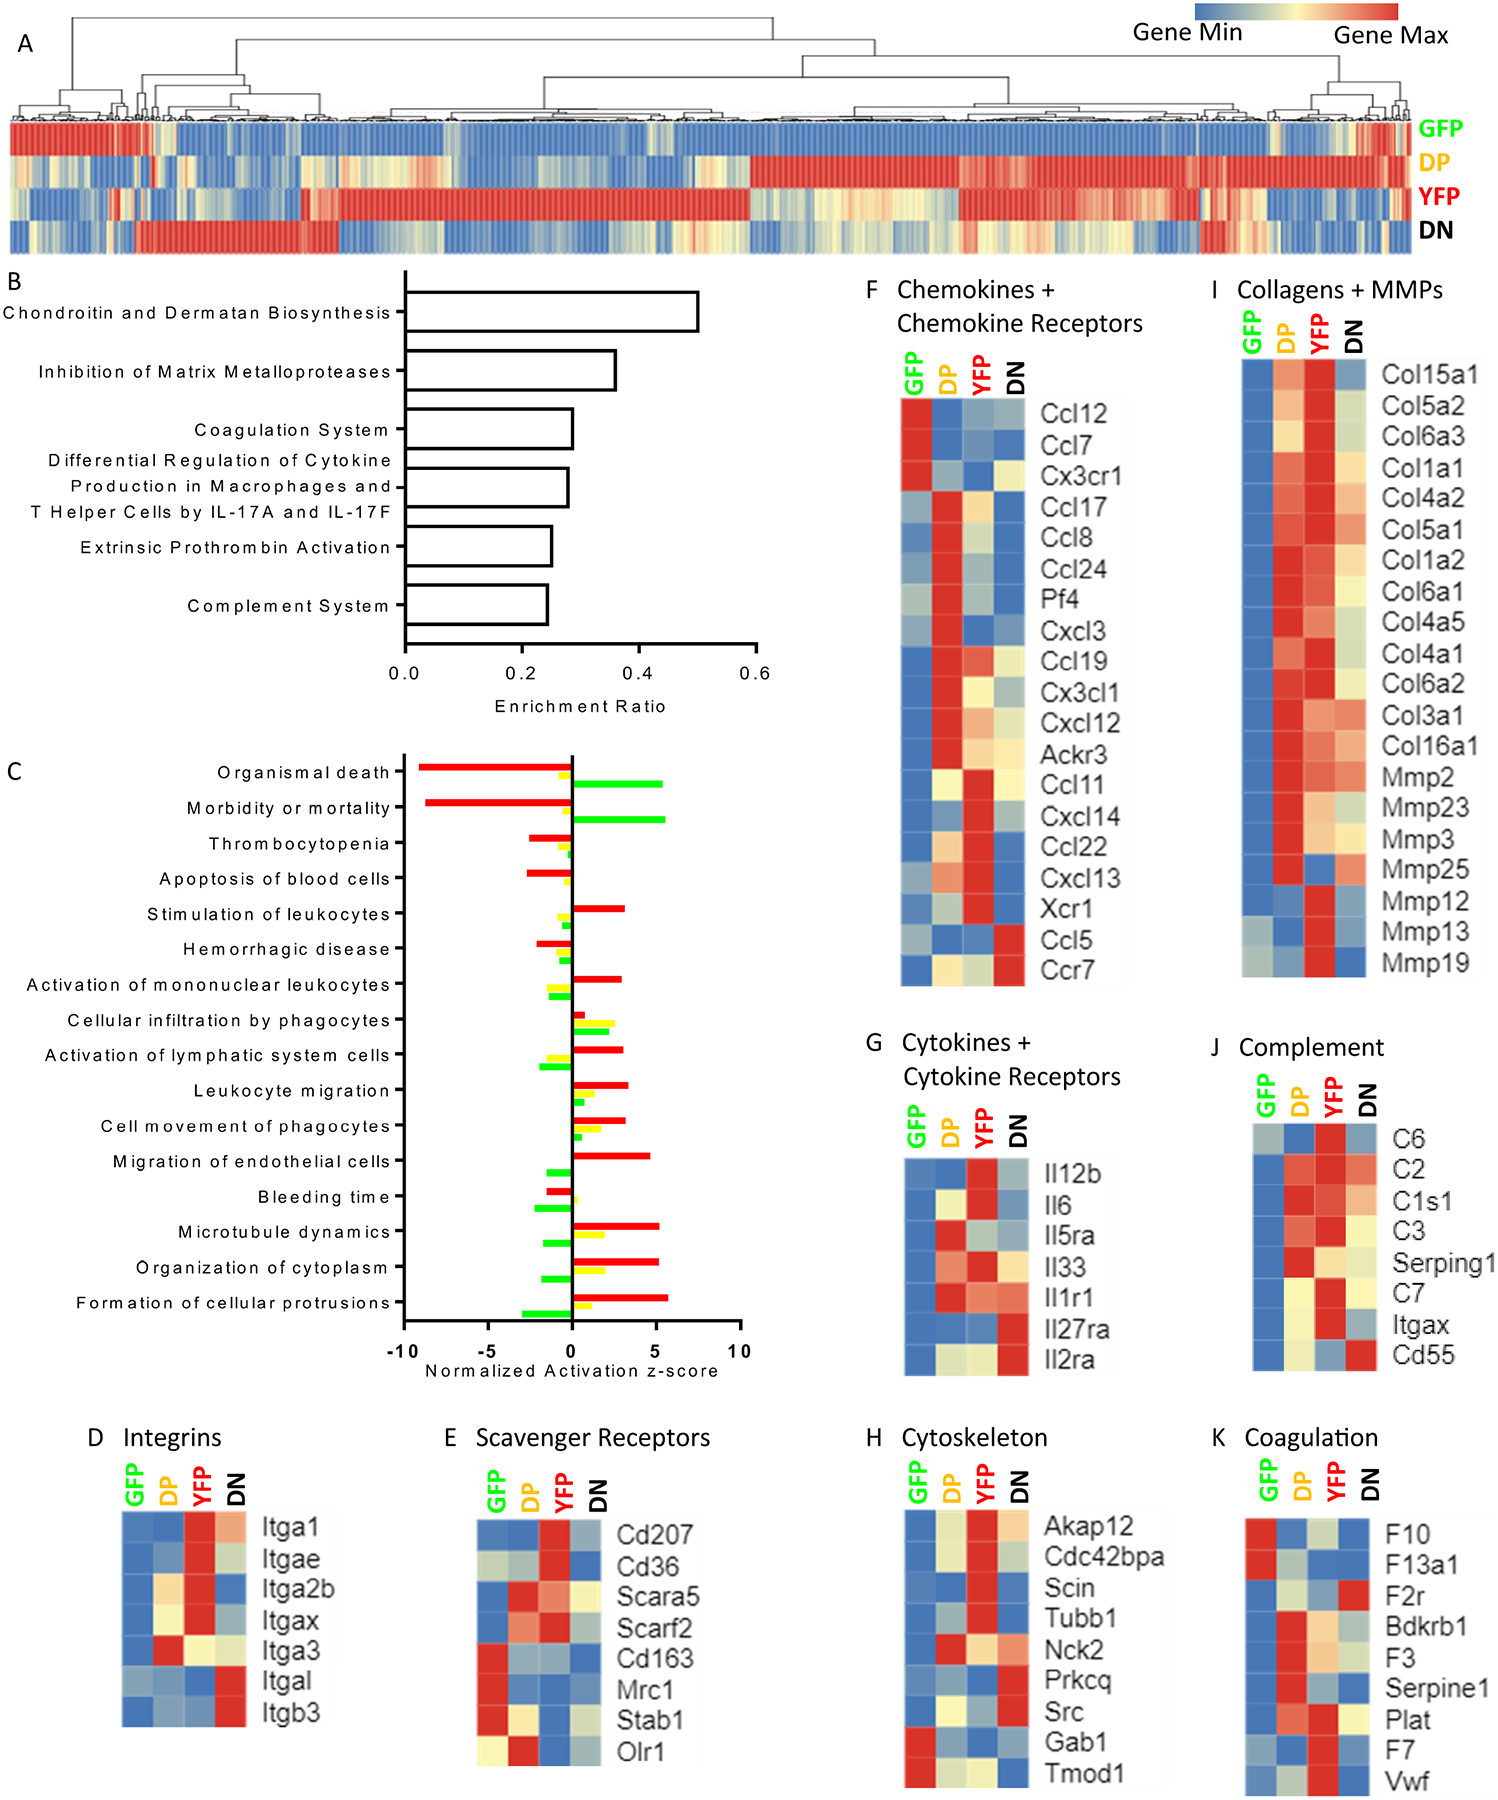
A) Hierarchical clustered heat map of 892 genes differentially expressed in one group compared to the other three, gene list in Online Table III. The color for each gene is normalized to its individual minimum (blue) and maximum (red) normalized count, averaged by group. B) Top 6 enriched canonical pathways among all 892 genes, based on the ratio of number of genes in the pathway (among all pathways with p<.05, calculated in IPA with Right-Tailed Fisher’s Exact Test). See Online Table IV for enriched pathways and functions. C) Biological functions with highly polarized enrichment scores for the GFP, YFP, and DP subsets. Z scores are calculated as using the DN group as reference, which is shown as 0 for all pathways. All have p<.05, calculated in IPA with Right-Tailed Fisher’s Exact Test. D-K) Select genes from atherosclerosis– and cell movement-related pathways, hierarchically clustered to show biological signatures of each cell type. Only genes that are differentially expressed are shown. Gene groups that were explored are: D) Integrins, E) Scavenger Receptors, F) Chemokines and their receptors, G) Cytokines and their receptors, H) Cytoskeleton-related proteins, I) Collagens and matrix metalloproteinases J) Complement Pathway, K) Coagulation pathway. The color scale of each gene is normalized independently, as above.
Eight categories of the differentially expressed genes related to atherosclerosis were analyzed in more detail (Fig. 4D–K). Among 7 integrins that were differentially expressed between the groups (Fig. 4D), YFP+ cells express high levels of α1, αE, αIIb, and αx. Integrins are obligatory heterodimers, but the corresponding beta genes were not differentially expressed in YFP cells. Scavenger receptors on macrophages bind to a wide variety of ligands29. Among oxLDL receptors relevant for atherosclerosis, YFP+ cells overexpressed Cd36, while DP cells overexpressed Olr1 (Fig. 4E). GFP+ cells overexpressed Cd163, the receptor for hemoglobin-haptoglobin complexes, as well as the mannose receptor Mrc1. Chemokines and their receptors play a vital and complex role in atherosclerosis, capable of influencing disease progression and plaque composition.30 Each of the 4 macrophage subsets overexpressed specific chemokines and chemokine receptors (Fig. 4F). DP cells expressed many chemokines known to be relevant to atherosclerosis, including Ccl17, Pf4, Cxcl1, Ccl19, and Cxcl12. DN cells overexpressed the pro-inflammatory Ccl5 and the chemokine receptor Ccr7. GFP+ cells expressed the highest levels of Cx3r1. Among cytokines, IL12-p40 (Il12b) and Il6 was overexpressed in YFP+ cells, while Il27ra was overexpressed in DN cells (Fig. 4G).
The cytoskeleton is responsible for cell shape and movement. YFP+ cells overexpressed 4 of the 9 cytoskeletal genes (Fig. 4H). The composition of the extracellular matrix is a major determinant of plaque size and stability. We found a remarkable overexpression of many collagen genes in YFP and DP cells, along with several matrix metalloproteinases (Fig. 4I).
The complement system is known to play an important role in the development of atherosclerosis31. Genes in the complement cascade and related proteins were distributed among DP, YFP, and DN cells (Fig. 4J). GFP+ cells expressed low levels of all the differentially expressed complement-related genes. Hemostasis and thrombosis are of key importance for the sequelae of atherosclerosis like heart attacks and strokes. The initiator of coagulation, tissue factor (F3), was most highly expressed in DP cells (Fig. 4K).
In addition to differential expression analysis, we employed PRESTO, a recently developed method of analyzing gene expression across many samples32. PRESTO relies on a tSNE-based clustering algorithm that groups variable genes in a blinded, hypothesis-free manner based on co-expression patterns. Four clusters of genes were clearly separated (Fig. 5A, Online Table VI). Group 1 (984 genes) was mainly comprised of olfactory receptors and their signal transduction genes, group 2 (630 genes) contained angiogenesis and cell migration genes, group 3 (876 genes) included many leukocyte proliferation genes, and group 4 (980 genes) was dominated by genes involved in leukocyte migration, the mitochondrial respiratory chain, and the expression and translation of proteins (Fig. 5B, Online Table VII). Plotting the relative strength of expression of each gene by group (from 1st to 4th) can help visualize which cell populations highly express which groups of related genes. Group 1 genes were most highly expressed in YFP+ macrophages while group 3 genes were most highly expressed in DN cells. None of the 4 gene groups were associated with GFP cells (Fig. 5C). Groups 2 and 4 show a rainbow of expression between DP and YFP (Fig. 5D,E), suggesting both DP and YFP cells express these groups of genes, but with slightly different expression patterns.
Figure 5: PRESTO unsupervised clustering of genes from the macrophage transcriptomes (normalized counts as input).
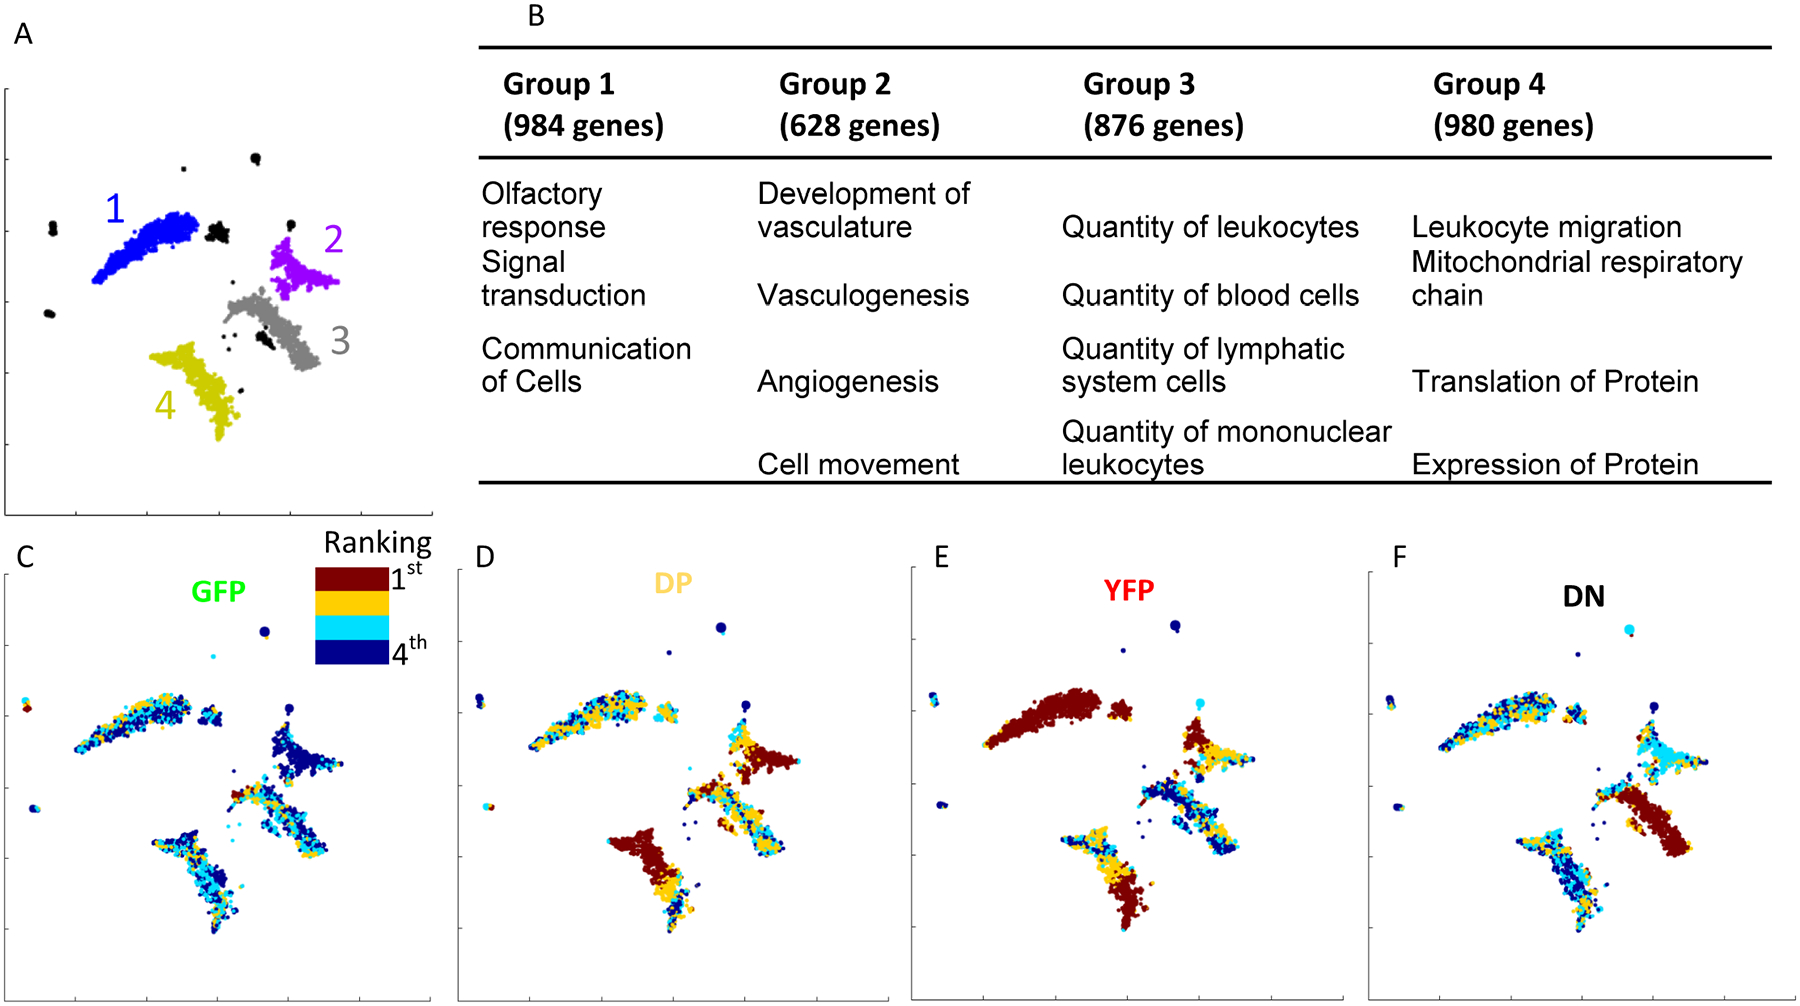
A) The pre-processing filters identified 3,957 variable genes, and tSNE-based dimensionality reduction organized them into 4 large groups. B) The 5 top (lowest p-value) most enriched biological functions for each of the 4 large gene groups, calculated in IPA with Right-Tailed Fisher’s Exact Test. C-F) The relative rankings of the average expression of each gene in the 4 phenotypes is shown as a heat map. Red shows the genes that are most highly expressed by the C) GFP, D) DP, E) YFP, and F) DN groups.
Gene set enrichment analysis33 was employed to compare the transcriptomes of the GFP+, DP, YFP+, and DN groups to published transcriptomes to better understand how these cell subsets relate to disease progression and pathology. Habenicht et al. previously compared bulk transcriptomes of healthy and atherosclerotic mouse aortas.34 From this data set, we generated two comparisons: healthy versus atherosclerotic mouse aorta (Fig. 6A), and aorta with arterial tertiary lymphoid organs (ATLO) versus without ATLO (Fig. 6B). Randolph et al. studied the transcriptomic difference between foamy and non-foamy macrophages in mouse atherosclerotic plaques14 (Fig. 6C). Feig et al. compared bulk transcriptomes of mouse aortas with progressing against regressing lesions (Fig. 6D)35. Lee et al. found different signatures in macrophages taken from ruptured or stable human atheromatous plaques (Fig. 6E)36. These five pairs of gene signatures were tested for enrichment in GFP, DP, YFP, and DN aortic leukocytes.
Figure 6: Gene set enrichment analysis of genes upregulated in the GFP, DP, YFP, and DN groups compared to published data sets.
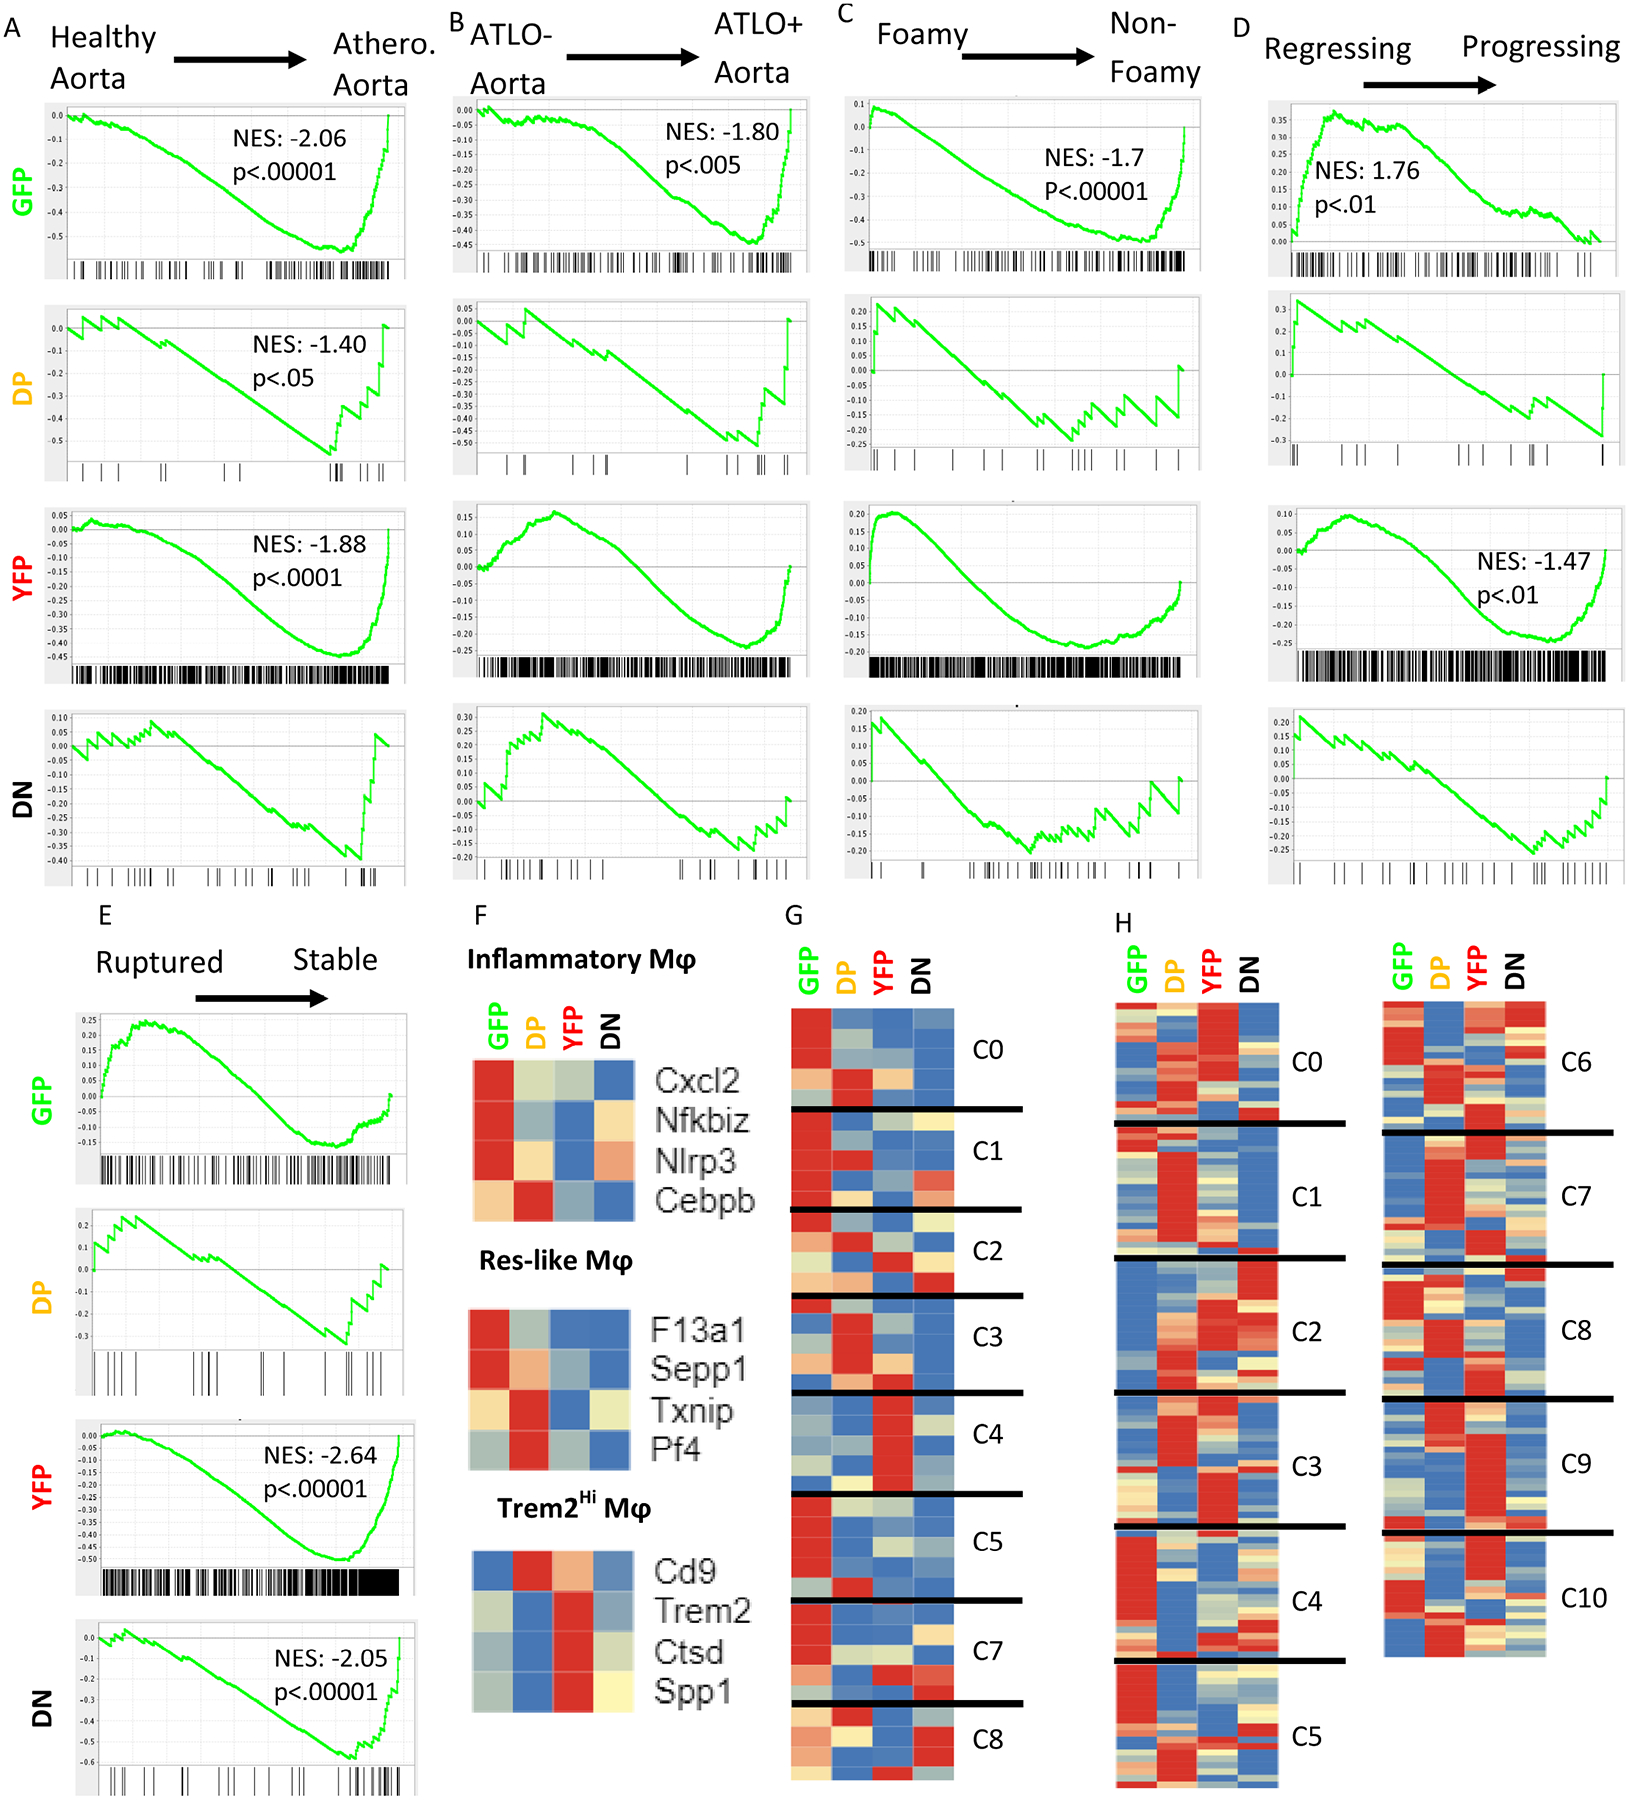
A) Comparison to whole vessel wall transcriptomes from healthy and atherosclerotic mouse aortas (GSE10000)34. B) Comparison to transcriptomes of atherosclerotic aortas with and without ATLO (GSE10000)34. C) Comparison to transcriptomes of atherosclerotic foamy or non-foamy macrophages (GSE11623914) D) Comparison to transcriptomes from regressing and progressing plaques based on a surgical model (GSE24819)35. All p-values listed are False Discovery Rate q-values. E) Comparison to transcriptomes of macrophages from ruptured or stable human atheromatous plaques derived from carotid endarterectomy samples via laser capture microdissection (GSE41571)36. F-H) Previous work on atherosclerotic aortas used scRNA-seq to detect leukocyte subsets along with their signature genes. Heatmaps show the relative expression of the identified signature genes in each of the 4 fluorescent subsets found here, with each gene normalized to its own minimum (blue) and maximum (red) normalized count, averaged by group. Genes within each of the predefined subsets were allowed to cluster freely. F) Cochain, et al., identified three aortic macrophage subsets in LDLr−/− mice- inflammatory, resident-like (Res-like), and Trem2hi- with 4 signature genes each11. G) Lin, et al., reported 8 macrophage subsets amongst all leukocytes in LDLr−/− mice. 4–5 signature genes were provided for each cluster. H) Kim, et al., described 11 cluster of CD11b+ cells derived from CX3CR1+ monocytes13. 20 overexpressed genes were provided for each cluster.
We found significant enrichment of the GFP, DP, and YFP gene signatures in the bulk transcriptomes of atherosclerotic aortas compared to healthy aortas (normalized enrichment scores (NES) from 1.4 – 2, Fig. 6A). Genes upregulated in GFP cells were also significantly enriched in aortas with ATLOs (Fig. 6B), although the mice in this study were not old enough to develop ATLOs. Non-foamy macrophages were enriched for the GFP+ cell signature (Fig. 6C). Interestingly, the genes upregulated by GFP+ cells were significantly enriched in regressing plaques, while YFP+ upregulated genes were enriched in progressing plaques (Fig. 6D). Stable plaques were enriched with the upregulated genes of the YFP and DN groups (Fig. 6E). The leading genes driving each significant comparison can be found in Online Table VIII.
Three previous scRNA-Seq data sets on atherosclerotic mouse aorta leukocytes provide context for the present findings. Cochain, et al, described 3 macrophages subsets and listed 4 representative genes for each11. Based on these 12 genes, GFP cells were most like the inflammatory macrophages, DPs were similar to resident-like macrophages, and YFP cells were most similar to Trem2Hi macrophages (Fig. 6F). DN cells were not similar to any of the subsets described by Cochain et al. Alternatively, Kim et al., reported 11 leukocytes clusters in atherosclerotic plaques, with 4–6 representative genes in each14. Comparing the representative genes from the 8 macrophage clusters to our groups, we found that GFP cells were similar to clusters 1 and 5, which both showed high expression of CD64 and CD206 (Fig. 6G). These clusters were enriched for genes involved in NF-κB signaling and cytokine/chemokine signaling. DP cells were most similar to cluster 3, a macrophage cluster that expresses endocytosis genes. YFP cells expressed all of the representative genes of cluster 4, associated with metabolic pathways. DN cells were not similar to any of the 8 macrophage clusters. Lin et al. used scRNA-seq on a different atherosclerosis model and found 11 macrophage clusters, some of which overlap with those described by Kim13. Each of their clusters showed overlap with multiple groups defined by GFP and YFP (Fig. 6H). Of note, GFP cells upregulated at least half of the genes associated with cluster 4 (chemokineHi) and cluster 5 (IFN signatureHi). DP cells upregulated at least half of the genes associated with cluster 1 (Folr2Hi) and cluster 7 (stem-like). YFP cells upregulate at least half of the genes associated with cluster 0 (Dnasel13Hi), cluster 3 (RetnlaHiEar2Hi), and cluster 9 (Trem2Hi). DN cells do not upregulate at least half of any group, though they were the best represented by cluster 2 (Ebf1HiCd79aHi, 8/20). Clusters 2, 6, 8, and 10 did not map to any of our four groups.
DISCUSSION
Plaque macrophages are known to be heterogeneous. In this work, we probed this diversity using classical myeloid markers (Cx3cr1GFP, ItgaxYFP, F4/80, CD64, CD11b, CD11c, and MHCII) and found that atherosclerotic macrophages express a wide variety of combinations of these markers. The Apoe−/−Cx3cr1GFP/+CD11cYFP system is a convenient and useful tool for dividing macrophages into groups that capture much of the natural variation (Fig. 1E, Fig. 2I and Fig. 6) while allowing both live cell imaging and cell sorting.
Live cell microscopy is uniquely able to capture shape and migratory characteristics of the macrophage subsets. Only one previous study has reported live cell imaging data of macrophages in atherosclerotic plaques, making use of different reporter mice (LysMcre/+ RosaLSL-Tomato Ldlr−/− mice and CCRGFP/+ Ldlr−/− mice fed HFD)37. This work demonstrated that macrophages within the atherosclerotic did not exhibit migration. Our data confirm these findings for our Cx3cr1GFP+ and DP macrophages. However, some Cd11cYFP cells showed clear interstitial movement, which was not reported in the previous study, perhaps because these cells were not labeled. We also describe cell shape changes that were not reported before. Williams, et al, described small, round cells near the plaque border, likely newly recruited monocytes, which did undergo significant, directional movement, as we have previously reported38. From our data, we cannot conclude what specific function the dancing movement serves in atherosclerotic plaques. In other models, macrophage shape and morphology dynamics have been linked to polarization39, activation40, and antigen surveillance41. Cellular motility could be linked to tissue recruitment or egress42, promoting migration of other cell types43, or active searching for other cells or extracellular stimuli. Previous work showed that CD11cYFP cells that are MHC-II+ can present antigen in situ22. The observed motility differences are likely correlated with changes in the expression genes related to the cytoskeletal structure, ligand sensing, or matrix attachment.
The three visible subsets (GFP+, DP, and YFP+) were associated with atherosclerotic and not healthy aortas, making these the most interesting to image. Based on the GSEA results, the signatures of GFP+, YFP+ and DP cells are clearly associated with genes expressed in atherosclerotic and not healthy aortas. Interestingly, the GFP signature was significantly enriched in regressing plaques and ATLOs. Regression is known to require the influx of new monocytes44, suggesting that at least some of the GFP+ macrophages may be monocyte-derived. Conversely, the gene signature of YFP+ macrophages was associated with progressing plaque, stable plaque, and extracellular remodeling, suggesting these cells may promote larger, but more stable plaques.
The genes overexpressed by each subset provide a fascinating glimpse into their possible roles in atherosclerosis. GFP+ cells have high expression levels of both Cd163, an anti-inflammatory molecule45, and Mrc1, an M2 marker46. YFP cells express a more aggressive inflammatory signature, including Il12b, an M1 marker3, and the pro-atherogenic cytokine Il647. DP appear to have a large role in influencing the leukocyte composition of plaques, expressing multiple chemokines that are believed to recruit monocytes, neutrophils, or T cells to the plaque and promote disease progression (Ccl17, Pf4, Cxcl1)30. DP cells also overexpress Ccl19, which affects macrophage transport to and from lesions30. While we are unable to track DN cell movement in the plaque, it is interesting to note they express Ccr7, which is reported to help macrophages egress from plaques during regression48.
In conclusion, the combination of quantitative intravital imaging with deep transcriptomes identified four subsets of vascular macrophages in atherosclerosis that have unique transcriptomic profiles. Table 1 displays a summary of the major characteristics of each subset as determined by the multiple experimental methods used in this work. These groups are consistent with some of the previously reported subsets derived from scRNA-Seq studies. Future work on the functional significance of the change in gene expression and motility characteristics will be needed to fully understand how these subsets contribute to disease progression.
Table 1-.
Summary of the major traits related to atherosclerosis and macrophage function for each of the 4 fluorescence-based groups. The results condensed in this table come from flow cytometry, microscopy, and RNA sequencing (Figures 2, 3, 4 and 6).
| GFP+ | DP | YFP+ | DN | |
|---|---|---|---|---|
| Frequency | 25% | 40% | 10% | 25% |
| Cell Shape | Mostly Dendritic | Dendritic | Round | ? |
| Cell Movement | Mostly Dancing | Dancing | Migration | ? |
| Activated Pathways and upregulated gene groups |
|
|
|
|
| Gene Set Enrichment | Atherosclerosis ATLOs Non-foamy Macs. Regressing Plaques |
Atherosclerosis | Atherosclerosis Progressing Plaques Stable Plaques |
Stable Plaques |
Supplementary Material
NOVELTY AND SIGNIFICANCE.
What Is Known?
Aortic macrophages function in many essential, often contrasting, roles in atherosclerosis.
Atherosclerotic macrophages are highly diverse and previous work has discovered at least 10 different subsets based solely on transcriptomes
What New Information Does This Article Contribute?
Proposes Cx3cr1GFP/+ CD11cYFP Apoe−/− as a mouse model that provides a convenient, practical approach for functional evaluation of atherosclerotic macrophage subsets
In-depth characterization of macrophage subset surface markers, movement, and transcriptomes
Unique intravital imaging of the behavior of atherosclerotic macrophages
ACKNOWLEDGEMENTS
We would like to thank La Jolla Institute Microscopy facility, especially Zbigniew Mikulski for excellent expert assistance and Katarzyna Dobaczewska for her help judging macrophage migration. We would like to thank the University of California San Diego’s Sequencing Core Facility for their help sequencing the transcriptomes and the La Jolla Institute’s Bioinformatics core for mapping the transcriptomes.
SOURCES OF FUNDING
This work was funded by NIH R01 (115232) to K.L. and HHMI (56005681) and NHLBI (T32HL105373-03) to S.M. SM is also supported by the Chan Zuckerberg Initiative Imaging Scientists program. H.W. was supported by the DFG award (GZ WI 4811/1-1). The FACSaria used for flow sorting the cells was purchased through a Shared Instrumentation Grant: S10 RR027366.
Nonstandard Abbreviations and Acronyms:
- scRNA-seq
Single Cell RNA sequencing
- DCs
Dendritic Cells
- HFD
High Fat Diet
- WD
Western Diet
- IPA
Ingenuity Pathway Analysis
- DP
Double Positive
- DN
Double Nega0074ive
- SHG
Second Harmonic Generation
- ATLO
Arterial Tertiary Lymphoid Organ
- NES
Normalized Enrichment Score
Footnotes
DISCLOSURES
None.
REFERENCES
- 1.Ginhoux F, Jung S. Monocytes and macrophages: developmental pathways and tissue homeostasis. Nature Reviews Immunology. 2014;14:392–404. [DOI] [PubMed] [Google Scholar]
- 2.Okabe Y, Medzhitov R. Tissue-specific signals control reversible program of localization and functional polarization of macrophages. Cell. 2014;157:832–844. [DOI] [PMC free article] [PubMed] [Google Scholar]
- 3.Buscher K, Ehinger E, Gupta P, Pramod AB, Wolf D, Tweet G, Pan C, Mills CD, Lusis AJ, Ley K. Natural variation of macrophage activation as disease-relevant phenotype predictive of inflammation and cancer survival. Nature Communications. 2017;8:16041. [DOI] [PMC free article] [PubMed] [Google Scholar]
- 4.Ensan S, Li A, Besla R, Degousee N, Cosme J, Roufaiel M, Shikatani EA, El-Maklizi M, Williams JW, Robins L, Li C, Lewis B, Yun TJ, Lee JS, Wieghofer P, et al. Self-renewing resident arterial macrophages arise from embryonic CX3CR1(+) precursors and circulating monocytes immediately after birth. Nature Immunology. 2016;17:159–168. [DOI] [PubMed] [Google Scholar]
- 5.Cybulsky MI, Cheong C, Robbins CS. Macrophages and Dendritic Cells: Partners in Atherogenesis. Circulation Research. 2016;118:637–652. [DOI] [PubMed] [Google Scholar]
- 6.Shankman LS, Gomez D, Cherepanova OA, Salmon M, Alencar GF, Haskins RM, Swiatlowska P, Newman AAC, Greene ES, Straub AC, Isakson B, Randolph GJ, Owens GK. KLF4-dependent phenotypic modulation of smooth muscle cells has a key role in atherosclerotic plaque pathogenesis. Nature Medicine. 2015;21:628–637. [DOI] [PMC free article] [PubMed] [Google Scholar]
- 7.Ley K, Miller YI, Hedrick CC. Monocyte and macrophage dynamics during atherogenesis. Arteriosclerosis, Thrombosis, and Vascular Biology. 2011;31:1506–1516. [DOI] [PMC free article] [PubMed] [Google Scholar]
- 8.Cochain C, Zernecke A. Macrophages in vascular inflammation and atherosclerosis. Pflügers Archiv - European Journal of Physiology. 2017;469:485–499. [DOI] [PubMed] [Google Scholar]
- 9.Koltsova EK, Hedrick CC, Ley K. Myeloid cells in atherosclerosis: a delicate balance of anti-inflammatory and proinflammatory mechanisms. Current opinion in lipidology. 2013;24:371–380. [DOI] [PMC free article] [PubMed] [Google Scholar]
- 10.Gordon S, Plüddemann A, Estrada FM. Macrophage heterogeneity in tissues: phenotypic diversity and functions. Immunological Reviews. 2014;262:36–55. [DOI] [PMC free article] [PubMed] [Google Scholar]
- 11.Cochain C, Vafadarnejad E, Arampatzi P, Pelisek J, Winkels H, Ley K, Wolf D, Saliba A-E, Zernecke A. Single-Cell RNA-Seq Reveals the Transcriptional Landscape and Heterogeneity of Aortic Macrophages in Murine Atherosclerosis. Circulation Research. 2018;122:1661–1674. [DOI] [PubMed] [Google Scholar]
- 12.Winkels H, Ehinger E, Vassallo M, Buscher K, Dinh HQ, Kobiyama K, Hamers AAJ, Cochain C, Vafadarnejad E, Saliba A-E, Zernecke A, Pramod AB, Ghosh AK, Anto Michel N, Hoppe N, et al. Atlas of the Immune Cell Repertoire in Mouse Atherosclerosis Defined by Single-Cell RNA-Sequencing and Mass Cytometry. Circulation Research. 2018;122:1675–1688. [DOI] [PMC free article] [PubMed] [Google Scholar]
- 13.Lin J-D, Nishi H, Poles J, Niu X, Mccauley C, Rahman K, Brown EJ, Yeung ST, Vozhilla N, Weinstock A, Ramsey SA, Fisher EA, Loke P. Single-cell analysis of fate-mapped macrophages reveals heterogeneity, including stem-like properties, during atherosclerosis progression and regression. JCI Insight. 4. [DOI] [PMC free article] [PubMed] [Google Scholar]
- 14.Kim K, Shim D, Lee JS, Zaitsev K, Williams JW, Kim K-W, Jang M-Y, Seok Jang H, Yun TJ, Lee SH, Yoon WK, Prat A, Seidah NG, Choi J, Lee S-P, et al. Transcriptome Analysis Reveals Nonfoamy Rather Than Foamy Plaque Macrophages Are Proinflammatory in Atherosclerotic Murine Models. Circulation Research. 2018;123:1127–1142. [DOI] [PMC free article] [PubMed] [Google Scholar]
- 15.Zhang SH, Reddick RL, Piedrahita JA, Maeda N. Spontaneous hypercholesterolemia and arterial lesions in mice lacking apolipoprotein E. Science. 1992;258:468–471. [DOI] [PubMed] [Google Scholar]
- 16.Jung S, Aliberti J, Graemmel P, Sunshine MJ, Kreutzberg GW, Sher A, Littman DR. Analysis of Fractalkine Receptor CX3CR1 Function by Targeted Deletion and Green Fluorescent Protein Reporter Gene Insertion. Molecular and Cellular Biology. 2000;20:4106–4114. [DOI] [PMC free article] [PubMed] [Google Scholar]
- 17.Lindquist RL, Shakhar G, Dudziak D, Wardemann H, Eisenreich T, Dustin ML, Nussenzweig MC. Visualizing dendritic cell networks in vivo. Nature Immunology. 2004;5:1243–1250. [DOI] [PubMed] [Google Scholar]
- 18.Chinrungrueng C, Sequin CH. Optimal adaptive k-means algorithm with dynamic adjustment of learning rate. IEEE transactions on neural networks. 1995;6:157–169. [DOI] [PubMed] [Google Scholar]
- 19.Austyn JM, Gordon S. F4/80, a monoclonal antibody directed specifically against the mouse macrophage. European Journal of Immunology. 1981;11:805–815. [DOI] [PubMed] [Google Scholar]
- 20.McKnight AJ, Macfarlane AJ, Dri P, Turley L, Willis AC, Gordon S. Molecular cloning of F4/80, a murine macrophage-restricted cell surface glycoprotein with homology to the G-protein-linked transmembrane 7 hormone receptor family. The Journal of Biological Chemistry. 1996;271:486–489. [DOI] [PubMed] [Google Scholar]
- 21.Amir ED, Davis KL, Tadmor MD, Simonds EF, Levine JH, Bendall SC, Shenfeld DK, Krishnaswamy S, Nolan GP, Pe’er D. viSNE enables visualization of high dimensional single-cell data and reveals phenotypic heterogeneity of leukemia. Nature Biotechnology. 2013;31:545–552. [DOI] [PMC free article] [PubMed] [Google Scholar]
- 22.Koltsova EK, Garcia Z, Chodaczek G, Landau M, McArdle S, Scott SR, von Vietinghoff S, Galkina E, Miller YI, Acton ST, Ley K. Dynamic T cell-APC interactions sustain chronic inflammation in atherosclerosis. The Journal of Clinical Investigation. 2012;122:3114–3126. [DOI] [PMC free article] [PubMed] [Google Scholar]
- 23.Sommer C, Straehle C, Kothe U, Hamprecht FA. Ilastik: Interactive learning and segmentation toolkit In: 2011 IEEE International Symposium on Biomedical Imaging: From Nano to Macro. Chicago, IL, USA: IEEE; 2011:230–233. [Google Scholar]
- 24.McArdle S, Mikulski Z, Ley K. Live cell imaging to understand monocyte, macrophage, and dendritic cell function in atherosclerosis. The Journal of Experimental Medicine. 2016;213:1117–1131. [DOI] [PMC free article] [PubMed] [Google Scholar]
- 25.McArdle S, Chodaczek G, Ray N, Ley K. Intravital live cell triggered imaging system reveals monocyte patrolling and macrophage migration in atherosclerotic arteries. Journal of Biomedical Optics. 2015;20:26005. [DOI] [PMC free article] [PubMed] [Google Scholar]
- 26.Williams JW, Randolph GJ, Zinselmeyer BH. A Polecat’s View of Patrolling Monocytes. Circulation Research. 2017;120:1699–1701. [DOI] [PMC free article] [PubMed] [Google Scholar]
- 27.Balasubramanian GP, Saber E, Misic V, Peskin E, Shaw M. Unsupervised color image segmentation using a dynamic color gradient thresholding algorithm In: Human Vision and Electronic Imaging XIII.Vol 6806 International Society for Optics and Photonics; 2008:68061H. [Google Scholar]
- 28.Love MI, Huber W, Anders S. Moderated estimation of fold change and dispersion for RNA-seq data with DESeq2. Genome Biology. 2014;15:550. [DOI] [PMC free article] [PubMed] [Google Scholar]
- 29.Ley K, Pramod AB, Croft M, Ravichandran KS, Ting JP. How Mouse Macrophages Sense What Is Going On. Frontiers in Immunology. 2016;7. [DOI] [PMC free article] [PubMed] [Google Scholar]
- 30.Zernecke A, Weber C. Chemokines in Atherosclerosis: Proceedings Resumed. Arteriosclerosis, Thrombosis, and Vascular Biology. 2014;34:742–750. [DOI] [PubMed] [Google Scholar]
- 31.Patzelt J, Verschoor A, Langer HF. Platelets and the complement cascade in atherosclerosis. Frontiers in Physiology. 2015;6. [DOI] [PMC free article] [PubMed] [Google Scholar]
- 32.McArdle S, Buscher K, Ehinger E, Pramod AB, Riley N, Ley K. PRESTO, a new tool for integrating large-scale -omics data and discovering disease-specific signatures. bioRxiv. 2018:302604. [Google Scholar]
- 33.Subramanian A, Tamayo P, Mootha VK, Mukherjee S, Ebert BL, Gillette MA, Paulovich A, Pomeroy SL, Golub TR, Lander ES, Mesirov JP. Gene set enrichment analysis: A knowledge-based approach for interpreting genome-wide expression profiles. Proceedings of the National Academy of Sciences. 2005;102:15545–15550. [DOI] [PMC free article] [PubMed] [Google Scholar]
- 34.Gräbner R, Lötzer K, Döpping S, Hildner M, Radke D, Beer M, Spanbroek R, Lippert B, Reardon CA, Getz GS, Fu Y-X, Hehlgans T, Mebius RE, van der Wall M, Kruspe D, et al. Lymphotoxin β receptor signaling promotes tertiary lymphoid organogenesis in the aorta adventitia of aged ApoE−/− mice. Journal of Experimental Medicine. 2009;206:233–248. [DOI] [PMC free article] [PubMed] [Google Scholar]
- 35.Feig JE, Vengrenyuk Y, Reiser V, Wu C, Statnikov A, Aliferis CF, Garabedian MJ, Fisher EA, Puig O. Regression of Atherosclerosis Is Characterized by Broad Changes in the Plaque Macrophage Transcriptome. PLOS ONE. 2012;7:e39790. [DOI] [PMC free article] [PubMed] [Google Scholar]
- 36.Lee K, Santibanez-Koref M, Polvikoski T, Birchall D, Mendelow AD, Keavney B. Increased expression of fatty acid binding protein 4 and leptin in resident macrophages characterises atherosclerotic plaque rupture. Atherosclerosis. 2013;226:74–81. [DOI] [PMC free article] [PubMed] [Google Scholar]
- 37.Williams JW, Martel C, Potteaux S, Esaulova E, Ingersoll MA, Elvington A, Saunders BT, Huang L-H, Habenicht AJ, Zinselmeyer BH, Randolph GJ. Limited Macrophage Positional Dynamics in Progressing or Regressing Murine Atherosclerotic Plaques-Brief Report. Arteriosclerosis, Thrombosis, and Vascular Biology. 2018;38:1702–1710. [DOI] [PMC free article] [PubMed] [Google Scholar]
- 38.Quintar A, McArdle S, Wolf D, Marki A, Ehinger E, Vassallo M, Miller J, Mikulski Z, Ley K, Buscher K. Endothelial Protective Monocyte Patrolling in Large Arteries Intensified by Western Diet and Atherosclerosis. Circulation Research. 2017;120:1789–1799. [DOI] [PMC free article] [PubMed] [Google Scholar]
- 39.McWhorter FY, Wang T, Nguyen P, Chung T, Liu WF. Modulation of macrophage phenotype by cell shape. Proceedings of the National Academy of Sciences. 2013;110:17253–17258. [DOI] [PMC free article] [PubMed] [Google Scholar]
- 40.Aloisi F Immune function of microglia. Glia. 2001;36:165–179. [DOI] [PubMed] [Google Scholar]
- 41.Barkauskas DS, Evans TA, Myers J, Petrosiute A, Silver J, Huang AY. Extravascular CX3CR1+ Cells Extend Intravascular Dendritic Processes into Intact Central Nervous System Vessel Lumen. Microscopy and Microanalysis. 2013;19:778–790. [DOI] [PMC free article] [PubMed] [Google Scholar]
- 42.Chèvre R, González-Granado JM, Megens RTA, Sreeramkumar V, Silvestre-Roig C, Molina-Sánchez P, Weber C, Soehnlein O, Hidalgo A, Andrés V. High-Resolution Imaging of Intravascular Atherogenic Inflammation in Live MiceNovelty and Significance. Circulation Research. 2014;114:770–779. [DOI] [PubMed] [Google Scholar]
- 43.Anon. The process of macrophage migration promotes matrix metalloproteinase-independent invasion by tumor cells. - PubMed - NCBI [DOI] [PMC free article] [PubMed]
- 44.Rahman K, Vengrenyuk Y, Ramsey SA, Vila NR, Girgis NM, Liu J, Gusarova V, Gromada J, Weinstock A, Moore KJ, Loke P, Fisher EA. Inflammatory Ly6Chi monocytes and their conversion to M2 macrophages drive atherosclerosis regression. The Journal of Clinical Investigation. 2017;127:2904–2915. [DOI] [PMC free article] [PubMed] [Google Scholar]
- 45.Gleissner CA, Shaked I, Erbel C, Böckler D, Katus HA, Ley K. CXCL4 downregulates the atheroprotective hemoglobin receptor CD163 in human macrophages. Circulation Research. 2010;106:203–211. [DOI] [PMC free article] [PubMed] [Google Scholar]
- 46.Alan R, Ezekowitz B, Gordon S. Alterations of Surface Properties by Macrophage Activation: Expression of Receptors for Fc and Mannose-Terminal Glycoproteins and Differentiation Antigens In: Adams DO, Hanna MG, eds. Macrophage Activation. Contemporary Topics in Immunobiology Boston, MA: Springer US; 1984:33–56. [DOI] [PubMed] [Google Scholar]
- 47.Tedgui A, Mallat Z. Cytokines in Atherosclerosis: Pathogenic and Regulatory Pathways. Physiological Reviews. 2006;86:515–581. [DOI] [PubMed] [Google Scholar]
- 48.Trogan E, Feig JE, Dogan S, Rothblat GH, Angeli V, Tacke F, Randolph GJ, Fisher EA. Gene expression changes in foam cells and the role of chemokine receptor CCR7 during atherosclerosis regression in ApoE-deficient mice. Proceedings of the National Academy of Sciences. 2006;103:3781–3786. [DOI] [PMC free article] [PubMed] [Google Scholar]
- 49.Butcher MJ, Herre M, Ley K, Galkina E. Flow Cytometry Analysis of Immune Cells Within Murine Aortas. Journal of Visualized Experiments : JoVE. 2011. [DOI] [PMC free article] [PubMed] [Google Scholar]
- 50.Reich M, Liefeld T, Gould J, Lerner J, Tamayo P, Mesirov JP. GenePattern 2.0. Nature Genetics. 2006;38:500–501. [DOI] [PubMed] [Google Scholar]
- 51.Krämer A, Green J, Pollard J, Tugendreich S. Causal analysis approaches in Ingenuity Pathway Analysis. Bioinformatics (Oxford, England). 2014;30:523–530. [DOI] [PMC free article] [PubMed] [Google Scholar]
- 52.Ray N, McArdle S, Ley K, Acton ST. MISTICA: Minimum Spanning Tree-Based Coarse Image Alignment for Microscopy Image Sequences. IEEE journal of biomedical and health informatics. 2016;20:1575–1584. [DOI] [PMC free article] [PubMed] [Google Scholar]
Associated Data
This section collects any data citations, data availability statements, or supplementary materials included in this article.
Supplementary Materials
Data Availability Statement
All custom image processing algorithms, including those for dynamic color gradient thresholding, centroid-adjusted dancing, and GFP-YFP bleedthrough correction, have been made publicly available and can be accessed on GitHub (https://github.com/saramcardle/Image-Analysis-Scripts). The raw sequencing data for the 18 bulk RNAseq samples passing QC inspection are available on the NCBI Gene Expression Omnibus repository (GSE137819, https://www.ncbi.nlm.nih.gov/geo/query/acc.cgi?acc=GSE137819). All other data and methods used in the analysis, and materials used to conduct the research will be made available to any researcher for the purpose of reproducing the results or replicating the procedures. All data, methods, materials are available upon personal request at the La Jolla Institute for Immunology, CA, USA (contact: kley@lji.org).