

Abstract
Inflammatory bowel diseases (IBDs) are conditions that still pose significant problems. A third of the patients are either misdiagnosed or a proper diagnosis of Crohn’s disease (CD) or ulcerative colitis (UC) cannot be made. We need new biomarkers, so that we can offer patients the best treatment and keep the disease in an inactive state for as long as possible. Alterations in metabolic profiles have been incriminated in the pathophysiology of IBD. The aim of the present study was to identify molecules that could serve as biomarkers for a positive diagnosis of IBD as well as to discriminate UC from colonic CD. Twenty-two patients with active colonic IBD (UC = 17, CD = 5) and 24 age- and gender-matched healthy controls were enrolled. Plasma lipid and metabolic profiles were quantified using ultra-high-performance liquid chromatography combined with mass spectrometry. Univariate and multivariate statistical tests were employed. Six lipid species and 7 metabolites were significantly altered in IBD patients compared to healthy controls, with the majority belonging to glycerophospholipid, linoleic acid, and sphingolipid metabolisms. Five lipid species and only 1 metabolite were significantly increased in UC compared to CD. This preliminary study suggests that lipid and metabolic profiling of serum can become diagnostic tools for IBD. In addition, they can be used to differentiate between CD and UC.
Keywords: Crohn’s disease, ulcerative colitis, inflammatory bowel disease, IBD, metabolomics, lipidomics
INTRODUCTION
Inflammatory bowel diseases (IBDs) are a group of chronic immune-mediated disorders characterized by inflammation of the digestive tract with a relapsing-remitting pattern. Crohn’s disease (CD) and ulcerative colitis (UC) may affect different digestive tract segments, having different clinical manifestations, prognoses, and treatments. However, up to 30% of patients with IBD are either misdiagnosed or a proper diagnosis cannot be made even with the current available armamentarium [1,2].
New biomarkers and techniques that enable a better diagnosis of IBD are expected. The current biomarkers – erythrocyte sedimentation rate (ESR), C-reactive protein (CRP), fecal calprotectin or fecal lactoferrin – each has its limitations, the most important being the lack of specificity [2].
Metabolomics deals with the analysis of endogenous and exogenous metabolites and generates molecular fingerprints that reflect specific cellular processes. Different biological samples may be tested, but the most commonly used are plasma or serum. The obtained data reflect the host’s metabolism.
The use of diagnostic metabolomics has recently become a very promising idea. It has been applied in biomarker detection and has yielded valuable information for diabetes, cardiovascular diseases, rheumatoid arthritis, and multiple sclerosis [3]. There are several thousand metabolites in the tissues and fluids of living organisms and most of these have a well-defined function and could be used for diagnostic or therapeutic purposes.
Recent studies have identified multiple molecules that could be validated as novel biomarkers of IBD [4-6]. Inflammation acts through many metabolic pathways and also involves signaling molecules. These are important structural components of cell membranes and are involved in cell differentiation and proinflammatory cytokine release [7]. Sphingolipids and their metabolites, such as sphingosine-1-phosphate, also act as signaling mediators in apoptosis, proliferation, response to stress, necrosis, inflammation, autophagy, senescence, and differentiation [8-13]. Moreover, ceramides, a family of waxy lipid molecules, have been reported to be involved in apoptosis, cell growth arrest, differentiation, cell senescence, cell migration, adhesion, and autophagy [7,14]. In a previous preliminary report, we investigated the potential of lipid profiling to differentiate IBD patients from healthy individuals [15]. After applying univariate and multivariate analysis, 6 molecules were found to be statistically significant in discriminating the patients from healthy controls [15].
We therefore designed this study to identify molecules that could help in diagnosing IBD. Furthermore, because of clinical, endoscopic, and histopathological overlapping between UC and colonic CD, our second aim was to identify molecules that discriminate between the two IBD types.
MATERIALS AND METHODS
Patient data
Blood samples were collected from consecutive patients admitted to a tertiary referral center in Cluj-Napoca, Romania. All included patients had active left-sided UC, extensive UC, or active colonic CD. The study was approved by the local ethical review board (approval no. 146/20.04.2016) and written consent was obtained from all enrolled patients.
The diagnosis of IBD was established using clinical, serological, endoscopic, and histological data.
The patients excluded from the study were those with proctitis or indeterminate colitis, patients under 18 or over 70 years old, as well as those having a history of neoplasia, infectious diseases, diabetes mellitus, debilitating mental diseases, primary hyperlipidemia or any familial lipid disorder, liver or renal failure, or structural damage of the gastrointestinal tract.
Concomitant medication either prescribed for IBD or for other conditions was taken into consideration and these cases were removed from the statistical analysis.
Sample collection and extraction protocol
Blood samples were collected after overnight fasting. After centrifugation at 4000 rpm for 10 min, the serum was separated and stored in Eppendorf tubes at -80°C. When needed, the serum samples were thawed at room temperature and vortexed for 20 sec.
For metabolic analysis, aliquots of 200 µL were mixed with 800 µL MeOH 98% and vortexed again for 20 sec to precipitate proteins. After that, samples were ultra-sonicated in a water bath for 5 min, then kept at -20°C for at least 5 min to precipitate proteins and then centrifuged at 5000 rpm for 10 min. The resulting supernatant was collected and filtered using a Nylon filter (0.2 µm).
For lipid analysis, aliquots of 100 µL were mixed with 200 µl MeOH and vortexed again for 20 sec to precipitate proteins. A volume of 1.66 mL chloroform was added and vortexed for 20 sec, then 100 µL of water was added to separate the two phases, vortexed for 20 sec and centrifuged at 10000 rpm for 10 min. The chloroform layer was collected and evaporated under nitrogen and the residue was dissolved in 500 µL isopropanol: acetonitrile (90:10), vortexed for 20 sec, sonicated in a water bath for 15 min, and filtered using a PTFE filter (0.2 µm).
To ensure the quality control (QC) and reproducibility of the data, two pooled samples from all healthy control samples (QCC) and all patient samples (QCP) were similarly prepared and placed as every sixth sample.
Ultra-high-performance liquid chromatography (UHPLC)-quadrupole time-of-flight (QTOF)-electrospray ionization (ESI+)-mass spectrometry (MS) analysis
The separation was done in a Thermo Scientific UHPLC UltiMate 3000 system (Thermo Fisher Scientific, MA, US), equipped with a Dionex quaternary pump delivery system, using a C18 column [Acclaim Dionex] (5 µm, 120Å, 2.1×100 mm).
For metabolic analysis, run-to-run time was set at 20 min using a gradient program with two mobile phases (A - H2O + 0.1% formic acid and B - acetonitrile + 0.1% formic acid). The gradient for phase A was 5% to 15% (0 to 3 min), 15% to 50% (3 to 6 min), and 50% to 95% (6 to 9 min), isocratic until the 15th minute, then decreased from 95% to 5% (15 to 20 min). The injected volume was 5 µL, column temperature was 40°C, and the flow was set at 0.5 mL/min.
For lipid analysis, run-to-run time was set at 28 min using a gradient program with two mobile phases (A – acetonitrile: H2O (60:40) + 0.1% formic acid + 10 mM ammonium formate and B - isopropanol: acetonitrile (90:10) + 0.1% formic acid + 10 mM ammonium formate). The gradient for phase A was 75% to 50% (0 to 4 min), then 50% to 3% (4 to 19 min), isocratic at 23 min, then increased from 3% to 75% (23 to 28 min). The injected volume was 5 µL, column temperature was 55°C, and the flow was set at 0.26 mL/min.
Mass spectrometry was performed using a detection system provided by MaXis Impact QTOF MS version 2012 (Bruker Daltonics, MA, US). The QTOF-ESI+-MS parameters were: ionization mode ESI positive, MS calibration with sodium formate, capillary voltage 3500 V, drying gas flow 12 L/min, and drying temperature 300°C.
Instrument control and data processing were done using specific software (Chromeleon, TofControl 3.2, HyStar 3.2, and Compass Data Analysis 4.2, provided by Bruker Daltonics).
Data processing and statistics
The base peak chromatograms were processed using Compass Data Analysis 4.2 with the Find Molecular Feature (FMF). Profile Analysis 2.1 (Bruker Daltonics) software was then used to generate a matrix based on the FMF. Parameters such as time alignment, spectral background extraction, MS recalibration, normalization by sum of bucket values in analysis, and 80% bucket filtration were used. For the multivariate and univariate statistical analysis, the Profile Analysis as well the MetaboAnalyst online software (https://www.metaboanalyst.ca/home.xhtml) were used on the final matrix.
The unsupervised multivariate principal component analysis (PCA) was first used to discriminate between the experimental groups (by scores and loadings) and to detect and eliminate the outliers. Then, partial least squares-discriminant analysis (PLS-DA) was performed. The relevance of each metabolite was quantified using the variable importance in projection (VIP) score and this was subsequently used to identify the putative biomarkers. Leave-one-out cross-validation (LOOCV) was performed on the PLS-DA model to find the most appropriate number of PLS components, minimize the risk of overfitting, and validate the results.
The MetaboAnalyst software was used to perform univariate analysis, to calculate the fold change (FC), and t-test p-values. Receiver operating characteristic curves (ROCs) and heatmaps, which can provide an intuitive visualization of the differences, were generated.
Molecule identification was made according to the Human Metabolome Database (http://www.hmdb.ca/) and Lipidomic Gateway (http://www.lipidmaps.org).
RESULTS
Patient data
All included patients were diagnosed with left or extensive UC (n = 17, female: male = 6:11, mean age 39 years) or colonic CD (n = 5, female: male = 3:2, mean age 43 years). The control group included 24 subjects (female: male = 14:10, mean age 29 years). All patients included in the study had active disease, confirmed by colonoscopy with targeted biopsy. The patients diagnosed with UC had an average clinical severity of 7.6, assessed using the UC Disease Activity Index (UCDAI) and an average endoscopic severity of 2.3, assessed using the Mayo Score. Patients with colonic CD had an average clinical severity of 182, assessed using the CD Activity Index (CDAI) and an average endoscopic severity of 12, using the Simple Endoscopic Score for CD (SES-CD).
Lipid profiling of colonic IBDs
Tetracosanoic acid, phosphatidylcholine (PC), lysophosphatidylcholine (LPC), sphingomyelin (SM), and diacylglycerol were significantly lower in patients with colonic IBD than in healthy controls, as previously reported [15].
The comparison between the UC and CD subgroups was made using multivariate and univariate statistical analysis (Figure 1). The cross-validation of PLS-DA showed that Q2 and R2 values were higher than 0.5 and the accuracy was higher than 0.85. The VIP scores that discriminated between the UC and colonic CD subgroups are shown in Figure 2. A total of 15 molecules with VIP values above 5 were identified, being significantly different between the colonic CD and UC subgroups.
FIGURE 1.
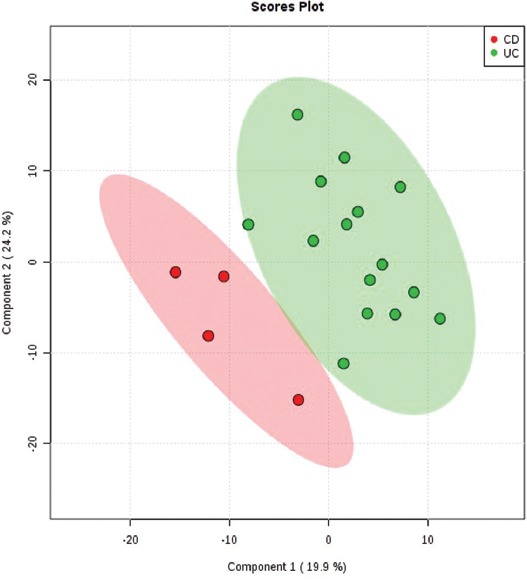
The partial least squares-discriminant analysis (PLS-DA) 2D scores showing good discrimination between the ulcerative colitis [UC] (green) and colonic Crohn’s disease [CD] (red) subgroups. The shaded areas indicate the 95% confidence regions.
FIGURE 2.
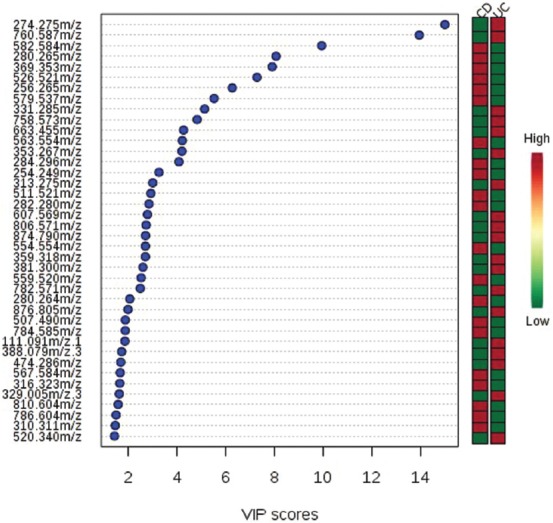
Identified mass-to-charge ratio (m/z) with the variable importance in projection (VIP) scores that discriminate between ulcerative colitis (UC) and colonic Crohn’s disease (CD) subgroups. The higher the VIP score, the better the capacity to discriminate between the two subgroups. The mini heatmap on the right indicates their concentration variations within the two subgroups.
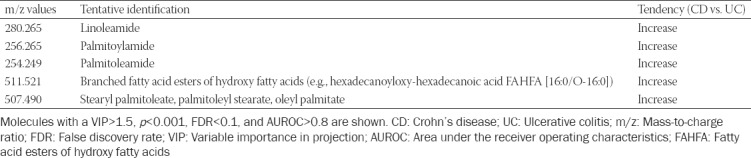
The univariate statistical analysis of CD and UC patients, considering a VIP > 1.5, p < 0.001, and an AUROC > 0.8, revealed 5 molecules that were significantly different between the two subgroups, with the corresponding mass-to-charge ratio (m/z) of 280.265, 256.265, 254.249, 511.521, and 507.490. Thus, linoleamide, palmitic amide levels, branched fatty esters of hydroxyl fatty acids (FAHFAs) as well as three isomers of hexadecanoic acid (stearyl palmitoleate, palmitoleyl stearate, and oleyl palmitate) were higher in patients with colonic CD than in those with UC (Table 1).
TABLE 1.
Lipidomic differences between colonic CD and UC patients
Metabolic profile to discriminate between healthy controls (M) and colonic IBD patients (P)
The final data matrix obtained using FMF was processed by MetaboAnalyst 3.0 and the PCA and PLS-DA plots were compared (Figure 3). The 3D-PCA plot showed that the healthy subjects (M) as well as the patient (P) groups were not clustered significantly. The discrimination was characterized by a variability of 51.4% for PC1, 17% for PC2, and 12.4% for PC3 (Figure 3A). Figure 3B includes the 3D-PLS-DA score plot for the first 3 components (PC1 at 28.5%, PC2 at 37.8%, and PC3 at 6.3%) with significant separation between control and IBD groups.
FIGURE 3.
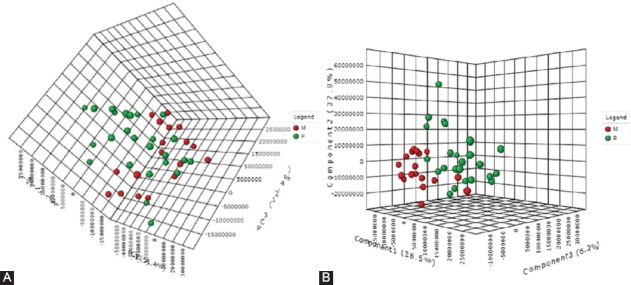
(A) Principal component analysis (PCA) 3D score plot after outlier removal. The discrimination was characterized by a variability of 51.4% for PC1, 17% for PC2, and 12.4% for PC3. (B) Partial least squares-discriminant analysis (PLS-DA) 3D score plot to discriminate between colonic inflammatory bowel disease (IBD) patients (P group [green]) and healthy controls (M group [red]). The discrimination was characterized by a variability of 28.5% for PC1, 37.8% for PC2, and 6.3% for PC3 with significant separation between control and IBD groups.
The PLS-DA – cross-validation data showed cumulative values of R2 = 79.2% and Q2 = 53.6% where R2 (sum of squares captured by the model) indicates the variation shown by all 5 components in the model and Q2 (cross-validated R2) shows the best accuracy of the model prediction when the 5 components were considered (Figure 4A). These score plots and values indicated good clustering and demonstrated a good distinction between the two groups. From the PLS-DA loading values, the compounds with VIP values above 1.2 were selected, as shown in Figure 4B.
FIGURE 4.
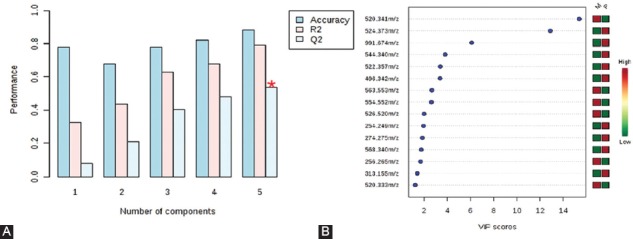
(A) Plots obtained by cross-validation method (leave-one-out cross-validation [LOOCV]) applied on partial least squares-discriminant analysis (PLS-DA) data. The PLS-DA – cross-validation data showed cumulative values of R2 = 79.2% and Q2 = 53.6%, indicating good clustering, and demonstrated a good distinction between the two groups. (B) Variable importance in projection (VIP) values above 1.2 derived from PLS-DA, to compare the variability of 15 individual molecules between healthy controls (M group) and colonic inflammatory bowel disease (IBD) patients (P group). Corresponding mass-to-charge ratio (m/z) are shown on the left part of the figure. The mini-heatmap (green to red colors) shows the relationship between the M and P values for each molecule.
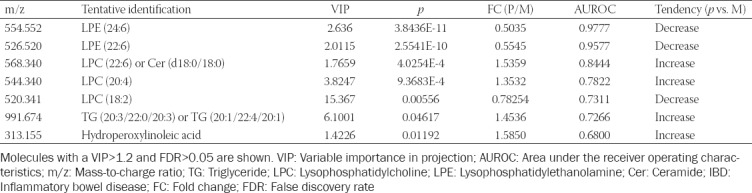
Out of the 13 molecules with VIP scores above 1.2, 7 were found to be statistically significant in discriminating colonic IBD patients from controls, as shown in Table 2.
TABLE 2.
Metabolic differences between healthy subjects (M) and colonic IBD patients (P)
Using Euclidean hierarchical clustering, a dendrogram presenting the sample grouping is displayed in Figure 5. A good clustering was observed between the patient and healthy control group.
FIGURE 5.
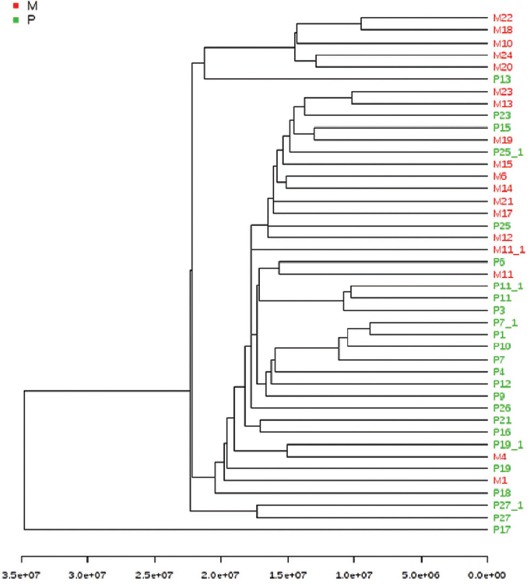
The cluster analysis using Euclidean distance and single clustering algorithm. A good clustering was observed between the patient group (green) and healthy group (red).
Metabolic profile to discriminate between UC and colonic CD patients
Similarly to the comparison between the healthy subjects and colonic IBD patients, the UC and CD subgroups were compared using multivariate and univariate statistical analysis.
Clustering and outliers were analyzed using PCA. The discrimination was characterized by 57.5% for PC1, 16% for PC2, and 6.4% for PC3 between UC and CD (Figure 6A). PLS-DA showed discriminations of 30.1% on PC1, 41.2% on PC2, and 5.5% on PC3 (Figure 6B). The cross-validation of PLS-DA showed that Q2 was negative, R2 was around 0.45, and the accuracy was 0.6 (Figure 7A).
FIGURE 6.
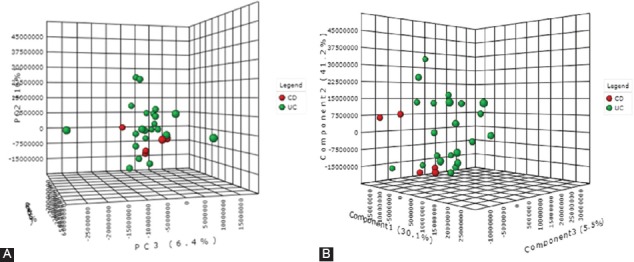
(A) The 3D score plot of principal component analysis [PCA] when comparing colonic Crohn’s disease (CD) and ulcerative colitis (UC) patients. The discrimination was characterized by 57.5% for PC1, 16% for PC2, and 6.4% for PC3. (B) Partial least squares-discriminant analysis (PLS-DA), when comparing colonic CD and UC patients, showed a discrimination of 30.1% for PC1, 41.2% for PC2, and 5.5% for PC3.
FIGURE 7.
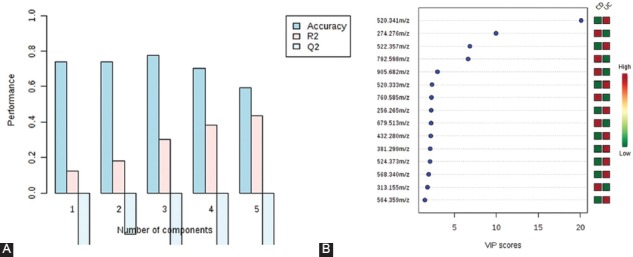
(A) Partial least squares-discriminant analysis (PLS-DA) – cross-validation method (leave-one-out cross-validation [LOOCV]) showing that Q2 was negative, R2 was around 0.45, and the accuracy was 0.6. (B) Variable importance in projection [VIP] scores resulting from PLS-DA for colonic Crohn’s disease (CD) vs. ulcerative colitis (UC) group. Corresponding mass-to-charge ratio (m/z) are shown on the left part of the figure. The higher the VIP score, the better the discriminatory potential.
The p, FC, and FDR values along with AUROC were calculated. However, given the low number of patients with CD and the low R2 and Q2 values, these did not fit within the confidence interval. Although 15 molecules had good FC values and their VIP scores were higher than 1.4 (Figure 7B), their p and FDR values did not fit the condition to be <0.05.
Regarding ROC analysis, from all 15 molecules selected from the PLS-DA, only 1 had an AUROC value higher than 0.8.
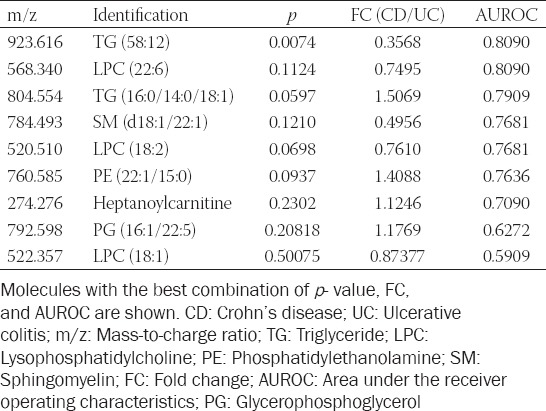
The compounds that had the closest acceptable values to discriminate between the two subgroups were 923.616 (triglycerides [TG] [58:12]), 568.340 (LPC [22:6]/ceramide [Cer] [d18:0/18:0]), 520.341 (LPC [18:2]), 274.276 (heptanoylcarnitine), and 760.585 (phosphatidylethanolamine [PE] (22:1[13Z]/15:0)/PC(18:1[9Z]/16:0)). However, only one was significantly increased (TG [58:12]) in UC patients compared to colonic CD patients (Table 3).
TABLE 3.
Metabolic differences between UC and colonic CD patients
In parallel, using a serum metabolic pathway analysis, we obtained an overview of the possible pathways involved in IBD. This revealed that the glycerophospholipid and sphingolipid metabolism seem to be mainly involved. To discriminate colonic CD from UC subgroup, the match status was 3/39 for glycerophospholipid (p < 0.01) and 1/25 for sphingolipid metabolism (p = 0.04).
DISCUSSION
When comparing IBD patients to healthy subjects, the former have lower PC and LPC levels [15]. The two lipid groups along with PE and lysophosphatidylethanolamines (LPE) are virtually found in the cell membranes of all organisms and play a role in cellular signaling, division, apoptosis, and inflammation. PCs and LPCs act as a hydrophilic barrier in the bowel and do not allow harmful compounds to come into contact with the mucosal cells. Patients with UC seem to have less PCs in their intestinal mucus [16]. This could be a factor in the development of the disease. Sustained inflammation leading to compromised integrity of the intestinal mucosal membrane and digestive loss could account for the lower levels of PC. However, tumor necrosis factor-α (TNF-α) signaling, activation of nuclear factor kappa-light-chain-enhancer of activated B cells (NF-κB), mitogen-activated protein kinase (MAPK) pathway, and peroxisome proliferator-activated receptor (PPAR) signaling seem to be implicated as well [17]. Several authors have found decreases in phospholipid levels in patients with IBD [18-20]. This, however, contrasts with the findings of Fan et al., who did not find any association between PC and IBD [21].
SM is a type of sphingolipid found in cell membranes that has similar functions to PC. Drugs that target specific sphingolipid receptors have been developed, leading to the sequestration of lymphocytes away from sites of chronic inflammation [22]. Marked differences in sphingolipid metabolism have been reported, with metabolites being decreased in patients with IBD [19-21,23]. These lower values seem to be a consequence of the combined action of TNF-α, NF-κB, and interferon gamma (IFN-γ), which activate sphingomyelinases [24-26]. Interestingly enough, although the lipid metabolism is affected in both patients with UC and those with CD, SM appears to be significantly decreased only in patients with UC [20,23].
We previously reported that cholesteryl esters show higher values in patients with colonic IBD than in healthy subjects [15]. These changes could be explained by lipid mobilization or by increased intestinal permeability.
Fatty acid amides seem to have a role in differentiating UC from colonic CD. These molecules play a role in inflammation, intracellular signaling, pain, immune function, reproduction, and appetite [27] and appear to attenuate colitis [28].
Stearyl palmitoleate, palmitoleyl stearate, and oleyl palmitate are ester isomers with the same mass and are at the base of branched FAHFAs. In a similar manner to fatty acid amides, FAHFAs protect against colitis by regulating the enteric immune system and preventing mucosal damage [29]. We have shown that both fatty acid amides and FAHFAs are increased in CD as opposed to UC. This might be related to the more profound inflammatory changes encountered in the former group.
We have also shown that the main discriminant molecules between healthy subjects and those with colonic IBD are LPC, LPE, and ceramides. While some variants of LPCs and ceramides are increased, LPE is decreased. An explanation for this is the increased turnover of LPE to produce LPC, through S-adenosylmethionine methylation [17,30].
In this study, while LPC (20:4) and LPC (22:6) were increased in patients with IBD, LPC (18:2) was decreased. This is because of an inverse relationship between the two, as previously stated [31]. The pro-inflammatory activity of saturated LPCs (18:2) is antagonized by the actions of polyunsaturated LPCs, (20:4) which are anti-inflammatory lipid mediators.
From a diagnostic standpoint, while LPE and ceramides had a very good discriminatory potential in our colonic IBD patients, with an AUROC of over 0.8, LPC had a more modest one, with an AUROC between 0.7 and 0.8.
Hydroperoxylinoleic acid (HPLA), one of the primary products of major polyunsaturated fatty acids, also showed higher values in our patients with IBD than in healthy subjects. HPLA is part of the biochemical cascade that leads to the formation of pro-inflammatory eicosanoids. As previously reported, this cascade is overactivated in patients with IBD; therefore, more HPLA is produced [32].
In this metabolomic study, we showed higher levels of TG in patients with colonic IBD compared to healthy subjects, a finding that was reported in previous studies as well [33-36]. Interestingly, TG seems to be elevated more in men than in women [36]. TG levels are regulated by apolipoprotein C-III. The hypertriglyceridemia encountered in inflammatory states is caused by increased lipoprotein production and decreased lipoprotein clearance. In addition, anti-TNF treatment may influence TG as well as cholesterol levels [37,38]. In our study, although we included patients on anti-TNFs, all of them were at the start of the therapy. Therefore, the changes in TG levels were solely due to the underlying IBD.
The comparison of the metabolic profiles of UC and colonic CD yielded only modest results. This is because of the low number of subjects included in the colonic CD subgroup. A single molecule (TG [58:12]) was significantly different between UC and colonic CD subgroup, with an AUROC over 0.8, indicating a good discriminatory potential.
To the best of our knowledge, this is the first study that has shown a significant difference between UC and colonic CD concerning fatty acids and their derivatives. Determining serum markers that allow the diagnosis and monitoring of patients with IBD is extremely important. Avoiding repeated endoscopic examinations in these patients reduces unnecessary costs, procedural risks, and the psychological impact of these procedures on patients.
The major limitation to our study is the low number of included patients. To achieve maximum diagnostic power, we included only patients in an active state of the disease so that eventual molecular changes could be as obvious as possible. In addition, we excluded patients with proctitis, as the limited extent of the disease does not translate to marked biochemical changes. However, these criteria, as well as the reduced prevalence of IBD in our country, have seriously limited the number of enrolled subjects in the study.
A supplementary analysis on disease pattern and severity or type of medications used among different subgroups of patients is possible but with a larger sample size. Therefore, our results need to be validated in larger, well-designed studies with comprehensively assessed clinical (e.g., medication and comorbidities) and dietary factors.
CONCLUSION
This preliminary study indicates that serum lipid and metabolic profiling has a good potential to detect IBD patients noninvasively, as well as to differentiate between colonic CD and UC. These results contribute to our understanding of the pathophysiological mechanisms underlying colonic CD and UC.
ACKNOWLEDGMENTS
The authors would like to sincerely thank Horia Ştefănescu for his assistance in writing the manuscript and Andreea Benea for her contribution in preparing the biochemical samples.
Footnotes
Conflict of interest statement: The authors declare no conflict of interests
REFERENCES
- 1.Tontini GE, Vecchi M, Pastorelli L, Neurath MF, Neumann H. Differential diagnosis in inflammatory bowel disease colitis:State of the art and future perspectives. World J Gastroenterol. 2015;21(1):21–46. doi: 10.3748/wjg.v21.i1.21. https://doi.org/10.3748/wjg.v21.i1.21. [DOI] [PMC free article] [PubMed] [Google Scholar]
- 2.Chang S, Malter L, Hudesman D. Disease monitoring in inflammatory bowel disease. World J Gastroenterol. 2015;21(40):11246–59. doi: 10.3748/wjg.v21.i40.11246. https://doi.org/10.3748/wjg.v21.i40.11246. [DOI] [PMC free article] [PubMed] [Google Scholar]
- 3.Yoshida M, Hatano N, Nishiumi S, Irino Y, Izumi Y, Takenawa T, et al. Diagnosis of gastroenterological diseases by metabolome analysis using gas chromatography-mass spectrometry. J Gastroenterol. 2012;47:9–20. doi: 10.1007/s00535-011-0493-8. https://doi.org/10.1007/s00535-011-0493-8. [DOI] [PubMed] [Google Scholar]
- 4.Andersson E, Bergemalm D, Kruse R, Neumann G, D'Amato M, Repsilber D, et al. Subphenotypes of inflammatory bowel disease are characterized by specific serum protein profiles. PLoS One. 2017;12(10):e0186142. doi: 10.1371/journal.pone.0186142. https://doi.org/10.1371/journal.pone.0186142. [DOI] [PMC free article] [PubMed] [Google Scholar]
- 5.Dawiskiba T, Deja S, Mulak A, Ząbek A, Jawień E, Pawełka D, et al. Serum and urine metabolomic fingerprinting in diagnostics of inflammatory bowel diseases. World J Gastroenterol. 2014;20(1):163–74. doi: 10.3748/wjg.v20.i1.163. https://doi.org/10.3748/wjg.v20.i1.163. [DOI] [PMC free article] [PubMed] [Google Scholar]
- 6.Williams HR, Willsmore JD, Cox IJ, Walker DG, Cobbold JF, Taylor-Robinson SD, et al. Serum metabolic profiling in inflammatory bowel disease. Dig Dis Sci. 2012;57(8):2157–65. doi: 10.1007/s10620-012-2127-2. https://doi.org/10.1007/s10620-012-2127-2. [DOI] [PubMed] [Google Scholar]
- 7.Sewell GW, Hannun YA, Han X, Koster G, Bielawski J, Goss V, et al. Lipidomic profiling in Crohn's disease:Abnormalities in phosphatidylinositols, with preservation of ceramide, phosphatidylcholine and phosphatidylserine composition. Int J Biochem Cell Biol. 2012;44(11):1839–46. doi: 10.1016/j.biocel.2012.06.016. https://doi.org/10.1016/j.biocel.2012.06.016. [DOI] [PMC free article] [PubMed] [Google Scholar]
- 8.Snider AJ, Orr Gandy KA, Obeid LM. Sphingosine kinase:Role in regulation of bioactive sphingolipid mediators in inflammation. Biochimie. 2010;92:707–15. doi: 10.1016/j.biochi.2010.02.008. https://doi.org/10.1016/j.biochi.2010.02.008. [DOI] [PMC free article] [PubMed] [Google Scholar]
- 9.Hetz CA, Hunn M, Rojas P, Torres V, Leyton L, Quest AF, et al. Caspase-dependent initiation of apoptosis and necrosis by the Fas receptor in lymphoid cells:Onset of necrosis is associated with delayed ceramide increase. J Cell Sci. 2002;115(Pt 23):4671–83. doi: 10.1242/jcs.00153. https://doi.org/10.1242/jcs.00153. [DOI] [PubMed] [Google Scholar]
- 10.Venable ME, Lee JY, Smyth MJ, Bielawska A, Obeid LM. Role of ceramide in cellular senescence. J Biol Chem. 1995;270(51):30701–8. doi: 10.1074/jbc.270.51.30701. https://doi.org/10.1074/jbc.270.51.30701. [DOI] [PubMed] [Google Scholar]
- 11.Lavieu G, Scarlatti F, Sala G, Carpentier S, Levade T, Ghidoni R, et al. Regulation of autophagy by sphingosine kinase 1 and its role in cell survival during nutrient starvation. J Biol Chem. 2006;281(13):8518–27. doi: 10.1074/jbc.M506182200. https://doi.org/10.1074/jbc.m506182200. [DOI] [PubMed] [Google Scholar]
- 12.Spiegel S, Milstien S. Sphingosine 1-phosphate, a key cell signaling molecule. J Biol Chem. 2002;277:25851–4. doi: 10.1074/jbc.R200007200. https://doi.org/10.1074/jbc.r200007200. [DOI] [PubMed] [Google Scholar]
- 13.Hannun YA, Obeid LM. The ceramide-centric universe of lipid-mediated cell regulation:Stress encounters of the lipid kind. J Biol Chem. 2002;277:25847–50. doi: 10.1074/jbc.R200008200. https://doi.org/10.1074/jbc.r200008200. [DOI] [PubMed] [Google Scholar]
- 14.Hannun YA, Obeid LM. Principles of bioactive lipid signalling:Lessons from sphingolipids. Nat Rev Mol Cell Biol. 2008;9:139–50. doi: 10.1038/nrm2329. https://doi.org/10.1038/nrm2329. [DOI] [PubMed] [Google Scholar]
- 15.Tefas C, Socaciu C, Moraru C, Tanţău M. Lipidomic signatures of colonic inflammatory bowel diseases:A pilot study. J Gastrointestin Liver Dis. 2019;28:246–7. doi: 10.15403/jgld-188. https://doi.org/10.15403/jgld-188. [DOI] [PubMed] [Google Scholar]
- 16.Ehehalt R, Wagenblast J, Erben G, Lehmann WD, Hinz U, Merle U, et al. Phosphatidylcholine and lysophosphatidylcholine in intestinal mucus of ulcerative colitis patients. A quantitative approach by nanoElectrospray-tandem mass spectrometry. Scand J Gastroenterol. 2004;39(8):737–42. doi: 10.1080/00365520410006233. https://doi.org/10.1080/00365520410006233. [DOI] [PubMed] [Google Scholar]
- 17.Schneider H, Braun A, Füllekrug J, Stremmel W, Ehehalt R. Lipid based therapy for ulcerative colitis-modulation of intestinal mucus membrane phospholipids as a tool to influence inflammation. Int J Mol Sci. 2010;11:4149–64. doi: 10.3390/ijms11104149. https://doi.org/10.3390/ijms11104149. [DOI] [PMC free article] [PubMed] [Google Scholar]
- 18.Bjerrum JT, Nielsen OH, Hao F, Tang H, Nicholson JK, Wang Y, et al. Metabonomics in ulcerative colitis:Diagnostics, biomarker identification, and insight into the pathophysiology. J Proteome Res. 2010;9(2):954–62. doi: 10.1021/pr9008223. https://doi.org/10.1021/pr9008223. [DOI] [PubMed] [Google Scholar]
- 19.Bjerrum JT, Steenholdt C, Ainsworth M, Nielsen OH, Reed MA, Atkins K, et al. Metabonomics uncovers a reversible proatherogenic lipid profile during infliximab therapy of inflammatory bowel disease. BMC Med. 2017;15(1):184. doi: 10.1186/s12916-017-0949-7. https://doi.org/10.1186/s12916-017-0949-7. [DOI] [PMC free article] [PubMed] [Google Scholar]
- 20.Scoville EA, Allaman MM, Brown CT, Motley AK, Horst SN, Williams CS, et al. Alterations in lipid, amino acid, and energy metabolism distinguish Crohn's disease from ulcerative colitis and control subjects by serum metabolomic profiling. Metabolomics. 2018;14(1):17. doi: 10.1007/s11306-017-1311-y. https://doi.org/10.1007/s11306-017-1311-y. [DOI] [PMC free article] [PubMed] [Google Scholar]
- 21.Fan F, Mundra PA, Fang L, Galvin A, Moore XL, Weir JM, et al. Lipidomic profiling in inflammatory bowel disease:Comparison between ulcerative colitis and Crohn's disease. Inflamm Bowel Dis. 2015;21(7):1511–8. doi: 10.1097/MIB.0000000000000394. https://doi.org/10.1097/mib.0000000000000394. [DOI] [PubMed] [Google Scholar]
- 22.Sandborn WJ, Feagan BG, Wolf DC, D'Haens G, Vermeire S, Hanauer SB, et al. Ozanimod induction and maintenance treatment for ulcerative colitis. N Engl J Med. 2016;374(18):1754–62. doi: 10.1056/NEJMoa1513248. https://doi.org/10.1056/nejmoa1513248. [DOI] [PubMed] [Google Scholar]
- 23.Kolho KL, Pessia A, Jaakkola T, de Vos WM, Velagapudi V. Faecal and serum metabolomics in paediatric inflammatory bowel disease. J Crohns Colitis. 2017;11(3):321–34. doi: 10.1093/ecco-jcc/jjw158. https://doi.org/10.1093/ecco-jcc/jjw158. [DOI] [PubMed] [Google Scholar]
- 24.Bock J, Liebisch G, Schweimer J, Schmitz G, Rogler G. Exogenous sphingomyelinase causes impaired intestinal epithelial barrier function. World J Gastroenterol. 2007;13(39):5217–25. doi: 10.3748/wjg.v13.i39.5217. https://doi.org/10.3748/wjg.v13.i39.5217. [DOI] [PMC free article] [PubMed] [Google Scholar]
- 25.Kim MY, Linardic C, Obeid L, Hannun Y. Identification of sphingomyelin turnover as an effector mechanism for the action of tumor necrosis factor alpha and gamma-interferon. Specific role in cell differentiation. J Biol Chem. 1991;266(5):484–9. [PubMed] [Google Scholar]
- 26.Schütze S, Potthoff K, Machleidt T, Berkovic D, Wiegmann K, Krönke M, et al. TNF activates NF-kappa B by phosphatidylcholine-specific phospholipase C-induced “acidic”sphingomyelin breakdown. Cell. 1992;71(5):765–76. doi: 10.1016/0092-8674(92)90553-o. https://doi.org/10.1016/0092-8674(92)90553-o. [DOI] [PubMed] [Google Scholar]
- 27.Tan B, Bradshaw HB, Rimmerman N, Srinivasan H, Yu YW, Krey JF, et al. Targeted lipidomics:Discovery of new fatty acyl amides. AAPS J. 2006;8(3):E461–5. doi: 10.1208/aapsj080354. https://doi.org/10.1208/aapsj080354. [DOI] [PMC free article] [PubMed] [Google Scholar]
- 28.Leinwand KL, Gerich ME, Hoffenberg EJ, Collins CB. Manipulation of the endocannabinoid system in colitis:A Comprehensive review. Inflamm Bowel Dis. 2017;23:192–9. doi: 10.1097/MIB.0000000000001004. https://doi.org/10.1097/mib.0000000000001004. [DOI] [PMC free article] [PubMed] [Google Scholar]
- 29.Lee J, Moraes-Vieira PM, Castoldi A, Aryal P, Yee EU, Vickers C, et al. Branched fatty acid esters of hydroxy fatty acids (FAHFAs) protect against colitis by regulating gut innate and adaptive immune responses. J Biol Chem. 2016;291(42):22207–17. doi: 10.1074/jbc.M115.703835. https://doi.org/10.1074/jbc.m115.703835. [DOI] [PMC free article] [PubMed] [Google Scholar]
- 30.Sturm A, Zeeh J, Sudermann T, Rath H, Gerken G, Dignass AU, et al. Lisofylline and lysophospholipids ameliorate experimental colitis in rats. Digestion. 2002;66(1):23–9. doi: 10.1159/000064418. https://doi.org/10.1159/000064418. [DOI] [PubMed] [Google Scholar]
- 31.Hung ND, Sok DE, Kim MR. Prevention of 1-palmitoyl lysophosphatidylcholine-induced inflammation by polyunsaturated acyl lysophosphatidylcholine. Inflamm Res. 2012;61(5):473–83. doi: 10.1007/s00011-012-0434-x. https://doi.org/10.1007/s00011-012-0434-x. [DOI] [PubMed] [Google Scholar]
- 32.Wallace JL. Eicosanoids in the gastrointestinal tract. Br J Pharmacol. 2019;176(8):1000–8. doi: 10.1111/bph.14178. https://doi.org/10.1111/bph.14178. [DOI] [PMC free article] [PubMed] [Google Scholar]
- 33.Levy E, Rizwan Y, Thibault L, Lepage G, Brunet S, Bouthillier L, et al. Altered lipid profile, lipoprotein composition, and oxidant and antioxidant status in pediatric Crohn disease. Am J Clin Nutr. 2000;71(3):807–15. doi: 10.1093/ajcn/71.3.807. https://doi.org/10.1093/ajcn/71.3.807. [DOI] [PubMed] [Google Scholar]
- 34.Agouridis AP, Elisaf M, Milionis HJ. An overview of lipid abnormalities in patients with inflammatory bowel disease. Ann Gastroenterol. 2011;24:181–7. [PMC free article] [PubMed] [Google Scholar]
- 35.Koutroumpakis E, Ramos-Rivers C, Regueiro M, Hashash JG, Barrie A, Swoger J, et al. Association between long-term lipid profiles and disease severity in a large cohort of patients with inflammatory bowel disease. Dig Dis Sci. 2016;61(3):865–71. doi: 10.1007/s10620-015-3932-1. https://doi.org/10.1007/s10620-015-3932-1. [DOI] [PubMed] [Google Scholar]
- 36.Biyyani RS, Putka BS, Mullen KD. Dyslipidemia and lipoprotein profiles in patients with inflammatory bowel disease. J Clin Lipidol. 2010;4(6):478–82. doi: 10.1016/j.jacl.2010.08.021. https://doi.org/10.1016/j.jacl.2010.08.021. [DOI] [PubMed] [Google Scholar]
- 37.Parmentier-Decrucq E, Duhamel A, Ernst O, Fermont C, Louvet A, Vernier-Massouille G, et al. Effects of infliximab therapy on abdominal fat and metabolic profile in patients with Crohn's disease. Inflamm Bowel Dis. 2009;15(10):1476–84. doi: 10.1002/ibd.20931. https://doi.org/10.1002/ibd.20931. [DOI] [PubMed] [Google Scholar]
- 38.Koutroubakis IE, Oustamanolakis P, Malliaraki N, Karmiris K, Chalkiadakis I, Ganotakis E, et al. Effects of tumor necrosis factor alpha inhibition with infliximab on lipid levels and insulin resistance in patients with inflammatory bowel disease. Eur J Gastroenterol Hepatol. 2009;21(3):283–8. doi: 10.1097/MEG.0b013e328325d42b. https://doi.org/10.1097/meg.0b013e328325d42b. [DOI] [PubMed] [Google Scholar]