Abstract
While the zinc finger transcription factors EGR1, EGR2, and EGR3 are recognized as critical for T‐cell function, the role of EGR4 remains unstudied. Here, we show that EGR4 is rapidly upregulated upon TCR engagement, serving as a critical “brake” on T‐cell activation. Hence, TCR engagement of EGR4−/− T cells leads to enhanced Ca2+ responses, driving sustained NFAT activation and hyperproliferation. This causes profound increases in IFNγ production under resting and diverse polarizing conditions that could be reversed by pharmacological attenuation of Ca2+ entry. Finally, an in vivo melanoma lung colonization assay reveals enhanced anti‐tumor immunity in EGR4−/− mice, attributable to Th1 bias, Treg loss, and increased CTL generation in the tumor microenvironment. Overall, these observations reveal for the first time that EGR4 is a key regulator of T‐cell differentiation and function.
Keywords: cancer immunity, EGR4, K channels, STIM1, Th1 differentiation
Subject Categories: Cancer, Immunology, Signal Transduction
EGR proteins regulate T cell development and differentiation, but no role for EGR4 has previously been shown. T cell activation upregulates EGR4, whereas EGR4−/− T cells exhibit increased Ca2+ responses, promoting Th1 bias and anti‐cancer immunity.

Introduction
The EGR (early growth response) family of zinc finger transcription factors consists of 4 closely related members (EGR1‐4) whose activity is induced by a wide variety of extracellular stimuli including activation, growth and differentiation signals, tissue injury, and apoptotic signals 1, 2. Within T cells, EGR1, EGR2, and EGR3 have all been shown to modulate T‐cell activation 3, 4, anergy 5, 6, antigen‐induced T‐cell proliferation, and effector differentiation 7. For example, EGR1 favors T helper type 2 (Th2) differentiation by promoting IL‐4 expression 8, while EGR2 and EGR3 suppress Th1 differentiation through control of T‐Bet expression 9. Consistent with these roles, EGR‐responsive elements have been identified in the promoters of multiple cytokine genes including IL‐2 10 and TNFα 11. Reflecting a significant gap in knowledge, the specific role of EGR4 in T‐cell differentiation has not hitherto been examined; while EGR4−/− mice have been available for some time, studies to date have focused primarily on defects in spermatogenesis and male fertility 12, 13, 14.
T‐cell activation is tightly regulated, beginning with the binding of cognate antigen (Ag) to the TCR. Strength and duration of the resulting TCR signal depend on affinity of Ag for the TCR, as well as engagement of costimulatory and inhibitory receptors that modulate TCR signaling. Fine‐tuning of TCR signals ideally promotes productive immunity to pathogens and cancer, while limiting the risk of autoimmunity. One of the earliest events in T‐cell activation is a rise in cytosolic Ca2+ content triggered by recruitment of PLCγ1 to the TCR complex 15, leading to production of inositol 1,4,5‐trisphosphate (InsP3) and ER Ca2+ release. While this occurs within a few seconds of TCR engagement, the Ca2+ response lasts for hours after the initial stimulus, driving the activation of NFAT 15, 16, 17, 18, 19, 20, NF‐kB 20, 21, and CREB 20, which leads to T‐cell clonal expansion, differentiation to effector cells 22, 23, 24, and metabolic shifts 23. Maintenance of Ca2+ signals over this timeframe requires Ca2+ influx from the extracellular space through plasma membrane Ca2+ channels and is critical for T‐cell activation to occur 18, 25, 26, 27. STIM1 and STIM2 are transmembrane proteins that act as sensors of ER Ca2+ depletion, facilitating store‐operated Ca2+ entry (SOCE) through members of the Orai family of Ca2+ channels 27, 28, 29, 30, 31, 32.
Interestingly, EGR1 has been implicated in the expression of numerous Ca2+ homeostatic proteins in multiple cell types. EGR1 has been shown to promote SERCA expression 33, 34, 35, while negatively regulating NCX 36 and calsequestrin 37. Our previous studies have shown that EGR1, and EGR4, regulate STIM1 expression in T‐cell lines and several other cell types 26. The role of this regulation in primary T‐cell differentiation, however, remains unknown.
The current investigation was designed to assess whether EGR4 plays any role in T‐cell function. In contrast to previous assumptions, we find that EGR4 plays a critical and non‐redundant role in T‐cell activation and Th differentiation. While the level of EGR4 expression is very low in resting T cells, it is strongly upmodulated upon T‐cell activation. Further, EGR4−/− T cells exhibit profound TCR‐induced increases in Ca2+ signals, compared to knockout of other EGR family members, despite compensatory upmodulation of other EGR proteins. Pharmacological inhibition of Ca2+ responses in EGR4−/− T cells blocks Th1 bias, revealing the causal role for Ca2+ signals in this phenotype. Finally, the functional significance of EGR4 is revealed by enhanced T cell‐mediated anti‐cancer immunity in EGR4−/− mice, as outlined below.
Results
EGR4 is expressed in T cells, but has minimal effects on T‐cell development
The EGR1, EGR2, and EGR3 factors have been quite closely studied for their critical roles in T‐cell development and differentiation for many years. However, the role of EGR4 has been discounted, in part due to early challenges in detection 38 and the consequent doubt that it was significantly expressed in T cells. Here, we sought to directly test expression and function of EGR4 in T cells. We first used qPCR to assess the induction of EGR4 in purified mouse CD4+ T cells in response to anti‐CD3/CD28 stimulation. For this purpose, we collected and stimulated CD4+ T cells from WT, EGR4−/−, and control EGR1−/− mice and assessed expression of EGR4 and other EGR family members at time points from 0 to 20 h (Fig 1A). Strikingly, EGR4 expression was strongly upregulated after 2 h of activation in WT CD4+ T cells, although this expression was lost by the 20‐h time point. This is in marked contrast to the expression of EGR1, EGR2, and EGR3 which, in WT CD4+ T cells, was sustained and/or increased at both the 2‐ and 20‐h time points. Individual ablation of EGR4 or EGR1 caused upmodulation of most other EGR family members, suggesting negative feedback among members of this family. In a notable exception, EGR1−/− T cells showed diminished EGR4 induction at 2 h, suggesting the existence of a positive feedback loop between EGR1 and EGR4, consistent with the previous observation that EGR4 expression is EGR1‐dependent 39. Collectively, our data show that EGR4, in contrast to other EGR family members, is induced with transient kinetics in response to TCR stimulation, which may partly explain why its role in T‐cell activation has been previously overlooked.
Figure 1. Characterization of EGR4 knockout T cells.
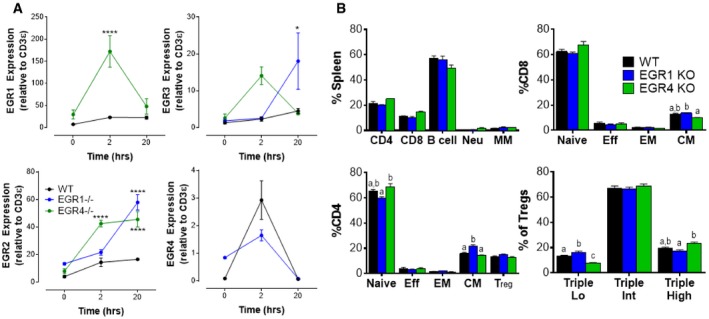
- CD4+ T cells were isolated from the spleen by negative selection before incubating with anti‐CD3/CD28 antibodies for the indicated time periods. Levels of expression of EGR1, EGR2, EGR3, and EGR4 were measured by qPCR.
- WBC was collected from WT, EGR1KO, and EGR4KO mice before staining and FACS analysis to determine composition (gating strategies in Appendix Fig S1). Subclasses of CD8+, CD4+, and Treg populations were determined as shown.
To assess the potential functional role of EGR4 in T‐cell differentiation in vivo, we first examined the peripheral leukocyte composition of EGR4−/− mice, in comparison with EGR1−/− and WT mice. No significant differences in the proportions of T cells, B cells, neutrophils, or monocytes/macrophages were observed in the spleen (Fig 1B; gating strategies in Appendix Fig S1A). However, there was a significant decrease in the central memory T‐cell subset in EGR4−/− CD8+ T cells (relative to EGR1−/− T cells) and a significant increase in central memory EGR1−/− CD4+ T cells (relative to both WT and EGR4−/−). Further, while total Treg frequency was essentially unchanged, we observed subtle but statistically significant differences in Treg subset composition (based on CD25, GITR, and PD1 expression; Appendix Fig S1B) 40. Collectively, we conclude that EGR4−/− mice exhibit subtle alterations in T‐cell subset representation with potential functional implications that differ from those exhibited by EGR1−/− mice.
Activated EGR4−/− T cells exhibit hyperproliferation and Th1 bias
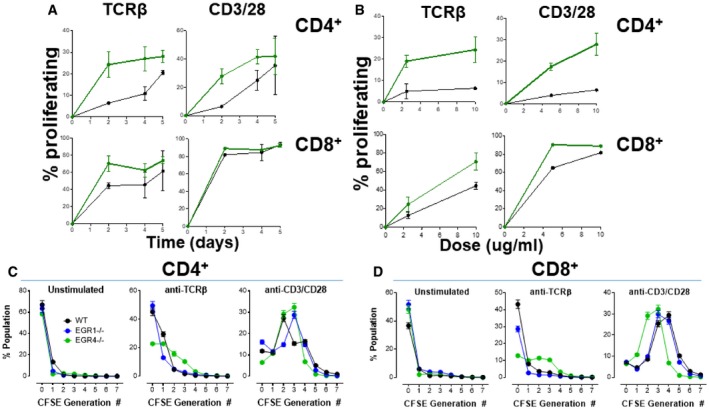
As a first step to understand the potential role of EGR4 in T‐cell function, we assessed T‐cell proliferation. For this purpose, CD4+ and CD8+ T cells were isolated from WT, EGR4−/−, or EGR1−/− mice, and cultured in vitro either without stimulation, or in the presence of weak (anti‐TCRβ) or strong (anti‐CD3/CD28) TCR stimuli. The ability of weak versus strong TCR signals to induce different levels of EGR and consequently different cellular responses is well established. For instance, during early thymocyte development the ability of γδTCRs or pre‐TCRs to mediate strong versus weak TCR signals leads to strong versus weak EGR induction and differential development to γδ versus αβ fates, respectively 41. Also, it was recently shown that differential TCR signaling controls differentiation of iNKT cell subsets by regulating duration of EGR expression as well as by inducing epigenetic changes that promote accessibility of EGR binding sites 42. Here, we found that the absence of EGR4 markedly enhanced proliferation of both CD4+ and CD8+ T cells (Fig 2) under conditions of weak anti‐TCR□ stimulation over a 5‐day time course. In contrast, under conditions of strong anti‐CD3/28 stimulation this proliferative advantage of EGR4−/− versus WT T cells was substantially diminished, particularly for CD8+ T cells (Fig 2A; Appendix Fig S2), likely reflecting the near‐maximal response of WT CD8+ T cells even after 2 days of stimulation. The proliferative advantage of EGR4−/− T cells over WT T cells in response to anti‐TCRβ was evident already at 48 h and over a fivefold dose range (Fig 2A and B; Appendix Fig S2). At low dosage (5 μg/ml), even strong anti‐CD3/CD28 treatment elicited enhanced proliferation by EGR4−/− versus WT CD4+ and CD8+ T cells (Fig 2F). Generation‐structured decomposition of 4‐day proliferation data reveals that many more EGR4−/− T cells undergo 2–3 cell divisions in response to weak anti‐TCR stimulus, than is the case for WT or EGR1−/− T cells, for both CD4+ (Fig 2C; Appendix Fig S3A) and CD8+ (Fig 2D; Appendix Fig S3B) T cells. This effect is hidden under conditions of strong anti‐CD3 stimulation, which rapidly drives most cells past the 2nd cell division stage regardless of EGR status (Fig 2D).
Figure 2. Constitutive hyperproliferation in EGR4KO T cells.
-
ACells were incubated under unstimulated conditions or stimulated with either anti‐TCRβ or anti‐CD3/CD28 antibodies for 0–5 days (mean ± SEM; a minimum of three biological replicates were examined; each biological replicate includes two technical replicates).
-
BDose dependence of EGR4‐dependent differences in proliferation was also determined in both CD4+ and CD8+ cells after treatment with anti‐TCRβ or anti‐CD3/CD28 at the indicated concentrations before FACS analysis (Appendix Fig S2) (mean ± SEM; a minimum of three biological replicates were examined; each biological replicate includes two technical replicates).
-
C, DGeneration analysis was then assessed in WT, EGR1−/−, and EGR4−/− CD4+ (C) or CD8+ (D) T cells after a 4‐day incubation, under unstimulated conditions, or stimulated with either anti‐TCRβ or anti‐CD3/CD28 antibodies. Generation analysis was determined using FlowJo as depicted in Appendix Fig S3 (mean ± SEM; a minimum of three biological replicates were examined; each biological replicate includes two technical replicates). EGR4 deletion significantly shifted the number of generations as determined by two‐way ANOVA; loss of either EGR1 or EGR4 significantly changed the number of generations under resting or stimulated conditions (P < 0.0001).
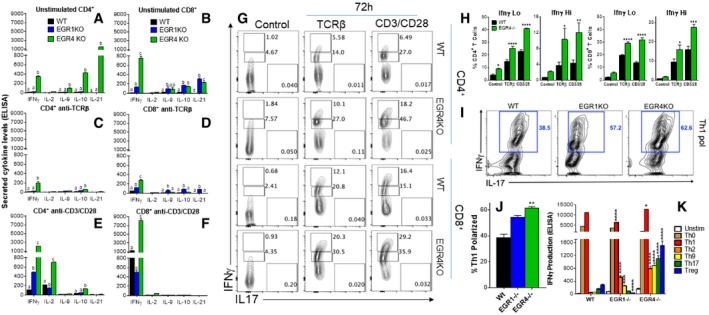
Next, we tested the effects of EGR4 deficiency on T‐cell cytokine production. Remarkably, resting EGR4‐ but not EGR1‐deficient CD4+ T cells already expressed substantial levels of IFNγ, IL‐9, IL‐10, and IL‐21, compared to WT cells, thus defining a non‐redundant role of EGR4 in inhibition of diverse cytokine genes by CD4+ T cells even in the absence of stimulation (Fig 3A). Interestingly, in the case of CD8+ T cells there was strong induction of these 4 cytokines by both EGR4‐ and EGR1‐deficient cells, although the effect of EGR4 deficiency was much greater for IFNγ expression (Fig 3B). However, activation of EGR4‐deficient cells with a weak anti‐TCRβ stimulus actually reduced cytokine expression in both CD4+ (Fig 3C) and CD8+ (Fig 3D) subtypes, although IFNγ, IL‐10, and IL‐21 (CD8+ only) expression levels were still elevated compared to activated WT T cells at 48 h. Strong anti‐CD3/28 stimulus greatly induced IFNγ and IL‐2 expression by EGR4‐deficient CD4+ T cells compared to similarly activated WT and EGR1‐deficient cells, while other cytokines that were increased in naïve EGR4−/− CD4+ cells were partly (IL‐10) or totally (IL‐9, IL‐21) suppressed (Fig 3E). Similarly, CD8+ T cells from EGR4−/− mice exhibited elevated IFNγ production in response to anti‐CD3/CD28 stimulation compared to WT and EGR1‐deficient CD8+ cells, while other cytokines that were increased in naïve EGR4−/− CD8+ cells were mostly suppressed (Fig 3F). We then performed intracellular anti‐IFNγ staining followed by FACS analysis on stimulated and control T‐cell subsets, allowing us to quantitate IFNγ expression at the single cell level (Fig 3G and H). This revealed that (i) the number of IFNγlo cells was elevated in unstimulated EGR4−/− versus WT T cells (Fig 3G, left column), and (ii) both IFNγlo and IFNγhi cell numbers were increased in EGR4−/− versus WT T cells under both weak and strong stimulation conditions (Fig 3G, middle and right columns). Indeed, EGR4−/− T cells treated with anti‐TCRβ upmodulated IFNγ even more than WT T cells treated with anti‐CD3/CD28. These observations indicate that increased cytokine expression in the absence of EGR4 reflects both the generation of increased numbers of cytokine‐producing cells and increased IFNγ production by individual responder cells. We conclude that EGR4 acts as a significant brake on the generation of Teff cells in general and Th1 cells, in particular, such that EGR4−/− cells are poised to respond to further stimulation. Further, EGR4 deficiency causes a much more striking phenotype than EGR1 deficiency, particularly for CD4+ T cells. The unique role of EGR4 may in part reflect different binding specificities of these factors. For instance, EGR1 but not EGR4 binds to a zinc finger protein binding region (ZIP) in the human IL‐2 promoter 10.
Figure 3. EGR4KO cells exhibit Th1 bias and a capacity to differentiate into CTLs.
-
A–FCytokine secretion was measured by ELISA after incubating CD4+ (A,C,E) and CD8+ (B,D,F) T cells for 48 h in resting conditions (A,B) or stimulated with either anti‐TCRβ (C,D) or anti‐CD3/CD28 antibodies (E,F).
-
GRepresentative FACS plots depicting IFNγ levels after intracellular staining in WT and EGR4KO CD4+ and CD8+ T cells.
-
HComparison of IFNγ levels in WT versus EGR4−/− T cells.
-
IRepresentative FACS plots of CD4+ T cells incubated for 24 h under Th1‐polarizing conditions before intracellular staining with IFNγ and IL‐17 antibodies.
-
JComparison of the number of Th1 polarized cells between WT, EGR1−/−, and EGR4−/− CD4+ T cells.
-
KCD4+ T cells were incubated for 5 days under polarizing conditions before analysis of cytokine production by ELISA.
Our observation that IFNγ expression is consistently de‐repressed in EGR4‐deficient T cells under both resting and activated conditions raises the question of whether EGR4 plays a key role in Th polarization, in particular by limiting the Th1 response or at least IFNγ production. To test this possibility, we polarized CD4+ T cells derived from WT, EGR1−/−, and EGR4−/− mice toward Th1, Th2, Th17, and Treg fates in vitro (Figs 3I–K and EV1). Both EGR4‐ and EGR1‐deficient CD4+ T cells initially showed increased proportions of IFNγ‐producing cells under Th1‐polarizing conditions compared to WT cells (Fig 3I and J) after 3 days, but equivalent levels to WT cells by 5 days post‐stimulation (Fig 3K). However, a key difference emerged under non‐Th1‐polarizing conditions, such that EGR4−/− CD4+ T cells consistently and strongly upmodulated IFNγ under all non‐Th1 conditions by 5 days post‐stimulation (Fig 3K), while WT and EGR1−/− CD4+ T cells exhibited relatively inconsistent and weak induction. Note that anti‐IFNγ antibody (20 μg/ml) was included in all stimulation conditions, so that increased IFNγ production cannot be attributed to an enhanced IFNγ‐mediated positive feedback loop in EGR4‐deficient T cells. Surprisingly, EGR4‐deficient Th1‐polarized CD4+ T cells expressed high levels of granzyme B and perforin, which were not detected in EGR1−/− or WT CD4+ T cells (Appendix Fig S4A). Granzyme B induction has previously been reported to occur in restimulated Th1 effectors, where it has been proposed to play a role in AICD 43, 44. Similar polarization of CD8+ T cells with IL‐2 and IL‐12, which is known to promote Tc1 CD8+ fate 45, 46, 47, also induced greater granzyme B and perforin induction in the absence of EGR4 than in WT cells (Appendix Fig S4B). These observations suggest that EGR4 plays a role in limiting IFNγ production and cytolytic capacity of both activated CD4+ and CD8+ T cells under diverse polarizing conditions.
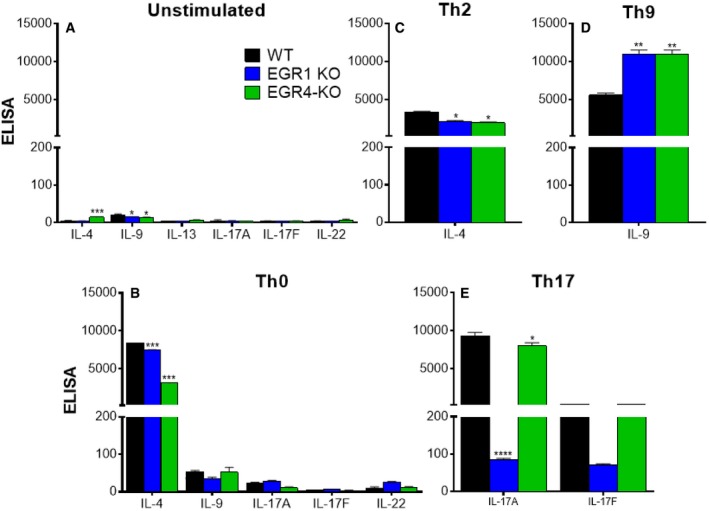
Figure EV1. Cytokine expression patterns in WT, EGR1KO, and EGR4KO CD4+ cells cultured under polarized conditions from Fig 3 .
-
A–ECD4+ T cells were isolated from the spleens of WT, EGR1KO, and EGR4KO mice by cell sorting. Cells were incubated for 5 days without stimulation (A) or under Th0 (B)‐, Th2 (C)‐, Th9 (D)‐, or Th17 (E)‐polarizing conditions before analysis of cytokine production by ELISA. Data are presented as mean ± SEM; a minimum of three biological replicates were examined; and each biological replicate includes two technical replicates. Differences in cytokine production were determined by one‐ or two‐way ANOVA as appropriate. Post hoc analysis revealed EGR‐dependent differences in cytokine production *P < 0.05; **P < 0.01; ***P < 0.001; ****P < 0.0001.
Interestingly, while EGR4 deficiency promotes IFNγ production and cytolytic phenotype, it does not inhibit expression of characteristic cytokines associated with the Th2, Th9, and Th17 fates, in that there is no decrease in IL‐13/IL‐4, IL‐9, IL‐17, or IL‐22 under Th2‐, Th9‐, and Th17‐polarizing conditions, respectively, in EGR4−/− (or EGR1−/−) CD4+ T cells, and even a substantial upmodulation in some cases (Fig EV1). In contrast, induction of Foxp3, the signature transcription factor of Treg differentiation, is significantly impaired in EGR4‐deficient CD4+ T cells (Appendix Fig S4C). Further, expression of Helios, a critical transcription factor required for maintaining Treg stability 48, was substantially reduced in EGR4−/− CD4+ T cells under Treg‐polarizing conditions (Appendix Fig S4D).
Enhanced NFAT nuclear translocation mediates hyperresponsiveness of EGR4 T cells
The NFAT family of transcription factors is known to control the expression of several signature cytokines, as well as their receptors 24, 49, 50, 51. The integration of cytokine signals with signal transduction cascades emanating from the TCR and other receptors during both adaptive and innate immune cell responses critically determines T helper cell differentiation outcomes 24. Of particular relevance here, the NFAT/AP1 transcription factors bind and regulate the IFNγ promoter in the presence of STAT1, STAT4, and STAT5 24, and the absence of NFAT 1,2 and 4 totally abrogates IFNγ production 52. To understand whether enhanced IFNγ generation in the absence of EGR4 may result from prolonged NFAT activation, we measured NFAT translocation in response to anti‐CD3/28 stimulation in purified CD4+ and CD8+ T cells from EGR4−/− and WT mice (Fig 4A; Appendix Fig S5). As expected, nuclear NFAT increased dramatically in WT T cells within 30 min after stimulation, with a greater response in CD8+ than CD4+ cells. While this was also true for EGR4−/− T cells, there were 2 two important differences: (i) EGR4−/− resting CD4+ T cells, but not CD8+ T cells, exhibited significantly lower nuclear NFAT than WT control cells, and (ii) high‐level NFAT nuclear localization was more sustained and/or peaked at higher levels in EGR4−/− CD4+ and CD8+ T cells than in WT control cells (Fig 4A). Collectively, these data suggest that EGR4 acts to limit strength and duration of NFAT activation upon TCR stimulation.
Figure 4. Activation of CD4+ cells causes sustained Ca2+ elevation and NFAT upregulation.
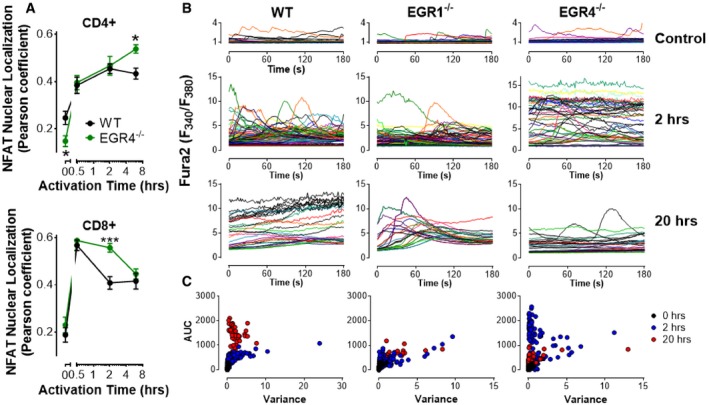
- NFAT nuclear localization was measured was measured by immunocytochemistry in CD4+ and CD8+ T cells isolated by negative selection from WT, EGR1KO, and EGR4KO mice. Cells were stimulated with anti‐CD3/CD28 antibodies for the indicated time periods before fixation and staining. Nuclear localization of NFATc1 in CD4+ and CD8+ T cells was determined based on colocalization of NFATc1 and DAPI measured by Pearson analysis (mean ± SEM; data are based upon 13–20 cells/data point from one experiment; experiment was repeated three times). EGR4‐mediated differences in NFATc1 localization were determined by two‐way ANOVA. NFAT localization was dependent upon EGR4 expression in both CD4+ (P = 0.025) and CD8+ (P = 0.039) T cells. Post hoc analysis revealed EGR4‐dependent differences at specific time points *P < 0.05; ***P < 0.001.
- WT, EGR1KO, and EGR4KO CD4+ T cells were isolated from the spleen by negative selection before plating on poly‐lysine (control) or CD3/CD28 and loading with fura‐2. Ca2+ levels shown are from representative single cells measured from multiple experiments.
- Scatter plots showing area under the curve (AUC) and variance for each cell measured under all conditions.
EGR4−/− T cells exhibit enhanced Ca2+ signaling
Considering the strong link between NFAT nuclear localization and cytosolic Ca2+ content, we assessed the role of EGR4 in promoting TCR‐induced Ca2+ signals. Accordingly, cytosolic Ca2+ content was measured in EGR4−/−, EGR1−/−, and WT CD4+ (Fig 4C) and CD8+ (Fig EV2) T cells at various points after T‐cell engagement. Ca2+ levels were assessed after loading with fura‐2. Ca2+ levels above baseline (determined in resting cells) were quantified by measuring the area under the curve (AUC), while variance was used to assess the extent to which Ca2+ elevations were transient versus sustained (Fig 4C). As expected, unstimulated WT CD4+ T cells were largely quiescent, while CD3/28 stimulation led to progressive sustained increases in cytosolic Ca2+ concentration after 2 and 20 h. Unstimulated EGR4‐ and EGR1‐deficient T cells similarly exhibited baseline Ca2+ levels. However, EGR4−/− CD4+ T cells exhibited a striking difference in response to anti‐CD3/CD28 stimulation, i.e., elevated Ca2+ levels at 2 h which returned to near‐resting levels by 20 h (Fig 4B). In contrast, EGR4−/− CD8+ T cells showed similar elevation of Ca2+ levels at 2 h, but were able to maintain these levels until the 20‐h time point (Fig EV2). EGR1−/− CD4+ T cells showed defects in Ca2+ responses at both early and late time points. Finally, anti‐CD3 crosslinking revealed no EGR4‐dependent differences in immediate Ca2+ response for either CD4+ or CD8+ T cells (Fig 5A), indicating that differences in Ca2+ responses reflect the ability of cells to sustain Ca2+ signals as opposed to differences in proximal TCR signaling. Overall, these observations reveal profound increases in Ca2+ signal duration during T‐cell activation in EGR4−/− but not EGR1−/− T cells. While the modest decreases in Ca2+ levels observed in EGR1−/− cells likely reflect EGR1‐mediated control of STIM1 expression 24, 50, the reasons for increased Ca2+ signals in EGR4−/− cells are hitherto unclear.
Figure EV2. Activation of CD8+ cells causes sustained Ca2+ elevation.
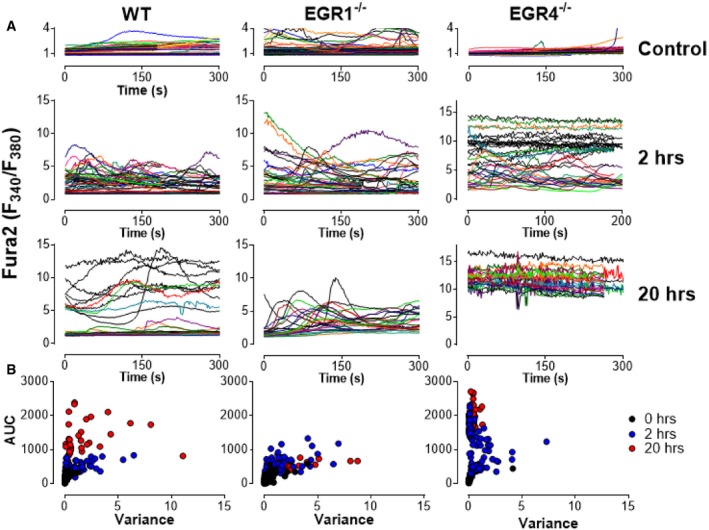
- WT, EGR1KO, and EGR4KO CD8+ T cells were isolated from the spleen by negative selection before plating on poly‐lysine (control) or CD3/CD28 and loading with fura‐2. Ca2+ levels shown are from representative single cells measured from multiple experiments.
- Scatter plots showing area under the curve (AUC) and variance for each cell measured under all conditions.
Figure 5. Ca2+ signal elevation in EGR4KO T cells is required for IFNγ and IL2 production.
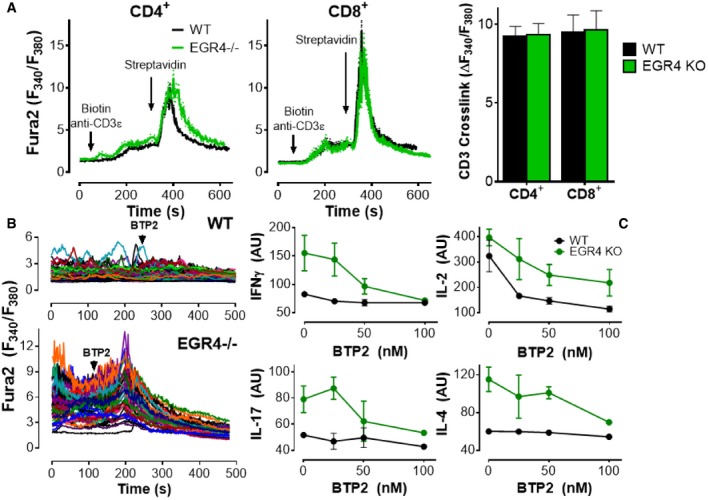
- CD4+ and CD8+ T cells were loaded with fura‐2 AM and plated on poly‐D‐lysine (2 h) before treating with biotinylated anti‐CD3ε, followed by streptavidin where indicated. The average response of the majority of CD4+ (WT 74.2 ± 3.2%; EGR4−/− 77.8 ± 2.9%) and CD8+ (WT 79.4 ± 3.5%; EGR4−/− 78.2 ± 2.5%) cells that responded to streptavidin crosslinking of CD3 (mean ± SEM; 40–60 cells/coverslip; 7–8 separate experiments).
- Cells were plated on anti‐CD3/CD28 antibodies for 2 h; BTP2 (10 μM) was added where marked by the arrow.
- CD4+ T cells were incubated with anti‐CD3/CD28 antibodies for 6 h before measuring expression of IFNγ, IL‐2, IL‐17, and IL‐4 by FACS analysis. Data are mean ± SEM; a minimum of three biological replicates were examined; and each biological replicate includes two technical replicates.
Since Ca2+ signals control NFAT nuclear localization, we assessed the possibility that the changes in TCR‐mediated Ca2+ signals observed in EGR4−/− cells are responsible for increased NFAT localization and changes in cytokine expression, using BTP2, a store‐operated Ca2+ channel blocker 53, 54, 55. CD4+ T cells were plated for 2 h on anti‐CD3/CD28 to generate cytosolic Ca2+ elevation followed by the addition of BTP2 (Fig 5B). The observed rapid suppression of Ca2+ elevation confirms that store‐operated Ca2+ signals are required to sustain elevated Ca2+ content in TCR‐stimulated CD4+ T cells. To determine whether TCR‐induced Ca2+ responses contribute to dysregulated cytokine production in EGR4−/− CD4+ T cells, BTP2 was titrated down to partially effective doses (to avoid blockade of all cytokine production even in WT cells; Fig 5C). Remarkably, 100 nM BTP2 repressed anti‐CD3/CD28‐dependent hyperinduction of IFNγ in EGR4−/− cells to WT levels, while other cytokines remained above WT levels. Note that our data are consistent with prior investigations showing that 100 nM BTP2 only partially blocks IL‐2 production 54. These observations reveal selective control of cytokine production by Ca2+, with a specific Ca2+‐dependent mechanistic link between EGR4 and IFNγ production in T cells.
Potassium channel activity in EGR4−/− T cells contributes to increased Ca2+ responses
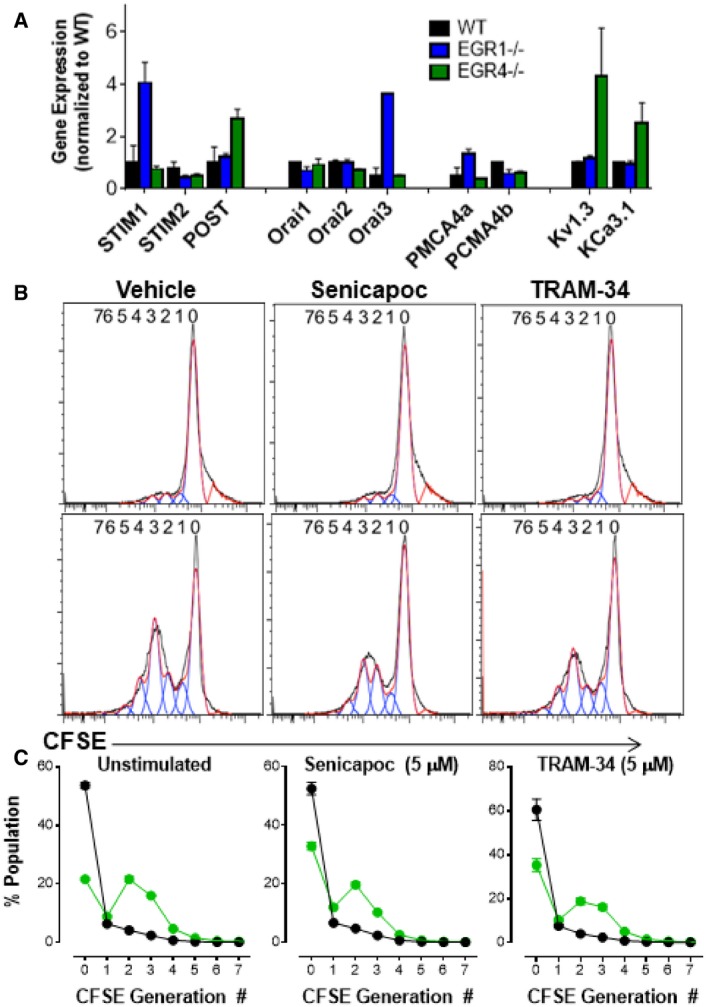
Given our prior findings that EGR1 and EGR4 regulate STIM1 26, 56 and PMCA4 26 expression, our initial hypothesis for why EGR4−/− T cells exhibit increased Ca2+ responses was that EGR4 deletion led to dysregulation of STIM and/or PMCA expression. However, qPCR analysis of their expression levels failed to support this hypothesis (Fig EV3A); increases in STIM1, Orai3, and PMCA4a were observed in EGR1−/−, but not EGR4−/− cells. A modest increase in partner of STIM1 (POST) 57, 58 expression was observed, but this seemed unlikely to account for observed changes in TCR‐mediated Ca2+ responses reported here. We then considered the possibility that sustained Ca2+ entry may require compensatory maintenance of membrane potential through potassium channel activity. Hence, Ca2+ entry depends upon a combination of a concentration gradient and a negative membrane potential, both of which are partially attenuated as Ca2+ enters the cell. Potassium channels permit the exit of K+ from the cell, thereby increasing membrane potential and the corresponding driving force for Ca2+ entry. T cells primarily express only 2 potassium channels: Kv1.3 and KCa3.1 59. qPCR analysis of their expression revealed modest increases in both KCa3.1 and Kv1.3 expression in EGR4−/− cells only (Fig EV3A). To determine the extent to which KCa3.1 upregulation contributes to Ca2+ responses in EGR4−/− T cells, we utilized 2 well‐established pharmacological inhibitors: senicapoc and TRAM‐34 60, 61, of which the former has been tested in a clinical trial 62. WT and EGR4−/− CD4+ T cells were fura‐2 loaded and plated on anti‐CD3/CD28 coverslips for 2 h to induce Ca2+ responses (as in Fig 5). Senicapoc (4 μM) completely blocked Ca2+ responses in both WT and EGR4−/− T cells, while TRAM‐34 only partially attenuated Ca2+ responses (Fig 6A). However, there was a dramatic difference in kinetics, with immediate inhibition observed in EGR4−/− T cells, as opposed to delayed inhibition in WT. This is highly supportive of a greater role for KCa3.1 in maintaining membrane potential in EGR4−/− T cells; considered collectively with the increased expression of the KCa3.1 channel, we propose that KCa3.1 contributes critically to increased Ca2+ responses in EGR4−/− T cells. We next assessed the contribution of KCa3.1 activity on IFNγ production. As depicted in Fig 5, blocking Ca2+ entry with BTP2 blocked the increased IFNγ production characteristic of EGR4−/− T cells. Since KCa3.1 activity is required for IFNγ production, we would expect that blocking KCa3.1 would lead to the same result. As depicted in Fig 6B, that is exactly the case. We then tested cells with the Kv1.3 inhibitor Shk‐Dap22, observing a similar potent inhibition of IFNγ production (Fig 6B), suggesting redundancy between these 2 channels. Finally, we assessed whether KCa3.1 inhibition would affect the hyperproliferation observed in EGR4−/− T cells (see Fig 2). However, 5 μM concentrations of either senicapoc or TRAM‐34 had no effect on the proliferation of either CD4+ (Fig 6C and D) or CD8+ (Fig EV3B and C) T cells. Considered collectively, these observations establish that dysregulated expression and function of KCa3.1 and/or Kv1.3 in EGR4−/− T cells alters TCR‐induced Ca2+ responses, selectively required for IFNγ production, but not hyperproliferation.
Figure EV3. Inhibition of KCa3.1 has no effect on CD8+ T‐cell proliferation.
-
A–CCD4+ T cells were isolated by negative selection from WT, EGR1−/−, or EGR4−/− mice. (A) RNA was collected from freshly isolated cells before probing for STIM1, STIM2, POST, Orai1, Orai2, Orai3, PMCA4a, PMCA4b, Kv1.3, and KCa3.1 expression by qPCR. Data are presented as mean ± SEM; a minimum of three biological replicates were examined; and each biological replicate includes two technical replicates. (B) WT and EGR4−/−. CD8+ T cells were isolated from the spleen by cell sorting and stained with CFSE. Cells were incubated with anti‐TCRβ antibodies in the presence of vehicle, senicapoc (5 μM), or TRAM‐34 (5 μM) for 4 days and then collected for FACS analysis. (C) Generation analysis was completed for all data using FlowJo software. Data are presented as mean ± SEM; a minimum of three biological replicates were examined; and each biological replicate includes two technical replicates.
Figure 6. Potassium channel activity is required for Ca2+ responses and IFNγ production, but not hyperproliferation in EGR4KO T cells.
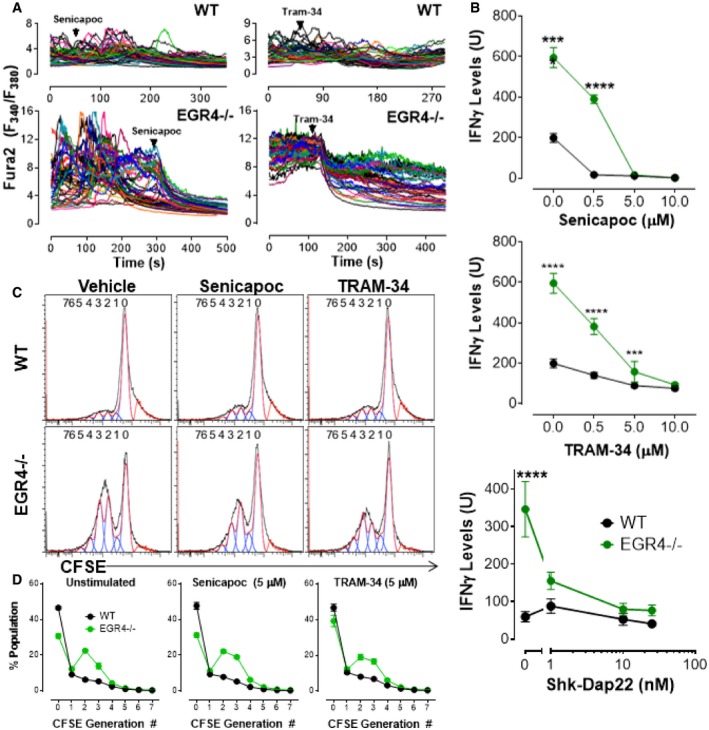
- WT or EGR4−/− cells were loaded with fura‐2 AM and plated on anti‐CD3/CD28 antibodies for 2 h. Senicapoc (4 μM) or TRAM‐34 (5 μM) was added where marked by the arrow.
- CD4+ T cells were isolated by negative selection from WT or EGR4−/− mice and incubated with anti‐CD3/CD28 antibodies for 6 h in the presence or absence of either senicapoc, TRAM‐34, or Shk‐Dap22 before measuring expression of IFNγ levels by FACS analysis. Data are mean ± SEM; three biological replicates were examined; and each biological replicate includes two technical replicates. ***P < 0.001; ****P < 0.0001.
- To measure the effect of KCa3.1 inhibition of cell proliferation, WT and EGR4−/− CD4+ T cells were isolated from the spleen by cell sorting and stained with CFSE. Cells were incubated with anti‐TCRβ antibodies in the presence of vehicle, senicapoc (5 μM), or TRAM‐34 (5 μM) for 4 days and then collected for FACS analysis.
- Generation analysis was completed for all data using FlowJo software. Data are mean ± SEM; three biological replicates were examined; and each biological replicate includes two technical replicates.
EGR4−/− mice exhibit enhanced anti‐cancer immunity
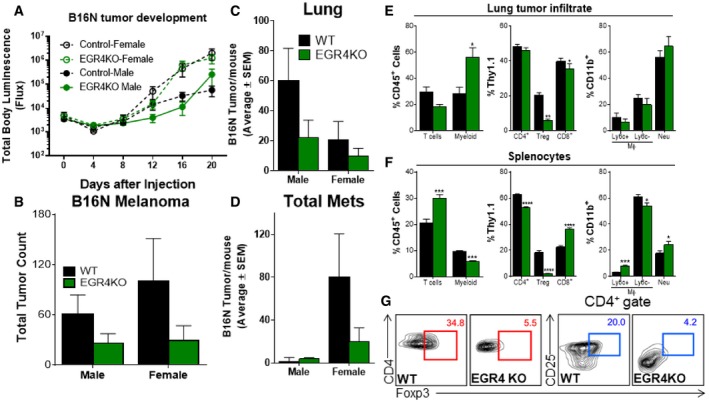
The above results suggest that EGR4 acts as a brake on T‐cell proliferation and cytokine production through control of TCR‐dependent Ca2+ signaling and NFAT function, making them poised to respond more efficiently to further stimulation. Hence, we decided to assess whether EGR4 deficiency can enhance effectiveness of the T‐cell response in an in vivo tumor transplant model. The effectiveness of the T‐cell response in a tumor setting is known to be limited by anergy, polarization to the Treg (suppressor) fate, and exhaustion, resulting in decreased anti‐tumorigenic cytokine production, decreased survival, and elevated expression of inhibitory receptors. Since EGR4−/− T cells show enhanced TCR signaling and IFNγ production, as well as a defect in iTreg polarization, we reasoned that ablation of EGR4 might counter some of these effects, leading to an enhanced anti‐tumor response. To assess this hypothesis in vivo, we performed a melanoma lung colonization assay in EGR4−/− versus WT mice, assessing both melanoma growth and T‐cell differentiation and function. Experiments were performed in both male and female mice since melanoma is known to exhibit gender bias, with males tending to exhibit larger primary tumors and relatively fewer distal metastases 63. Syngeneic B16N melanoma cells, expressing luciferase to facilitate monitoring of tumor growth, were introduced to WT or EGR4−/− mice by tail vein injection. Within 15 min of the injection, all mice exhibited similar localization of transferred melanoma cells to the lungs (see time 0, Fig 7A). Consistent with prior studies, a decrease in melanoma cell numbers, as assessed by luciferase imaging, was observed after 4 days, after which counts increased until day 20, when the experiment was terminated (Fig 7A; Appendix Fig S6B). We also observed an unexpected decrease in melanoma cells in WT male mice at days 16 and 20; however, this is likely an artifact of poor accessibility of the luciferin reagent in some mice, rather than a real decrease in tumor growth. Histological analysis of WT male mice at day 20 revealed substantial tumor load (Fig 7B) that was primarily localized within the lungs (Fig 7C). Interestingly, there was a significant delay in tumor growth in male EGR4−/− mice starting from day 12, although not in female mice (Fig 7A; Appendix Fig S6B). Despite the fact that IVIS imaging failed to report any EGR4‐dependent differences in total tumor load in female mice, substantial EGR4‐dependent differences in the number of tumors were observed in both female and male mice (Fig 7B–D). There was also a major difference in the number of metastatic tumors, with females exhibiting a substantial increase, particularly in WT mice (Fig 7D). This difference was likely due to the large numbers of metastases observed in the ovaries (Appendix Fig S6A).
Figure 7. Attenuated melanoma lung colonization and metastasis in EGR4−/− mice.
-
ALuciferase expression was monitored by IVIS imaging at the indicated time points after luciferin injections.
-
B–DMice were sacrificed on day 20, and tumors were counted. Data are presented as total/mouse (B), lung tumors (C), and metastatic tumors (all tumors found outside of the lungs; (D). N = 9 for each gender and genotype. Differences in luciferase activity measured by IVIS in panel (A) were determined by two‐way ANOVA. Changes in luciferase activity were significantly altered in EGR4 knockout mice (P < 0.0112).
-
E–GAll lung tumors were isolated from both WT and EGR4KO mice along with spleens and analyzed for CD45+ cells. WT lung tumors were 5.407 ± 1.843% CD45+, while EGR4KO mice were 12.445 ± 2.239% CD45+. WT spleens were 83.92 ± 3.344% CD45+, while EGR4KO mice were 95.13 ± 1.856% CD45+. Relative distributions of T and myeloid cells within the CD45+ populations were determined by flow cytometric analysis. (E, F) Distributions of T and myeloid cells found within lung tumors (E) versus the spleen (F). (G) Representative FACS plots depicting gating strategies for defining Treg cell populations in panels (E and F); staining controls are in Appendix Fig S7.
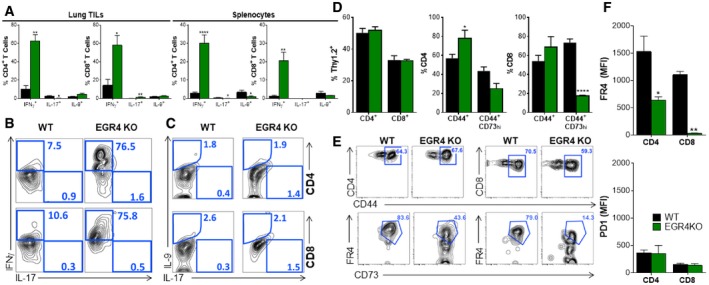
In an effort to provide mechanistic insight into why EGR4 deletion affects melanoma colonization and metastasis, we characterized tumor‐infiltrating and splenic immune cells in mutant versus WT host mice. Lung tumors from EGR4−/− hosts exhibited a significant (P < 0.05) increase in tumor‐infiltrating CD45+ cells relative to WT (12.445 ± 2.239% versus 5.407 ± 1.843%, respectively). There was no significant difference in the total number of tumor‐infiltrating lymphocytes (TILs), and overall CD4+/CD8+ ratio was unaffected. However, further characterization revealed a substantial decrease in Treg numbers in EGR4−/− mice (Fig 7E). There was an increase in tumor‐associated myeloid cells (TAMCs), although TAMC composition was unaffected (Fig 7E). There was visible melanoma colonization of the spleen in most WT and EGR4−/− mice. EGR4−/− mice exhibited significant increases in total splenic T‐cell numbers, reflecting a large increase in the number of CD8+ T cells (Fig 7F). As in the lungs, splenic Treg numbers were substantially lower in EGR4−/− than WT mice (Fig 7F and G). Significant EGR4‐dependent differences in the numbers of neutrophils and Ly6c+ monocytes within the myeloid compartment were also observed (Fig 7F). Consistent with our in vitro results shown above, EGR4−/− CD4+ and CD8+ TILs and splenocytes exhibited a many‐fold increased ability to produce IFNγ (Fig 8A and B). In contrast, only marginal differences in the number of IL‐9‐ and IL‐17‐producing lymphocytes (representing 0–4% of the total) were collected from either tumors or spleens (Fig 8A and C). There are 2 major implications of these findings. The first is that syngeneic melanoma cells promote a strongly immunosuppressive tumor microenvironment, both within tumors and upon localization to lymphoid tissues. Second, T cells lacking EGR4 are highly resistant to this immunosuppressive environment, retaining their ability to produce IFNγ (i.e., Th1 bias) and repressing Treg generation.
Figure 8. Th1 bias and decreased anergy/exhaustion in EGR4−/− mice exhibiting melanoma.
-
ACD4+ and CD8+ T cells were stimulated in vitro with ionomycin/PMA before intracellular staining for IFNγ, IL‐17, and IL‐9 and FACS analysis.
-
B, CRepresentative FACS plots depicting gating strategies for defining cytokine expression in panel (A); staining controls are in Appendix Fig S8.
-
D–FCD4+ and CD8+ T cells were stained with CD44, CD73, FR4, and PD1 to monitor the formation of anergic/exhausted T cells. (D) Percentages of each population. (E) Gating strategies. (F) FR4 and PD1 levels in WT versus EGR4−/− T cells.
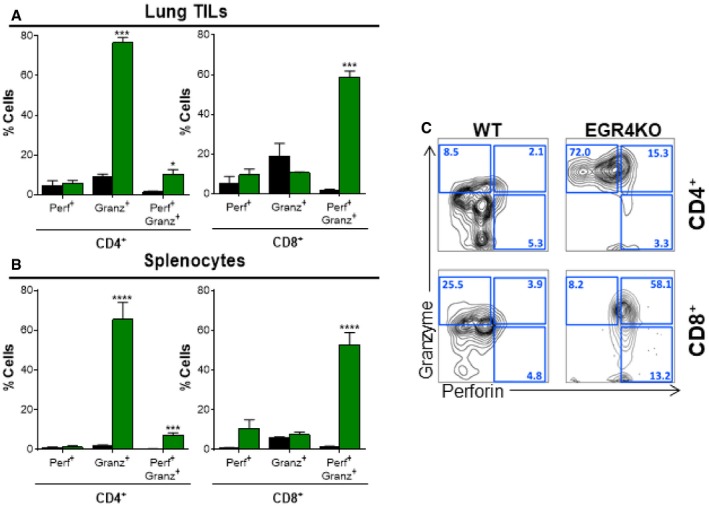
Immunotherapy, the so‐called 4th pillar of cancer therapy, can be a highly effective strategy to achieve durable remission due to its specificity combined with the long‐term maintenance of T‐cell memory. In practice, however, the effectiveness of TILs in recognizing and destroying tumor cells is limited by the ability of the tumor microenvironment to induce T‐cell anergy/exhaustion, polarization to the suppressor fate 64, decreased survival, and high‐level expression of inhibitory receptors, including PD‐1. Since other EGR factors had been shown to control induction of T‐cell anergy 5 and antigen‐specific T‐cell dysfunction in the tumor microenvironment 7 and since EGR4 deficiency promotes anti‐tumor immunity (Fig 7), we addressed the possibility that EGR4 plays a role in induction of anergy/exhaustion (Fig 8D–F). A minor EGR4‐dependent difference in CD44+ Foxp3− CD4+ T cells was observed alongside loss of Foxp3− CD44+ CD73‐hi cells (Fig 8D), particularly among CD8+ T cells. Within the Foxp3− CD44+ CD73‐hi population, we observed substantial accumulation of both CD4+ and CD8+ T cells expressing high levels of FR4 in WT, but not EGR4−/− mice (Fig 8E and F). Notably, the key EGR4‐dependent factor seemed to be FR4, which failed to undergo upregulation in the absence of EGR4, particularly in CD8+ T cells (Fig EV4C). Interestingly, CD44+ CD73hi FR4hi CD4+ T cells have been shown to represent an anergic state 65, while the generation of this population in CD8+ T cells has not previously been reported. Given the marked decrease in Treg infiltration between WT and EGR4−/− tumors (Fig 7E) and in the growth and metastasis of melanoma (Fig 7A–D), it is reasonable to speculate that this difference reflects a fundamental EGR4‐dependent alteration in anergy induction. Since no change in PD1 expression was observed between WT and EGR4−/− TILs (Fig 8F), these observations may reveal a previously undefined role of FR4 in anergy/exhaustion. Further, we evaluated cytotoxic effector function of both WT and EGR4−/− TILs and splenocytes. Consistent with our in vitro results (see above), EGR4−/− CD4+ T cells exhibited a dramatic increase in granzyme B‐ and/or perforin‐producing cells, indicating a role for EGR4 in inhibition of CD4+ CTL induction (Fig EV4). EGR4−/− CD8+ TILs also exhibited increased cytotoxic T‐cell differentiation, although, in this case, uniformly producing both perforin and granzyme B. Thus, loss of EGR4 not only attenuates induction of anergy/exhaustion in the immunosuppressive tumor microenvironment, but also promotes cytotoxic effector differentiation.
Figure EV4. Increased perforin/granzyme expression in EGR4−/− T cells.
-
A, BCD4+ and CD8+ cells were stimulated in vitro under Th1 conditions in the presence of 25 U/ml IL‐2 before intracellular staining for perforin and granzyme B and FACS analysis. Data are mean ± SEM; tumor infiltrates (A) and splenocytes (B) from 10 WT and 4 EGR4−/− mice were examined.
-
CRepresentative FACS plots showing cell distributions after staining for perforin and granzyme B. EGR4‐mediated differences were determined by paired two‐tailed t‐tests, with significant differences marked by asterisks. *P < 0.05; ***P < 0.001; ****P < 0.0001.
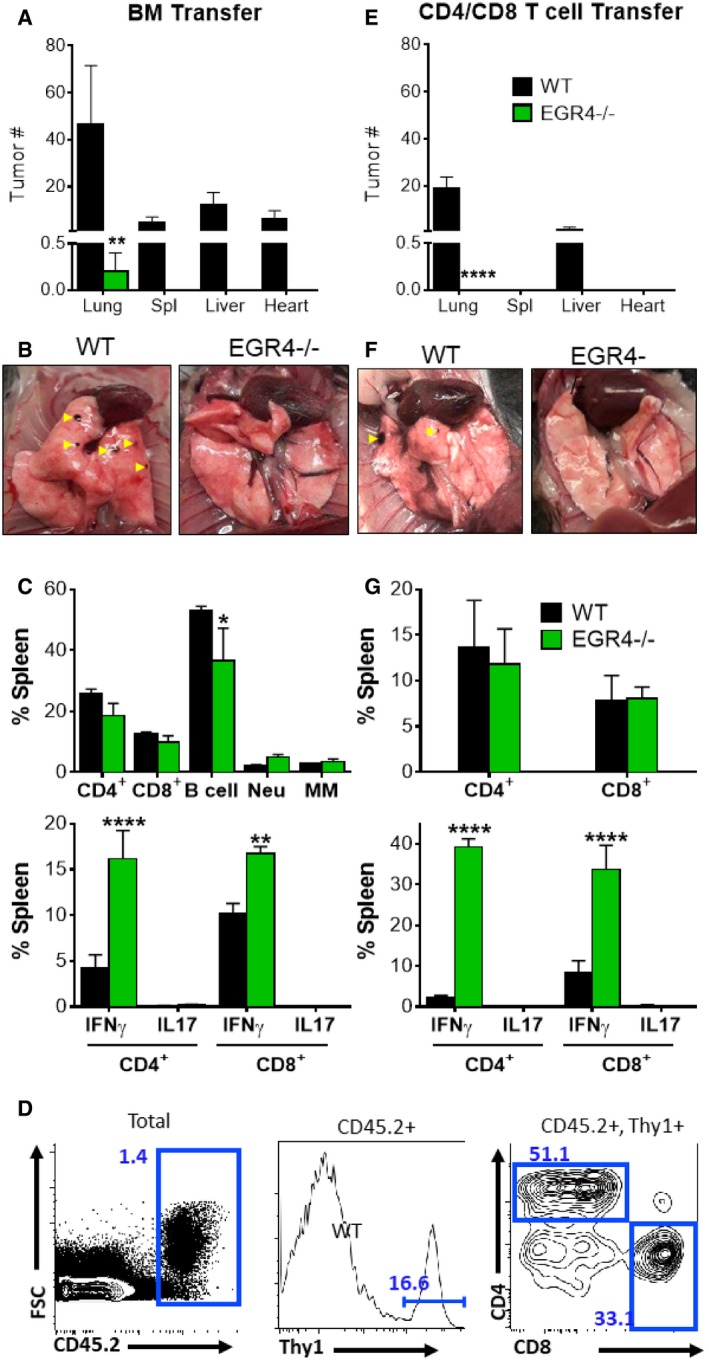
Finally, to differentiate between T‐cell intrinsic and extrinsic effects of EGR4 deficiency, we compared melanoma invasiveness in Rag−/− mice after adoptive transfer of WT versus EGR4−/− bone marrow (BM) (Fig EV5A–C) or total T cells (Fig EV5D–G). After a 2‐month rest period, allowing for full reconstitution of the hematopoietic compartment by transferred BM cells, mice were injected i.v. with melanoma cells (similar to the experiments described in Fig 7). Importantly, we observed significantly more tumors in mice reconstituted with WT BM (Fig EV5A and B) or T cells only (Fig EV5E and F), than in hosts reconstituted with equivalent EGR4−/− cells. Indeed, only one tumor was observed in a mouse reconstituted with EGR4−/− BM cells (Fig EV5A and B), and none in mice reconstituted with EGR4−/− T cells (Fig EV5E and F). Similar to our findings in Fig 7, no significant changes in CD4+ or CD8+ ratios were observed in the spleens of host mice after melanoma challenge. However, EGR4−/− T cells exhibited substantial increases in IFNγ production (Fig EV5C and G). Based on these findings, we conclude that Th1 bias and anti‐tumor immunity in EGR4−/− mice reflect a T‐cell intrinsic property.
Figure EV5. EGR4KO T cells exhibit enhanced anti‐tumor immunity.
-
A–CBone marrow (BM) was collected from WT and EGR4−/− mice and reconstituted in RagKO mice.
-
D–GCD4+ and CD8+ T cells were sorted as depicted (D) before reconstituting in RagKO mice. Mice were sacrificed 21 days after i.v. injection with B6N melanoma cells. Tumor infiltration (black spots marked with yellow arrowheads; B, F) was observed in mice reconstituted with WT bone marrow (A, B) or T cells (E, F), but not after reconstitution with EGR4KO cells.
-
C, GSince there were no tumors in mice reconstituted with EGR4KO cells, only splenocytes were compared; cytokine expression was determined by flow cytometry after a 5‐h stimulation with ionomycin and PMA. Data in panels (A, C, E, and G) are mean ± SEM; data are from RagKO mice containing either bone marrow or T cells from 4 WT or 4 EGR4−/− mice. EGR4‐mediated differences were determined by two‐way ANOVA, with significant differences marked by asterisks. *P < 0.05; **P < 0.01; ****P < 0.0001 (N = 4).
Discussion
While numerous detailed studies of the roles of EGR1, EGR2, and EGR3 factors in T‐cell development and differentiation have been carried out over many years, the potential contributions of EGR4 have been largely overlooked. Our current investigations reveal EGR4 as a critical and non‐redundant regulator of T‐cell differentiation. Thus, mature T cells arising in EGR4−/−mice display dramatic activation‐dependent increases in clonal expansion, cytokine production, and anti‐tumor immunity. Indeed, some of these effects are already apparent in unstimulated naïve CD4+ T cells. We further establish that loss of EGR4 leads to dysregulation of potassium channel expression and function, ultimately leading to persistent increases in Ca2+ entry that drives NFAT activation. Precisely, how potassium channel activity would achieve this was not fully established; since the primary driver of Ca2+ responses during T‐cell activation is TCR‐mediated PLC activity, we would speculate that increased potassium channel expression would enhance Orai1 activation, thereby boosting subsequent Ca2+ responses. We would further speculate that the early termination of Ca2+ responses in EGR4−/− CD4+ T cells reflects the early onset of the Ca2+ response, i.e., the duration of the Ca2+ response may be self‐limiting in this T‐cell subtype. Irrespective, either potassium channel or SOCE inhibitors blocks increases in both Ca2+ signals and IFNγ production in EGR4−/− T cells. Therefore, these observations provide a clear mechanistic link between increased Ca2+ signals observed in activated EGR4−/− cells and enhanced IFNγ production, likely to be critical for the generation of cytotoxic T cells and diminished generation of Tregs, both of which presumably contribute to enhanced anti‐tumor immunity in EGR4−/− mice.
Although the current investigation focused largely on IFNγ, several other cytokines were also upregulated in EGR4−/− T cells. Interestingly, though potassium channel and SOCE inhibitors dramatically inhibited IFNγ production, they only marginally affected the expression of these other cytokines, suggesting that EGR4 may serve a negative regulatory role in their expression, the basis for which will be investigated in future studies. Overall, our present study shows, for the first time, that EGR4 regulates T‐cell differentiation through suppression of KCa3.1 expression/activity for control of Ca2+ entry. Further, we have established the implications of this signaling loop for anti‐tumor immunity through control of both iTreg CTL generation. Overall, these investigations reveal a fundamental and previously undefined role for EGR4 as a brake for T‐cell differentiation, with profound potential implications to the treatment of immunological disorders.
Materials and Methods
T‐cell collection
Lymph nodes from WT or EGR KO C57BL/6 mice were excised, crushed, and strained into a single cell suspension. CD4+ or CD8+ cells were then purified using a negative selection kit as per the manufacturer's instructions (EasySep). For some experiments, naïve T cells were isolated by FACS based on the presence of CD90 as well as either CD4 or CD8 in the absence of CD44 (and confirmed by FACS that these cells were also CD69, CD62lhi). Purified CD4+ and CD8+ cells were cultured in RPMI 1640 + l‐glutamine (Corning) supplemented with 10% FBS and penicillin/streptomycin at 37°C and 5% CO2.
Quantitative PCR
qPCR was performed as previously described 26. RNA was extracted using RNA Bee (Tel‐Test) followed by addition of 0.2 ml chloroform per 1 ml RNA Bee and phase separation by centrifugation. RNA was precipitated from the aqueous phase with isopropanol, spun down, and washed with 75% ethanol. Libraries of cDNA were generated using the High Capacity cDNA Reverse Transcription Kit (Applied Biosystems) and quantitative PCR performed using PowerUp SYBR Green Master Mix (Applied Biosystems) on a 7300 Real‐Time PCR instrument (Thermo Fisher Scientific). Data are presented as the target expression level normalized to control (CD3ε) expression level with the following primers: EGR1 sense (5′‐GCGGCCAGTATAGGTGAT‐3′), antisense (5′‐CGATGGTGGAGACGAGTT‐3′); EGR2 sense (5′‐TCCCGTATCCGAGTAGC‐3′), antisense (5′‐TTGCCCATGTAAGTGAAG‐3′) EGR3 sense (5′‐CGACTCGGTAGCCCATTACA‐3′), antisense (5′‐AGTAGGTCACGGTCTTGTTGC‐3′); EGR4 sense (5′‐CAGCGACC ACCTCACCA‐3′), antisense (5′‐CTGTGCCGTTTCTTCTCGT‐3′); STIM1 sense (5′‐TTCAGGAAAGGCTGCACAAG‐3′), antisense (5′‐TACTTCCACAGTTCGGTGCT‐3′); STIM2 sense (5′‐CACTCCCCAGGATAGCAGTT‐3′), antisense (5′‐GTGACTTCGGTCGCTGATTT‐3′); Orai1 sense (5′‐TAGACTGCCTGATCGGATGG‐3′), antisense (5′‐TTAGTGTTTTGTCCC CGAGC‐3′); Orai2 sense (5′‐CACCATGAGTGCAGAGCTCA‐3′), antisense (5′‐TCTCGGTAA TCCATGCCCTT‐3′); Orai3 sense (5′‐TCCCTTCTTGGGGATACAAG‐3′), antisense (5′‐CCT GAGAGCAGTTACACCAC‐3′); PMCA4a sense (5′‐GTTCCTAGCTCCTATTCCGC‐3′), antisense (5′‐ACAGGAGGAGATGTAACTGC ‐3′); PMCA4b sense (5′‐ACTCAGATCAGAGTCGT‐3′), antisense (5′‐TTGGGTTTATGAGCAACTTC‐3′); POST sense (5′‐TGCTGTAGAGAGATCA GTGCGT‐3′), antisense (5′‐CTGGCCTTTGGGACCTATGA‐3′); and CD3ε sense (5′‐ACACTCTT CTCTGGGATGGA‐3′), antisense (5′‐TCTATAAATGGGGCAGGACC‐3′). Note that PMCA4 splice variant‐specific primers were designed by targeting exon 20 to specifically amplify PMCA4a; to specifically amplify PMCA4b, which skips exon 20, primers were designed to span the splice site between exons 19 and 21 58, 66. The specificity of each primer pair was analyzed by DNA PAGE. Reactions from qPCR were run on a 12% gel followed by ethidium bromide staining. Predicted amplicon size for PMCA4a primers is 61 base pairs; predicted amplicon size for PMCA4b is 58 base pairs.
Ca2+ measurements
Cytosolic Ca2+ measurements were performed as previously described 25. Cells were serum starved in RPMI 1640 + l‐glutamine supplemented with 0.5% BSA for 3 h and then plated on coverslips coated with poly‐D‐lysine or anti‐CD3/CD28 (10 μg/ml). Cells were loaded with 2 μM fura‐2 acetoxymethyl ester (Invitrogen) for 30 min at 25°C in cation‐safe solution (107 mM NaCl, 7.2 mM KCl, 1.2 mM MgCl2, 11.5 mM glucose, 20 mM Hepes‐NaOH, 1 mM CaCl2, pH 7.2). Cells were washed and dye allowed to de‐esterify for 30 min at 25°C. Ca2+ measurements were made using a Leica DMI 6000B fluorescence microscope controlled by Slidebook Software (Intelligent Imaging Innovations; Denver, CO). Intracellular Ca2+ measurements are shown as 340/380 nm ratios obtained from single cells.
NFAT nuclear localization
T cells were stimulated with beads coated with either BSA or CD3/CD28 antibodies (BioLegend, San Diego, CA; 0.5–6 h). Cells were fixed with paraformaldehyde (3% v/v), permeabilized (3% BSA, 0.2% Triton X‐100), and stained with anti‐NFATc1 antibody. This was followed by FITC‐conjugated anti‐mouse antibodies and DAPI. Colocalization between NFATc1 and DAPI was determined by post‐acquisition analysis (LASX software, Leica) of images obtained using a Leica sp8 laser scanning microscope. Averages are presented as Pearson's correlations ± SEM of at least three independent experiments and analyzed by two‐way ANOVA to determine statistical significance.
Proliferation assays/cytokine measurement
FACS‐sorted CD4+ and CD8+ T cells were incubated with 5‐(and 6‐) carboxyfluorescein diacetate succinimidyl ester (CFSE; Dojindo; 5 μM) in PBS (37°C; 15 min). CFSE‐labeled cells were cultured in plate‐bound anti‐TCRβ or anti‐CD3/CD28 antibodies for 1–4 days prior to FACS analysis. Note that cells were routinely stained with propidium Iodide to identify and exclude dead cells. Generation analysis was performed using FlowJo Software. In parallel, cytokine concentrations in supernatants were determined using a cytokine bead array (BioLegend, San Diego, CA) after a 2‐day incubation according to the manufacturer's instructions. Foxp3 staining was carried out with the Foxp3 mAb clone MF23 and the BD Pharmingen Mouse Foxp3 Buffer Set (BD, cat. No. 560409), according to the manufacturer's instructions. Cytokine staining was carried out using the BD Fixation/Permeabilization Solution Kit (Cat. No. 554714), according to manufacturer's instructions. Briefly, cells were fixed in 100 μl of Cytofix/Cytoperm solution for 30 min at 4°C, washed twice in Perm/Wash solution, pelleted by centrifugation and resuspended in 100 μl of Perm/Wash solution with or without (FMO control) fluorochrome‐conjugated anti‐cytokine antibody at room temp. for 60 min. Cells were then washed twice with Perm/Wash solution and resuspended in Staining Buffer for FACS analysis.
Th polarization
Naïve CD4+ T cells from spleen and lymph nodes were enriched from 6‐week‐old mice using a T‐cell Isolation Kit II (BD Biosciences) and then FACS sorted for CD44‐CD69‐CD62lhi naïve CD4+ T cells. Cells were activated with 5 μg/ml plate‐bound anti‐CD3/CD28 antibodies (BioLegend, San Diego, CA) with or without IL‐2 (25 IU/ml). For Th0 conditions, anti‐IL‐4 (11B11; 20 μg/ml) and anti‐IFNγ (20 μg/ml) were added; for Th1 conditions, anti‐IL‐4 (11B11; 20 μg/ml) and IL‐12 (10 ng/ml) were added; for Th2 conditions, anti‐IFNγ (20 μg/ml) and IL‐4 (20 ng/ml) were added; for Th9 conditions, anti‐IFNγ (20 μg/ml), IL‐4 (20 ng/ml), and TGF‐β (2 ng/ml) were added; and for Th17 conditions, IL‐6 (10 ng/ml), TGF‐β (2 ng/ml), anti‐IFNγ (20 μg/ml), and IL‐4 (20 ng/ml) were added. For Treg polarization, TGF‐β (10 ng/ml), IL‐2 (100 U/ml), anti‐IFNγ (20 μg/ml), and IL‐4 (20 ng/ml) were added. Mouse IL‐12 and IL‐4 were from PeproTech, TGF‐β and IL‐6 were from R&D Systems, human IL‐2 was from Roche, and neutralizing antibodies to mouse IFNγ (XMG1.2) and IL‐4 (11B11) were from BD Biosciences. Cells were cultured for 5 days in RPMI medium 1640 containing 10 mM Hepes (pH 7.0), 10% (v/v) FBS, 2 mM l‐glutamine, antibiotics (complete medium), and 50 μM β‐mercaptoethanol.
Adoptive transfer experiments
Seven‐week‐old RAG−/− hosts were sublethally irradiated (250rads) and adoptively transferred 1 day later with 106 total bone marrow cells or total T cells (FACS sorted based on co‐expression of CD90 and either CD4 or CD8) from either EGR4−/− or WT donor mice. Reconstitution was verified by FACS analysis of PBLs from each host mouse 2 months after adoptive transfer.
Lung colonization assays
B16N melanoma cells expressing a GFP‐Luciferase reporter were cultured and counted using an automated cell counter (Bio‐Rad). Cells (1.25 × 10⁵) were administered by tail vein injection. Lung colonization and metastasis were determined by IVIS imaging immediately after injection and every 4 days until termination of the experiment. Prior to imaging, mice were anesthetized (isoflurane) and administered 200 μl of 15 mg/μl Luciferin (PerkinElmer; 3 g i.p.). On day 20, mice were sacrificed, tumors were localized and counted, and tissues were collected for histopathology.
TIL isolation
Tumors were dissected from mouse tissues at the end of each experiment, dissociated through a 50‐μm filter, and washed with PBS. TILs were further enriched by layering Ficoll–Hypaque after the cell suspension, followed by centrifugation for 15–30 min at 400 g. The buffy layer was isolated and washed twice with RPMI before staining and FACS analysis. To measure cytokine production, cells were stimulated with PMA/ionomycin for 6 h before fixation, intracellular staining, and FACS analysis.
Materials
Murine anti‐CD3 and anti‐CD28 antibodies were obtained from eBioscience (San Diego, CA). Poly‐D‐lysine was produced by Sigma‐Aldrich (Saint Louis, MO). Fura‐2 AM, senicapoc, and TRAM‐34 were purchased from Thermo Fisher Scientific (Waltham, MA). Thapsigargin was obtained from EMD Millipore (Billerica, MA). EGTA was obtained from EMD Millipore (Billerica, MA). Fluorescent‐conjugated anti‐mouse FOXP3 and Helios procured from BD Biosciences. CD4, CD8, Thy1.2, IFNg, IL4, IL‐17, IL‐9, FR4, CD73, CD25, PD1, Ly6 g, CD11b, B220, perforin, and granzyme were purchased from BioLegend (San Diego, CA).
Statistical analysis
Data were analyzed by one‐way or two‐way ANOVA where appropriate using GraphPad Prism, as specified within the figure legends. Within Figs 1 and 3, statistical groups determined by Tukey's post hoc tests are conveyed by small letters to better differentiate multiple comparisons. Hence, group “a” is different (P < 0.05) from “b” is different (P < 0.05) from “c”. In some cases, specific experimental conditions were not significantly different from multiple groups. In this scenario, the condition was labeled with multiple letters.
Author contributions
JM‐B and RH performed and designed experiments, analyzed data, and contributed to the writing of the manuscript. EN, YT and BZ contributed to some experiments. BS, SG, CKG, ES, JL, and SH performed experiments and analyzed data. MRZ, WT, and YZ designed experiments and contributed to the writing of the manuscript. JS and DJK designed experiments, analyzed data, and wrote the manuscript.
Conflict of interest
The authors declare that they have no conflict of interest.
Supporting information
Appendix
Expanded View Figures PDF
Review Process File
Acknowledgements
We wish to thank Dr. David Wiest (Fox Chase Cancer Center) for critical review of the manuscript. JMB was supported by fellowship from W J Avery Foundation. This work was supported by NIH grants R01GM117907 (JS), 1R56AI43256 (JS/YZ), R01AI068907 (DJK), R01GM107179 (DJK), R01NS040748 (WT), K02NS046468 (WT), K26OD010945 (WT), and P30CA006927 (FCCC Comprehensive Cancer Center Core Grant).
EMBO Reports (2020) 21: e48904
Contributor Information
Dietmar J Kappes, Email: dietmar.kappes@fccc.edu.
Jonathan Soboloff, Email: soboloff@temple.edu.
Data availability
No primary datasets have been generated and deposited.
References
- 1. Beckmann AM, Matsumoto I, Wilce PA (1997) AP‐1 and Egr DNA‐binding activities are increased in rat brain during ethanol withdrawal. J Neurochem 69: 306–314 [DOI] [PubMed] [Google Scholar]
- 2. Gashler A, Sukhatme VP (1995) Early growth response protein 1 (Egr‐1): prototype of a zinc‐finger family of transcription factors. Prog Nucleic Acid Res Mol Biol 50: 191–224 [DOI] [PubMed] [Google Scholar]
- 3. Safford M, Collins S, Lutz MA, Allen A, Huang CT, Kowalski J, Blackford A, Horton MR, Drake C, Schwartz RH et al (2005) Egr‐2 and Egr‐3 are negative regulators of T cell activation. Nat Immunol 6: 472–480 [DOI] [PubMed] [Google Scholar]
- 4. Collins S, Lutz MA, Zarek PE, Anders RA, Kersh GJ, Powell JD (2008) Opposing regulation of T cell function by Egr‐1/NAB2 and Egr‐2/Egr‐3. Eur J Immunol 38: 528–536 [DOI] [PMC free article] [PubMed] [Google Scholar]
- 5. Zheng Y, Zha Y, Driessens G, Locke F, Gajewski TF (2012) Transcriptional regulator early growth response gene 2 (Egr2) is required for T cell anergy in vitro and in vivo . J Exp Med 209: 2157–2163 [DOI] [PMC free article] [PubMed] [Google Scholar]
- 6. Zheng Y, Zha Y, Spaapen RM, Mathew R, Barr K, Bendelac A, Gajewski TF (2013) Egr2‐dependent gene expression profiling and ChIP‐Seq reveal novel biologic targets in T cell anergy. Mol Immunol 55: 283–291 [DOI] [PMC free article] [PubMed] [Google Scholar]
- 7. Williams JB, Horton BL, Zheng Y, Duan Y, Powell JD, Gajewski TF (2017) The EGR2 targets LAG‐3 and 4‐1BB describe and regulate dysfunctional antigen‐specific CD8+ T cells in the tumor microenvironment. J Exp Med 214: 381–400 [DOI] [PMC free article] [PubMed] [Google Scholar]
- 8. Lohoff M, Giaisi M, Kohler R, Casper B, Krammer PH, Li‐Weber M (2010) Early growth response protein‐1 (Egr‐1) is preferentially expressed in T helper type 2 (Th2) cells and is involved in acute transcription of the Th2 cytokine interleukin‐4. J Biol Chem 285: 1643–1652 [DOI] [PMC free article] [PubMed] [Google Scholar]
- 9. Singh R, Miao T, Symonds ALJ, Omodho B, Li S, Wang P (2017) Egr2 and 3 inhibit T‐bet‐mediated IFN‐gamma production in T cells. J Immunol 198: 4394–4402 [DOI] [PMC free article] [PubMed] [Google Scholar]
- 10. Skerka C, Decker EL, Zipfel PF (1995) A regulatory element in the human interleukin 2 gene promoter is a binding site for the zinc finger proteins Sp1 and EGR‐1. J Biol Chem 270: 22500–22506 [DOI] [PubMed] [Google Scholar]
- 11. Kramer B, Meichle A, Hensel G, Charnay P, Kronke M (1994) Characterization of an Krox‐24/Egr‐1‐responsive element in the human tumor necrosis factor promoter. Biochem Biophys Acta 1219: 413–421 [DOI] [PubMed] [Google Scholar]
- 12. Carter JH, Lefebvre JM, Wiest DL, Tourtellotte WG (2007) Redundant role for early growth response transcriptional regulators in thymocyte differentiation and survival. J Immunol 178: 6796–6805 [DOI] [PubMed] [Google Scholar]
- 13. Tourtellotte WG, Nagarajan R, Bartke A, Milbrandt J (2000) Functional compensation by Egr4 in Egr1‐dependent luteinizing hormone regulation and Leydig cell steroidogenesis. Mol Cell Biol 20: 5261–5268 [DOI] [PMC free article] [PubMed] [Google Scholar]
- 14. Tourtellotte WG, Nagarajan R, Auyeung A, Mueller C, Milbrandt J (1999) Infertility associated with incomplete spermatogenic arrest and oligozoospermia in Egr4‐deficient mice. Development 126: 5061–5071 [DOI] [PubMed] [Google Scholar]
- 15. Smith‐Garvin JE, Koretzky GA, Jordan MS (2009) T cell activation. Annu Rev Immunol 27: 591–619 [DOI] [PMC free article] [PubMed] [Google Scholar]
- 16. Feske S, Draeger R, Peter HH, Eichmann K, Rao A (2000) The duration of nuclear residence of NFAT determines the pattern of cytokine expression in human SCID T cells. J Immunol 165: 297–305 [DOI] [PubMed] [Google Scholar]
- 17. Feske S, Draeger R, Peter HH, Rao A (2000) Impaired NFAT regulation and its role in a severe combined immunodeficiency. Immunobiology 202: 134–150 [DOI] [PubMed] [Google Scholar]
- 18. Oh‐Hora M, Yamashita M, Hogan PG, Sharma S, Lamperti E, Chung W, Prakriya M, Feske S, Rao A (2008) Dual functions for the endoplasmic reticulum calcium sensors STIM1 and STIM2 in T cell activation and tolerance. Nat Immunol 9: 432–443 [DOI] [PMC free article] [PubMed] [Google Scholar]
- 19. Sundrud MS, Rao A (2007) New twists of T cell fate: control of T cell activation and tolerance by TGF‐beta and NFAT. Curr Opin Immunol 19: 287–293 [DOI] [PubMed] [Google Scholar]
- 20. Feske S (2007) Calcium signalling in lymphocyte activation and disease. Nat Rev Immunol 7: 690–702 [DOI] [PubMed] [Google Scholar]
- 21. Liu X, Berry CT, Ruthel G, Madara JJ, MacGillivray K, Gray CM, Madge LA, McCorkell KA, Beiting DP, Hershberg U et al (2016) T cell receptor‐induced nuclear factor kappaB (NF‐kappaB) signaling and transcriptional activation are regulated by STIM1‐ and orai1‐mediated calcium entry. J Biol Chem 291: 8440–8452 [DOI] [PMC free article] [PubMed] [Google Scholar]
- 22. Williams MA, Bevan MJ (2007) Effector and memory CTL differentiation. Annu Rev Immunol 25: 171–192 [DOI] [PubMed] [Google Scholar]
- 23. Vaeth M, Maus M, Klein‐Hessling S, Freinkman E, Yang J, Eckstein M, Cameron S, Turvey SE, Serfling E, Berberich‐Siebelt F et al (2017) Store‐operated Ca(2+) entry controls clonal expansion of T cells through metabolic reprogramming. Immunity 47: 664–679 e6 [DOI] [PMC free article] [PubMed] [Google Scholar]
- 24. Hermann‐Kleiter N, Baier G (2010) NFAT pulls the strings during CD4+ T helper cell effector functions. Blood 115: 2989–2997 [DOI] [PubMed] [Google Scholar]
- 25. Ritchie MF, Samakai E, Soboloff J (2012) STIM1 is required for attenuation of PMCA‐mediated Ca2+ clearance during T‐cell activation. EMBO J 31: 1123–1133 [DOI] [PMC free article] [PubMed] [Google Scholar]
- 26. Samakai E, Hooper R, Martin KA, Shmurak M, Zhang Y, Kappes DJ, Tempera I, Soboloff J (2016) Novel STIM1‐dependent control of Ca2+ clearance regulates NFAT activity during T‐cell activation. FASEB J 30: 3878–3886 [DOI] [PMC free article] [PubMed] [Google Scholar]
- 27. Feske S, Gwack Y, Prakriya M, Srikanth S, Puppel SH, Tanasa B, Hogan PG, Lewis RS, Daly M, Rao A (2006) A mutation in Orai1 causes immune deficiency by abrogating CRAC channel function. Nature 441: 179–185 [DOI] [PubMed] [Google Scholar]
- 28. Hogan PG, Lewis RS, Rao A (2010) Molecular basis of calcium signaling in lymphocytes: STIM and ORAI. Annu Rev Immunol 28: 491–533 [DOI] [PMC free article] [PubMed] [Google Scholar]
- 29. Feske S, Picard C, Fischer A (2010) Immunodeficiency due to mutations in ORAI1 and STIM1. Clin Immunol 135: 169–182 [DOI] [PMC free article] [PubMed] [Google Scholar]
- 30. Picard C, McCarl CA, Papolos A, Khalil S, Luthy K, Hivroz C, LeDeist F, Rieux‐Laucat F, Rechavi G, Rao A et al (2009) STIM1 mutation associated with a syndrome of immunodeficiency and autoimmunity. N Engl J Med 360: 1971–1980 [DOI] [PMC free article] [PubMed] [Google Scholar]
- 31. Gwack Y, Feske S, Srikanth S, Hogan PG, Rao A (2007) Signalling to transcription: store‐operated Ca2+ entry and NFAT activation in lymphocytes. Cell Calcium 42: 145–156 [DOI] [PubMed] [Google Scholar]
- 32. Vig M, Beck A, Billingsley JM, Lis A, Parvez S, Peinelt C, Koomoa DL, Soboloff J, Gill DL, Fleig A et al (2006) CRACM1 multimers form the ion‐selective pore of the CRAC channel. Curr Biol 16: 2073–2079 [DOI] [PMC free article] [PubMed] [Google Scholar]
- 33. Hara S, Arai M, Tomaru K, Doi H, Koitabashi N, Iso T, Watanabe A, Tanaka T, Maeno T, Suga T et al (2008) Prostaglandin F2alpha inhibits SERCA2 gene transcription through an induction of Egr‐1 in cultured neonatal rat cardiac myocytes. Int Heart J 49: 329–342 [DOI] [PubMed] [Google Scholar]
- 34. Arai M, Yoguchi A, Takizawa T, Yokoyama T, Kanda T, Kurabayashi M, Nagai R (2000) Mechanism of doxorubicin‐induced inhibition of sarcoplasmic reticulum Ca(2+)‐ATPase gene transcription. Circ Res 86: 8–14 [DOI] [PubMed] [Google Scholar]
- 35. Scharf M, Neef S, Freund R, Geers‐Knorr C, Franz‐Wachtel M, Brandis A, Krone D, Schneider H, Groos S, Menon MB et al (2013) Mitogen‐activated protein kinase‐activated protein kinases 2 and 3 regulate SERCA2a expression and fiber type composition to modulate skeletal muscle and cardiomyocyte function. Mol Cell Biol 33: 2586–2602 [DOI] [PMC free article] [PubMed] [Google Scholar]
- 36. Wang C, Dostanic S, Servant N, Chalifour LE (2005) Egr‐1 negatively regulates expression of the sodium‐calcium exchanger‐1 in cardiomyocytes in vitro and in vivo . Cardiovasc Res 65: 187–194 [DOI] [PubMed] [Google Scholar]
- 37. Kasneci A, Kemeny‐Suss NM, Komarova SV, Chalifour LE (2009) Egr‐1 negatively regulates calsequestrin expression and calcium dynamics in ventricular cells. Cardiovasc Res 81: 695–702 [DOI] [PubMed] [Google Scholar]
- 38. Carleton M, Haks MC, Smeele SA, Jones A, Belkowski SM, Berger MA, Linsley P, Kruisbeek AM, Wiest DL (2002) Early growth response transcription factors are required for development of CD4(‐)CD8(‐) thymocytes to the CD4(+)CD8(+) stage. J Immunol 168: 1649–1658 [DOI] [PubMed] [Google Scholar]
- 39. Zipfel PF, Decker EL, Holst C, Skerka C (1997) The human zinc finger protein EGR‐4 acts as autoregulatory transcriptional repressor. Biochim Biophys Acta 1354: 134–144 [DOI] [PubMed] [Google Scholar]
- 40. Wyss L, Stadinski BD, King CG, Schallenberg S, McCarthy NI, Lee JY, Kretschmer K, Terracciano LM, Anderson G, Surh CD et al (2016) Affinity for self antigen selects Treg cells with distinct functional properties. Nat Immunol 17: 1093–1101 [DOI] [PMC free article] [PubMed] [Google Scholar]
- 41. Haks MC, Lefebvre JM, Lauritsen JP, Carleton M, Rhodes M, Miyazaki T, Kappes DJ, Wiest DL (2005) Attenuation of gammadeltaTCR signaling efficiently diverts thymocytes to the alphabeta lineage. Immunity 22: 595–606 [DOI] [PubMed] [Google Scholar]
- 42. Tuttle KD, Krovi SH, Zhang J, Bedel R, Harmacek L, Peterson LK, Dragone LL, Lefferts A, Halluszczak C, Riemondy K et al (2018) TCR signal strength controls thymic differentiation of iNKT cell subsets. Nat Commun 9: 2650 [DOI] [PMC free article] [PubMed] [Google Scholar]
- 43. Hamalainen H, Zhou H, Chou W, Hashizume H, Heller R, Lahesmaa R (2001) Distinct gene expression profiles of human type 1 and type 2 T helper cells. Genome Biol 2: RESEARCH0022 [DOI] [PMC free article] [PubMed] [Google Scholar]
- 44. Sharma V, Delgado M, Ganea D (2006) Granzyme B, a new player in activation‐induced cell death, is down‐regulated by vasoactive intestinal peptide in Th2 but not Th1 effectors. J Immunol 176: 97–110 [DOI] [PubMed] [Google Scholar]
- 45. Joshi NS, Cui W, Chandele A, Lee HK, Urso DR, Hagman J, Gapin L, Kaech SM (2007) Inflammation directs memory precursor and short‐lived effector CD8(+) T cell fates via the graded expression of T‐bet transcription factor. Immunity 27: 281–295 [DOI] [PMC free article] [PubMed] [Google Scholar]
- 46. Kalia V, Sarkar S, Subramaniam S, Haining WN, Smith KA, Ahmed R (2010) Prolonged interleukin‐2Ralpha expression on virus‐specific CD8+ T cells favors terminal‐effector differentiation in vivo . Immunity 32: 91–103 [DOI] [PubMed] [Google Scholar]
- 47. Pipkin ME, Sacks JA, Cruz‐Guilloty F, Lichtenheld MG, Bevan MJ, Rao A (2010) Interleukin‐2 and inflammation induce distinct transcriptional programs that promote the differentiation of effector cytolytic T cells. Immunity 32: 79–90 [DOI] [PMC free article] [PubMed] [Google Scholar]
- 48. Nakagawa H, Sido JM, Reyes EE, Kiers V, Cantor H, Kim HJ (2016) Instability of Helios‐deficient Tregs is associated with conversion to a T‐effector phenotype and enhanced antitumor immunity. Proc Natl Acad Sci USA 113: 6248–6253 [DOI] [PMC free article] [PubMed] [Google Scholar]
- 49. Macian F, Garcia‐Rodriguez C, Rao A (2000) Gene expression elicited by NFAT in the presence or absence of cooperative recruitment of Fos and Jun. EMBO J 19: 4783–4795 [DOI] [PMC free article] [PubMed] [Google Scholar]
- 50. Yoshida H, Nishina H, Takimoto H, Marengere LE, Wakeham AC, Bouchard D, Kong YY, Ohteki T, Shahinian A, Bachmann M et al (1998) The transcription factor NF‐ATc1 regulates lymphocyte proliferation and Th2 cytokine production. Immunity 8: 115–124 [DOI] [PubMed] [Google Scholar]
- 51. Vaeth M, Feske S (2018) NFAT control of immune function: new frontiers for an abiding trooper. F1000Res 7: 260 [DOI] [PMC free article] [PubMed] [Google Scholar]
- 52. Martinez GJ, Pereira RM, Aijo T, Kim EY, Marangoni F, Pipkin ME, Togher S, Heissmeyer V, Zhang YC, Crotty S et al (2015) The transcription factor NFAT promotes exhaustion of activated CD8(+) T cells. Immunity 42: 265–278 [DOI] [PMC free article] [PubMed] [Google Scholar]
- 53. He LP, Hewavitharana T, Soboloff J, Spassova MA, Gill DL (2005) A functional link between store‐operated and TRPC channels revealed by the 3,5‐bis(trifluoromethyl)pyrazole derivative, BTP2. J Biol Chem 280: 10997–11006 [DOI] [PubMed] [Google Scholar]
- 54. Zitt C, Strauss B, Schwarz EC, Spaeth N, Rast G, Hatzelmann A, Hoth M (2004) Potent inhibition of Ca2+ release‐activated Ca2+ channels and T‐lymphocyte activation by the pyrazole derivative BTP2. J Biol Chem 279: 12427–12437 [DOI] [PubMed] [Google Scholar]
- 55. Ishikawa J, Ohga K, Yoshino T, Takezawa R, Ichikawa A, Kubota H, Yamada T (2003) A pyrazole derivative, YM‐58483, potently inhibits store‐operated sustained Ca2+ influx and IL‐2 production in T lymphocytes. J Immunol 170: 4441–4449 [DOI] [PubMed] [Google Scholar]
- 56. Ritchie MF, Yue C, Zhou Y, Houghton PJ, Soboloff J (2010) Wilms tumor suppressor 1 (WT1) and early growth response 1 (EGR1) are regulators of STIM1 expression. J Biol Chem 285: 10591–10596 [DOI] [PMC free article] [PubMed] [Google Scholar]
- 57. Krapivinsky G, Krapivinsky L, Stotz SC, Manasian Y, Clapham DE (2011) POST, partner of stromal interaction molecule 1 (STIM1), targets STIM1 to multiple transporters. Proc Natl Acad Sci USA 108: 19234–19239 [DOI] [PMC free article] [PubMed] [Google Scholar]
- 58. Go CK, Hooper R, Aronson M, Cangoz T, Zhang Y, Nemani N, Madesh M, Soboloff J (2019) PMCA clears near‐membrane Ca2+ to facilitate store‐operated Ca2+ entry and NFAT activation. Sci Signal 2: eaaw2627 [DOI] [PMC free article] [PubMed] [Google Scholar]
- 59. Wang J, Xiang M (2013) Targeting potassium channels Kv1.3 and KC a 3.1: routes to selective immunomodulators in autoimmune disorder treatment? Pharmacotherapy 33: 515–528 [DOI] [PubMed] [Google Scholar]
- 60. Chimote AA, Hajdu P, Kucher V, Boiko N, Kuras Z, Szilagyi O, Yun YH, Conforti L (2013) Selective inhibition of KCa3.1 channels mediates adenosine regulation of the motility of human T cells. J Immunol 191: 6273–6280 [DOI] [PMC free article] [PubMed] [Google Scholar]
- 61. Nguyen HM, Singh V, Pressly B, Jenkins DP, Wulff H, Yarov‐Yarovoy V (2017) Structural insights into the atomistic mechanisms of action of small molecule inhibitors targeting the KCa3.1 channel pore. Mol Pharmacol 91: 392–402 [DOI] [PMC free article] [PubMed] [Google Scholar]
- 62. Ataga KI, Stocker J (2009) Senicapoc (ICA‐17043): a potential therapy for the prevention and treatment of hemolysis‐associated complications in sickle cell anemia. Expert Opin Investig Drugs 18: 231–239 [DOI] [PubMed] [Google Scholar]
- 63. Mervic L (2012) Time course and pattern of metastasis of cutaneous melanoma differ between men and women. PLoS ONE 7: e32955 [DOI] [PMC free article] [PubMed] [Google Scholar]
- 64. Alonso R, Flament H, Lemoine S, Sedlik C, Bottasso E, Peguillet I, Premel V, Denizeau J, Salou M, Darbois A et al (2018) Induction of anergic or regulatory tumor‐specific CD4(+) T cells in the tumor‐draining lymph node. Nat Commun 9: 2113 [DOI] [PMC free article] [PubMed] [Google Scholar]
- 65. Martinez RJ, Zhang N, Thomas SR, Nandiwada SL, Jenkins MK, Binstadt BA, Mueller DL (2012) Arthritogenic self‐reactive CD4+ T cells acquire an FR4hiCD73hi anergic state in the presence of Foxp3+ regulatory T cells. J Immunol 188: 170–181 [DOI] [PMC free article] [PubMed] [Google Scholar]
- 66. Strehler EE (2015) Plasma membrane calcium ATPases: from generic Ca(2+) sump pumps to versatile systems for fine‐tuning cellular Ca(2.). Biochem Biophys Res Commun 460: 26–33 [DOI] [PubMed] [Google Scholar]
Associated Data
This section collects any data citations, data availability statements, or supplementary materials included in this article.
Supplementary Materials
Appendix
Expanded View Figures PDF
Review Process File
Data Availability Statement
No primary datasets have been generated and deposited.


