

Abstract
Objective:
The 2-year risk of psychosis in persons who meet research criteria for a high-risk syndrome is about 15%–25%; improvements in risk prediction accuracy would benefit the development and implementation of preventive interventions. The authors sought to assess polygenic risk score (PRS) prediction of subsequent psychosis in persons at high risk and to determine the impact of adding the PRS to a previously validated psychosis risk calculator.
Methods:
Persons meeting research criteria for psychosis high risk (N=764) and unaffected individuals (N=279) were followed for up to 2 years. The PRS was based on the latest schizophrenia and bipolar genome-wide association studies. Variables in the psychosis risk calculator included stressful life events, trauma, disordered thought content, verbal learning, information processing speed, and family history of psychosis.
Results:
For Europeans, the PRS varied significantly by group and was higher in the psychosis converter group compared with both the nonconverter and unaffected groups, but was similar for the nonconverter group compared with the unaffected group. For non-Europeans, the PRS varied significantly by group; the difference between the converters and nonconverters was not significant, but the PRS was significantly higher in converters than in unaffected individuals, and it did not differ between nonconverters and unaffected individuals. The R2 (R2 adjusted for the rate of disease risk in the population being studied, here assuming a 2-year psychosis risk between 10% and 30%) for Europeans varied between 9.2% and 12.3% and for non-Europeans between 3.5% and 4.8%. The amount of risk prediction information contributed by the addition of the PRS to the risk calculator was less than severity of disordered thoughts and similar to or greater than for other variables. For Europeans, the PRS was correlated with risk calculator variables of information processing speed and verbal memory.
Conclusions:
The PRS discriminates psychosis converters from nonconverters and modestly improves individualized psychosis risk prediction when added to a psychosis risk calculator. The schizophrenia PRS shows promise in enhancing risk prediction in persons at high risk for psychosis, although its potential utility is limited by poor performance in persons of non-European ancestry.
Schizophrenia affects about 1% of the general population (1). Typically emerging in late adolescence and early adulthood, the disorder is often chronic and disabling (2). Research criteria based on clinical features identify persons with an approximate 15%–25% risk of developing a psychotic disorder in 2 years (3–9). While about 200-fold higher than the 2-year risk of about 0.1% in adolescents and young adults, this level of prediction accuracy is still not optimal for the development and implementation of preventive interventions. Psychosis risk prediction improves when factors such as neurocognitive function (10–12), language patterns (13, 14), decline in social functioning (11, 12, 15), severity of specific symptoms (11, 16–19), stressful events, and trauma history (11, 20) are considered. In previous work, we developed a psychosis risk prediction model that included such clinical and historical variables. This model improved psychosis risk prediction in two separate cohorts of persons at high risk for psychosis, with areas under the receiver operating curve of 0.71 (11) and 0.74 (21).
Until recently, the defining feature of genetic risk was a family history of psychosis; however, most people who develop schizophrenia do not have a family history of the disorder (22). Incorporating a robust measure of genetic risk into existing psychosis risk prediction models offers a possibility of further improvements. Genome-wide association studies (GWASs) have identified many common genetic variants that are associated with an increased risk of schizophrenia (23), facilitating the development of polygenic risk scores (PRSs) for schizophrenia and other polygenic traits and disorders. Such PRSs reflect the cumulative genome-wide impact of common genetic variation on a given phenotype into a single measure of genetic risk. Studies have found that PRSs differentiated individuals already diagnosed with schizophrenia from unaffected individuals (22, 24–27), and various polygenic analyses have become standard tools for dissecting risk for polygenic disorders and related traits (28).
Our aim in this study was to validate the schizophrenia PRS prediction of subsequent psychosis in a cohort of persons at high risk based on clinical features. In addition, we examined the predictive value of a bipolar PRS. For comparisons with published schizophrenia studies, we compared the PRS in clinical high-risk individuals who developed psychosis with that in unaffected individuals. We further determined the impact of adding the PRS to our previously validated psychosis risk calculator.
METHODS
The North American Prodrome Longitudinal Study, phase 2 (NAPLS-2) (29), is a 2-year, eight-site study of predictors and mechanisms of conversion to psychosis that included 764 high-risk and 279 unaffected comparison subjects. Each site’s institutional review board approved the study, and participants provided written informed consent or assent, with a parent or guardian consenting for participants under age 18.
Raters used the Structured Interview for Psychosis-Risk Syndromes (SIPS) (30, 31) to determine whether participants met the Criteria for Psychosis-Risk States. Most of the high-risk group (93%) met the criteria for attenuated psychosis (unusual beliefs, paranoia, grandiosity, perceptual abnormalities, and/or disorganized communication); 4% met criteria involving family history of psychosis and significant functional deterioration over the past year. Psychosis conversion was defined by the “presence of psychosis” criteria (30, 31) (psychotic-severity positive symptoms that are seriously disorganizing or dangerous, and occur at least 1 hour/ day on average 4 days a week) and diagnosis based on the Structured Clinical Interview for DSM-IV-TR Axis I Disorders (32). Follow-ups occurred at 6-month intervals, and the date of conversion was estimated by clinical interview and/or medical records. Unaffected comparison subjects did not meet high-risk criteria and had no personal or family history of a psychotic disorder. Parental education was rated on a scale ranging from 1 to 9 (see Table 1 for details).
TABLE 1.
Demographic and clinical characteristics of included and excluded participants in analysis 1: impact of PRS on psychosis risk prediction in persons at clinical high risk and unaffected comparison subjectsa
| Characteristic | Clinical High Risk, Psychosis Converter | Clinical High Risk, Nonconverter | Unaffected Comparison Subjects | |||||||||
|---|---|---|---|---|---|---|---|---|---|---|---|---|
| Excludedb (N=14) | Included (N=80) | Excludedc (N=422) | Included (N=248) | Excludedd (N=63) | Included (N=216) | |||||||
| Mean | SD | Mean | SD | Mean | SD | Mean | SD | Mean | SD | Mean | SD | |
| Age (years) | 16.90 | 4.01 | 18.27 | 3.50 | 18.24 | 4.15 | 19.09 | 4.53 | 19.21 | 4.48 | 19.91 | 4.71 |
| Maternal educatione | 6.23 | 1.42 | 6.54 | 1.73 | 6.29 | 1.66 | 6.35 | 1.54 | 6.97 | 1.47 | 6.79 | 1.49 |
| Paternal educatione | 5.62 | 1.89 | 6.42 | 1.78 | 6.20 | 1.77 | 6.28 | 1.66 | 6.61 | 1.56 | 6.51 | 1.68 |
| N | % | N | % | N | % | N | % | N | % | N | % | |
| Male | 9 | 64.3 | 50 | 62.5 | 238 | 56.5 | 138 | 55.6 | 32 | 50.8 | 109 | 50.5 |
| Family history of psychosis | 2 | 14.3 | 16 | 20.3 | 54 | 12.9 | 45 | 18.1 | ||||
| Psychiatric diagnoses | ||||||||||||
| Schizophrenia spectrum disordersf | 7 | 50.0 | 34 | 40.0 | ||||||||
| Psychosis not otherwise specified | 6 | 42.9 | 28 | 35.0 | ||||||||
| Major depression with psychosis | 0 | 0.0 | 1 | 1.3 | ||||||||
| Bipolar disorder with psychosis | 0 | 0.0 | 6 | 7.5 | ||||||||
| Unknown | 1 | 7.1 | 11 | 13.7 | ||||||||
| Self-reported ancestry | ||||||||||||
| European | 6 | 42.9 | 47 | 58.8 | 252 | 60.0 | 136 | 54.8 | 31 | 49.2 | 121 | 56.0 |
| African (e.g., African, African Caribbean) | 1 | 7.1 | 11 | 13.8 | 53 | 12.6 | 53 | 21.4 | 6 | 9.5 | 42 | 19.4 |
| Interracial | 4 | 28.6 | 10 | 12.5 | 50 | 11.9 | 33 | 13.3 | 12 | 19.0 | 17 | 7.9 |
| Central or South American | 2 | 14.3 | 2 | 2.5 | 22 | 5.2 | 8 | 3.2 | 5 | 7.9 | 8 | 3.7 |
| South Asian (e.g., East Indian, Pakistani, Sri Lankan) | 1 | 7.1 | 3 | 3.8 | 8 | 1.9 | 6 | 2.4 | 1 | 1.6 | 7 | 3.2 |
| East Asian (e.g., Chinese, Japanese, Korean) | 0 | 0.0 | 4 | 5.0 | 22 | 5.2 | 7 | 2.8 | 5 | 7.9 | 17 | 7.9 |
| First Nations (e.g., North American Indian, Métis, Inuit) | 0 | 0.0 | 1 | 1.2 | 7 | 1.7 | 3 | 1.2 | 1 | 1.6 | 3 | 1.4 |
| Native Hawaiian/Pacific Islander | 0 | 0.0 | 1 | 1.2 | 1 | 0.2 | 1 | 0.4 | 1 | 1.6 | 0 | 0.0 |
| West/Central Asian and Middle Eastern (e.g., Egyptian, Lebanese, Emirati [United Arab Emirates], Afghan, Iranian) | 0 | 0.0 | 1 | 1.2 | 5 | 1.2 | 1 | 0.4 | 1 | 1.6 | 1 | 0.5 |
| Missing | 0 | 0.0 | 0 | 0.0 | 1 | 0.0 | 0 | 0.0 | 0 | 0.0 | 0 | 0.0 |
There were no significant differences between excluded and included individuals in any of the three groupings except in age for the clinical high-risk nonconverter group (p=0.014) and in self-reported ancestry for the unaffected comparison group (p=0.05).
Reasons for exclusion among psychosis converters: no DNA sample available (N=12), did not meet high-risk criteria from the Criteria for Psychosis-Risk States (N=2).
Reasons for exclusion among nonconverters: sibling exclusion (N=3), only did not meet high-risk criteria from the Criteria for Psychosis-Risk States (N=6), only no DNA sample available (N=25), only less than 2 years of follow-up (N=239), no DNA sample available and did not meet high-risk criteria from the Criteria of Psychosis-Risk States (N=3), less than 2 years of follow-up and did not meet high-risk criteria from the Criteria of Psychosis Risk States (N=5), less than 2 years of follow-up and no DNA sample available (N=131), less than 2 years of follow-up and sibling exclusion (N=5), less than 2 years of follow-up and no DNA sample available and did not meet high-risk criteria from the Criteria of Psychosis-Risk States (N=5).
Reasons for exclusion for unaffected individuals: sibling exclusion (N=11), no DNA sample available (N=52).
Parental education is scaled from 1 to 9, where 1=no schooling, 2=some primary school, 3=completed primary school, 4=some high school, 5=completed high school, 6=some college/technical school/undergraduate, 7=completed college/technical school/undergraduate, 8=some graduate/professional school, and 9=completed graduate/professional school.
Schizophrenia spectrum disorders included schizophrenia, schizophreniform disorder, schizoaffective disorder, and delusional disorder.
DNA Analysis
Rutgers University’s RUCDR Repository and the University of North Carolina’s Genomics Core sent DNA extracted from blood to the Broad Institute for analysis with the Illumina PsychArray, version 2, following standard protocols. Analysis of raw data followed the RICOPILI (Rapid Imputation and Computational Pipeline for Genome-Wide Association Studies) pipeline (33). Imputation used IMPUTE2 and the 1000 Genomes Project phase 1 reference panel. The Broad Institute provided both hard-call data and raw dosage data for further analyses. Further quality control included de- termination of cryptic relatedness with the KING software package (34).
Data Analysis
Calculation of the PRS.
We calculated the PRS from the schizophrenia GWAS results from the Psychiatric Genomics Consortium (PGC) (23). Based on the raw summary statistics, the PGC provides a list of linkage-disequilibrium pruned SNP association statistics (https://www.med.unc.edu/pgc/). The PRS is a sum of the number of reference alleles weighted by the natural logarithm of the published odds ratio. We included imputed SNPs with INFO score >0.8 and a reported p value #0.05 (23). In addition, we conducted exploratory analyses to examine the impact of varying the p value cutoff. We constructed a bipolar PRS on the basis of the most recent GWAS results (35). Since clumped summary statistics were not available, we filtered on INFO score>0.9 and minor allele frequency>0.01. We removed variant indels, strand-ambiguous SNPs, and duplicated SNPs. We performed clumping based on 500 kb and R2=0.25 using the NAPLS data set as a reference. We used the resulting summary statistics for PRS scoring as above.
For principal component analyses, we merged the NAPLS-2 hard-call and 1000 Genomes Project phase 1 results, removed mismatching SNPs (N=704) and SNPs with Hardy-Weinberg equilibrium (HWE) p values <1×10⁻³, and kept SNPs detected in all persons (shared SNPs, 516,485), followed by linkage disequilibrium pruning (window size=50, step size=5, R2=0.2), leaving 77,223 variants. A post hoc analysis revealed that the findings were robust to HWE thresholds, both with the overall sample and within the subgroup of European participants (the only subgroup large enough for separate analysis). Setting HWE to a more lenient p<1×10⁻⁵ produced a PRS that was highly correlated with the main analysis PRS (Pearson R2=0.97), and the logistic regression results were virtually identical. Similarly, within the European subgroup, the PRS assuming HWE p<1×10⁻⁵ was highly correlated with that derived with HWE p<1×10⁻³ (Pearson R2> 0.99), and again the logistic regression results were virtually identical.
We removed related individuals from the 1000 Genomes Project sample on the basis of the provided “cryptic relatedness” file (N=32), leaving 1,060 subjects. We conducted principal component analysis by projecting each subject’s genotype to the 1000 Genomes Project cohort. A scatterplot of the first and second principal components showed that persons from the NAPLS-2 and 1000 Genomes Project with the same self-reported ancestry clustered similarly (see Figure S1 in the online supplement).
We categorized individuals with values ≥−0.01 for the first principal component and values ≤−0.026 for the second principal component as European, and the remaining individuals as non-European. There was no difference in the proportion of Europeans among high-risk converters (26%) and nonconverters (24%) (Fisher’s exact test, two-tailed, p=0.7) and high-risk converters and unaffected individuals (32%) (p=0.2).
For stratified analyses, the PRS was the residual from the linear regression model of the first 10 principal components projected to the 1000 Genomes Project cohort for non-Europeans and the residual from the linear regression model of the within-European first 10 principal components for Europeans. For combined analyses of Europeans and non-Europeans, the PRS was the residual from the 10 principal components projected to the 1000 Genomes Project cohort.
Analysis 1: impact of PRS on psychosis risk prediction in persons at clinical high risk..
We excluded high-risk participants who did not meet the high-risk criteria from the Criteria for Psychosis-Risk States (21 participants exclusively met alternative criteria: schizotypy and age <18 years), participants without DNA samples, high-risk nonconverters who did not complete the 2-year study, and one randomly selected sibling of 17 sibling pairs, leaving 80 converters, 248 nonconverters, and 216 unaffected individuals. Table 1 compares the baseline characteristics of included and excluded participants, and the table footnotes provide details about reasons for exclusion.
We conducted analyses and produced figures with R (https://www.r-project.org/) and RStudio (https://rstudio.com/) using the rms (https://cran.r-project.org/web/packages/rms/index.html), Hmisc (https://cran.r-project.org/web/packages/Hmisc/index.html), survminer, (https://cran.r-project.org/web/packages/survminer/index.html) and tidyverse (https://dplyr.tidyverse.org/) packages. We compared PRS means by group and ancestry with analysis of variance and t tests and used logistic regression for our main analyses. Discrimination, reflecting how well the PRS differentiates converters from nonconverters, was evaluated by the area under the receiver operating curve (AUC) and explained variance with the Nagelkerke R2 calculated on the liability scale (R2 liability (36), which is adjusted to the estimated disease risk in the population being studied. For high-risk converter-nonconverter comparisons, we calculated the Nagelkerke R2 assuming 10%, 20%, and 30% conversion rates, as these reflect the range of reported estimates of 2-year psychosis risk (4, 19). For comparisons of converters with unaffected individuals, we assumed the population risk to be 1% (37). For comparisons of high-risk nonconverters to un-affected individuals, we guesstimated the population risk of developing a high-risk syndrome to be 5%.
We report results stratified by European and non-European ancestry, as the stratified analysis suggested that the effects of the PRS were greater for Europeans than non-Europeans, likely a consequence of the development of the PRS with mainly European individuals, as linkage disequilibrium and polymorphism heterogeneity are known to differ by ancestry. Furthermore, previous studies with larger sample sizes indicate significant effect modification by ancestry (38, 39).
We used 1,000 bootstrap resamples to adjust our discrimination estimates for “optimism,” the overestimation of effects that typically occurs with single estimates from the full data set (40).
Analysis 2: impact of adding PRS to clinical risk prediction models.
We used a time-to-event approach to evaluate the impact of adding the PRS to the psychosis risk calculator among the same participants used to develop the calculator (11) (demographic characteristics are summarized in Table S1 in the online supplement), stratified on European and non-European ancestry. For these analyses, 147 of the 742 participants who met high-risk criteria from the Criteria for Psychosis-Risk States were excluded because their postbaseline status was unknown, leaving 595 participants (238 Europeans, 357 non-Europeans). Participants were systematically followed until conversion to psychosis or up to 24 months; eight participants (four European, four non-European) who converted after 24 months were considered nonconverters for 2-year survival analyses; 84 participants (33 European, 51 non-European) were considered converters.
The psychosis risk calculator variables included age at baseline, number of undesirable stressful life events (Research Interview Life Events Scale) (41), trauma history (Childhood Trauma and Abuse Scale) (42), sum of SIPS items P1 and P2 (unusual thought content and suspiciousness, respectively, rescored to range from 0 to 3, with non-prodromal severity levels rescored to 0), verbal learning (Hopkins Verbal Learning Test–Revised, sum of trials 1–3) (43), processing speed (Brief Assessment of Cognition in Schizophrenia, symbol coding test), past-year decline in social function (Global Functioning: Social) (44), and family history of psychotic disorders in first-degree relatives (Family Interview for Genetic Studies) (45, 46).
Several variables had missing values (verbal learning, N=21; symbol coding test, N=22; stressful life events, N=69; family history of psychosis, N=2; decline in social function, N=1; traumas, N=82; PRS, N=84). Because missing data may produce biases and reduces sample size, for risk prediction modeling in the original publication and here, we imputed missing data with multivariate imputation by chained equations (47). With chained equations, the missing variable is predicted by iteratively cycling regression models conditional on all other variables in the model. We repeated this procedure in 15 bootstrapped resamples, using the Hmisc R algorithm are-gImpute. We then evaluated models with the Hmisc R algorithm fit.mult.impute applied to Cox proportional hazard models, thus adjusting variance and covariance estimates for imputation.
The likelihood ratio chi-square test was used to test the effect of adding variables to a model. We quantified the amount of added predictive information as the variance of predicted conversion probability in the risk calculator model alone (VRC) compared with the risk calculator model plus the PRS (VRC+PRS) as (12VRC/VRC+PRS) (https://www.fharrell.com/post/addvalue/).
RESULTS
Psychosis Conversion in Persons at Clinical High Risk
The average values for the PRS varied by group (F=9.4, p=0.0001) and were higher for high-risk converters compared with nonconverters (t=2.8, p=0.005) and un- affected individuals (t=4.1, p=0.0001) (Figure 1). The mean PRS was higher for nonconverters compared with unaffected individuals (t=1.9, p=0.05). The PRS did not differ by ancestry (F=0.01, p=0.9), but findings were stronger for European than non-European participants. For Europeans, the PRS varied by group (F=5.9, p=0.003) and was significantly higher in converters than in nonconverters (t=2.9, p=0.006) and un-affected individuals (t=3.8, p=0.0003), but it was similar for nonconverters compared with unaffected individuals (t=1.3, p=0.2). In non-Europeans, the mean PRS varied by group (F=3.7, p=0.03). The difference between converters and nonconverters was not significant (t=1.7, p=0.09), but the mean PRS was significantly higher in converters than in unaffected individuals (t=2.3, p=0.03), and it did not differ between nonconverters and unaffected individuals (t=1.0, p=0.3). Moreover, we observed no significant difference in PRS values between nonconverters who completed the 2-year follow-up and those who did not (t=0.8, p=0.4).
FIGURE 1. Box plot of distribution of the polygenic risk score (PRS) among high-risk converters and nonconverters to psychosis and unaffected individuals, of European and non-European ancestrya.
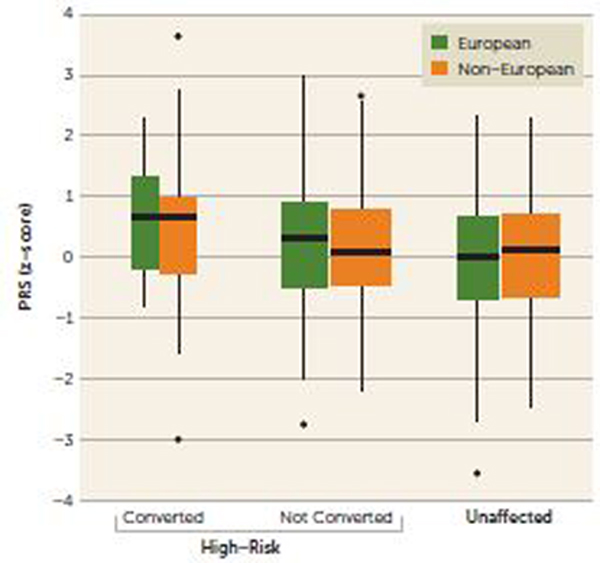
a European and non-European ancestry was assigned on the basis of the first and second principal components (see the Methods section; see also Figure S1 in the online supplement). The horizontal lines indicate the median, and the width of the box plot reflects the relative number of participants in each group.
The PRS predicted 2-year psychosis conversion in persons who met high-risk criteria from the Criteria of Psychosis-Risk States (Table 2). The PRS performed better for persons of European ancestry than for those of non-European ancestry; the AUC was higher for Europeans (0.65) than for non-Europeans (0.59), as was the R2liability, ranging from 9.2% to 12.3% for Europeans and 3.5% to 4.8% for non-Europeans.
TABLE 2.
Polygenic risk score and psychosis risk in individuals at clinical high risk and unaffected comparison subjectsa
| Group and Ancestry | Clinical High-Risk Subjects (N) | Unaffected Comparison Subjects (N) | Odds Ratio | 95% CI | Wald Z | p | AUC | R2 for 2-Year Population Psychosis Risk | R2 for 2-Year Population Psychosis Risk | R2 for 2-Year Population Psychosis Risk |
|---|---|---|---|---|---|---|---|---|---|---|
| Clinical high risk with psychosis conversion versus clinical high risk with no psychosis conversion | ||||||||||
| Risk, 10% | Risk, 20% | Risk, 30% | ||||||||
| European | 32 | 92 | 8.21 | 1.57, 43.1 | 2.44 | 0.015 | 0.65 | 0.092 | 0.112 | 0.123 |
| Non-European | 48 | 156 | 1.77 | 0.63, 4.94 | 2.00 | 0.046 | 0.59 | 0.035 | 0.043 | 0.048 |
| Clinical high risk with psychosis conversion versus unaffected comparison subjects | ||||||||||
| Risk, 1% | ||||||||||
| European | 32 | 70 | 22.17 | 3.88, 126 | 3.16 | 0.002 | 0.70 | 0.117 | ||
| Non-European | 48 | 146 | 2.38 | 0.83, 6.84 | 2.51 | 0.012 | 0.62 | 0.032 | ||
| Clinical high risk with no psychosis conversion versus unaffected comparison subjects | ||||||||||
| Risk, 5% | ||||||||||
| European | 92 | 70 | 1.83 | 0.67, 5.05 | 1.33 | 0.184 | 0.53 | 0.007 | ||
| Non-European | 156 | 146 | 1.44 | 0.70, 2.95 | 1.02 | 0.309 | 0.51 | <0.001 | ||
The main evaluation of polygenic risk score (PRS) risk prediction was prediction of 2-year psychosis in persons at clinical high risk. A secondary analysis compared PRS scores in persons who developed psychosis with those of unaffected comparison subjects. Individuals were considered European if the first principal component was ≥–0.01 and the second was ≤–0.026, and non-European otherwise (see Figure S1 in the online supplement). The PRS odds ratio compared the risk of psychosis conversion in persons in the highest PRS quintiles with the risk in those in the lowest PRS quintiles; p value is for the model containing the PRS alone. Area under the curve (AUC) and R2liability are corrected for optimism with 1,000 bootstrapped resamples. R2liability is adjusted for estimated population risk of psychosis.
Thirty-four converters had a schizophrenia spectrum diagnosis (eight European, 26 non-European), and 35 converters had a non–schizophrenia spectrum psychosis (19 European and 16 non-European) (see Table 1). In non- Europeans, the PRS effect was greater in persons with schizophrenia spectrum disorders (Wald Z=2.29, p=0.03) compared with those with non-schizophrenia psychoses (Wald Z=20.42, p=0.67). In Europeans, the PRS effect fell short of significance for the eight participants diagnosed with schizophrenia (Wald Z=1.39, p=0.16) but was significant for the 26 participants diagnosed with non-schizophrenia psychoses (Wald Z = 2.34, p = 0.02)
We explored the impact of choosing different GWAS significance thresholds for the PRS. Our results generalized well across different p value cutoffs, especially highly polygenic scores including SNPs with minimal association (see Table S2 in the online supplement).
Since schizophrenia and bipolar disorder have a high genetic correlation and overlap in symptoms(48), we computed a bipolar PRS based on the latest bipolar GWAS (35) across a range of GWAS significance thresholds, from 1×10⁻⁸ to 0.1. We observed no effect of the bipolar PRS in predicting psychosis conversion (e.g., with bipolar thresholded at p<0.05, p=0.8 for Europeans) (see Table S3 in the online supplement).
PRS in Clinical High-Risk Nonconverters Compared With Unaffected Comparison Subjects
The PRS did not differentiate high-risk nonconverters from unaffected comparison subjects in both Europeans and non-European (Table 2). Discrimination (AUC) and R2 liability were higher in the European (0.70 and 0.12, respectively) compared with the non-European (0.62 and 0.03, respectively) subgroups.
PRS in High-Risk Converters Compared With Unaffected Comparison Subjects
The PRS discriminated clinical high-risk converters from unaffected comparison subjects for both Europeans and non-Europeans R2 liability was less than 1% (Table 2).
Impact of Including PRS in the Psychosis Risk Calculator
As noted, we previously reported on a psychosis risk calculator based on variables gleaned from the literature and readily obtainable in general clinical settings; we validated the performance of the psychosis risk calculator in the NAPLS-2 cohort (11) as well as in a second cohort of clinical high-risk individuals (21).
When used alone in a survival model, the PRS predicted, although short of significantly, 2-year risk of psychosis in Europeans (Wald Z=1.58, p=0.10) and non-Europeans (Wald Z=1.86, p=0.06). The C-index (analogous to the AUC) for the PRS alone was 0.62 in Europeans and 0.57 in non-Europeans. The Nagelkerke R2 was 0.03 for Europeans and 0.01 for non-Europeans. The hazard ratio for the model with the PRS alone was 1.47 (95% CI=0.91, 2.37) in Europeans and 1.86 (95% CI=0.98, 2.23) in non-Europeans.
Overall (19), and in Europeans and non-European sub- groups, the 2-year conversion rate was 16%. As shown in Figure 2, for both Europeans and non-Europeans, conversion rates were highest for persons with PRS scores greater than 1.5 standard deviations from the mean, intermediate for persons with PRS scores between the mean and 1.5 standard deviations above the mean, and lowest for persons with scores less than the mean.
FIGURE 2. Kaplan-Meier curves of psychosis conversion stratified by polygenic risk score (PRS) score in Europeans and non-Europeansa.

aFor Europeans (panel A), p = 0.06; for non-Europeans (panel B), p = 0.048.
The performance of the risk calculator model plus the PRS was better than the performance of the risk calculator model without the PRS (Europeans: likelihood ratio x2=2.9, p=0.09; non-Europeans: likelihood ratio x2=1.9, p=0.17), suggesting that the PRS may add predictive value. Family history was included in the risk calculator as a proxy for genetic risk, but removing family history from the risk calculator model including the PRS did not affect model performance for Europeans (likelihood ratio x2=0.73, df=1, p=0.39); the effect in non-Europeans approached significance (likelihood ratio x2=2.83, df=1, p=0.09). The PRS was higher in persons with a family history of psychosis than in persons without a family history; the differences approached significance for non- Europeans (t=21.6, p=0.10) but not for Europeans (t=21.1 p=0.3).
The amount of risk prediction information contributed by the addition of the PRS to the risk calculator model was estimated as 15% for Europeans and 7% for non-Europeans. For comparison, the amount of added risk prediction information contributed to the risk calculator by severity of sum of SIPS items disordered thought content and paranoia was much greater (Europeans: 68%; non-Europeans: 25%), and the amount added by other variables was either similar or less: decline in social function (Europeans: 5%; non-Europeans: 8%), undesirable life events (Europeans: 0%; non-Europeans: 7%), age (Europeans: 3%; non-Europeans: 9%), verbal learning (Europeans: 3%; non-Europeans: 0%), in- formation processing speed (Europeans: 7%; non-Europeans: 3%), trauma history (Europeans: 0%; non-Europeans: 1%), and family history of psychosis (Europeans: 5%; non-Europeans: 7%). Together, family history of psychosis and PRS increased model explained variance 17% for Europeans and 9% for non-Europeans. A less sensitive measure of change in model performance, the C-index, was unchanged at 0.67 for the risk calculator plus the PRS compared with the risk calculator without the PRS for non-Europeans and increased from 0.70 to 0.71 for Europeans.
In Europeans, the PRS was modestly correlated with verbal memory (R2=20.14, p=0.04), information processing speed (R2=20.13, p=0.04), and trauma history (R2=20.14, p=0.04) but not with other risk calculator variables. In non-Europeans, the PRS was correlated only with decline in social function (R2=0.14, p=0.01).
DISCUSSION
Development of preventive interventions for schizophrenia hinges on identifying persons at elevated risk. Establishment of symptom-based criteria for elevated psychosis risk has been a crucial step toward this goal. The results of our study suggest that a schizophrenia PRS may further improve psychosis risk prediction.
We found that the schizophrenia PRS was modestly but significantly associated with psychosis risk in persons meeting clinical high-risk criteria, especially in persons of European ancestry. In persons of non-European ancestry, the predictive value of the PRS was low, likely because of the almost exclusive use of persons of European ancestry in the GWASs that generated the PRS (38, 39, 49). Studies comparing individuals with schizophrenia to unaffected individuals similarly find the PRS to discriminate well in Europeans, and minimally if at all in non-Europeans (24, 49, 50).
Our psychosis risk calculator includes clinical and historical factors that improve and individualize risk assessment in persons who meet high-risk criteria (11, 21), with family history a proxy for genetic risk. We found that the PRS further improves individualized risk assessment as part of a psychosis risk calculator (although short of significance), with the amount of added information similar to or greater than most other risk calculator variables, including family history. Similar to other studies (24, 26, 27, 51), and as shown in Figure 2, the impact of the PRS on psychosis risk prediction was greatest for those persons with PRS scores with the highest genetic load. Given that psychosis emerges over a 20-year period, our restriction to 2-year risk prediction is a limitation of our study (noting that eight persons who con- verted to psychosis after 2 years were considered non-converters in the survival analyses). Furthermore, within the European subgroup, the PRS was correlated with both risk calculator measures of cognition: information processing speed and verbal memory. Further study is needed to determine relationships between PRS, cognitive function do- mains, and psychosis risk (52).
As was reported in a first-episode psychosis study (24), we found evidence of specificity of the PRS for the prediction of schizophrenia spectrum psychoses, as the PRS better predicted schizophrenia than non-schizophrenia psychoses in non-Europeans. However, we did not detect such a difference in Europeans, but this is possibly a result of the small number of Europeans with schizophrenia spectrum diagnoses (N=8). The bipolar PRS did not predict psychosis risk.
The PRS was minimally associated with clinical high-risk status in nonconverters compared with unaffected individuals, with an R2liability of 0.007 in Europeans and <0.001 in non-Europeans. Attenuated-psychosis symptoms are similar to “psychotic-like experiences,” typically assessed by self-report and with lifetime prevalence estimated at about 6% (53). Consistent with our findings, a mega-analysis of three population-based studies of self-reported psychotic-like experiences in adolescents (N=6,297) found a significant relationship between the schizophrenia PRS and self- reported psychotic-like symptoms, but with a similarly low R2liability of 0.001 (54). These findings support the idea that the PRS is specific for psychosis vulnerability rather than for development of nonprogressive attenuated psychotic-like symptoms.
We included “case-control” analyses that compared converters to unaffected individuals, as has been done in other studies (22–25, 27). In Europeans, the PRS R2liability of 12% in high-risk converters compared with unaffected individuals overlaps with findings from other case-control schizophrenia studies. For example, in a study in which the genetic risk score was derived, the R2liability values for individual studies ranged from 2% to 14%, with a meta-analyzed value of 7% (23), and in a study of first-episode psychosis, the R2liability was 9.4% in European (24).
Further improvements in psychosis risk prediction based on heritable factors are expected (55). Use of a schizophrenia PRS in clinical practice hinges on improved accuracy, especially in persons of non-European ancestry, and GWASs that include individuals from diverse populations are essential (49). In addition, inherited or de novo genetic factors such as copy number variants, methylation marks, and rare but highly penetrant polymorphisms not captured in this analysis of common variants could be added, and improved algorithms to generate genetic risk scores are in development (55–58). With further improvements and given the relatively low cost and wide availability of genotyping, potential applications of the genetic risk scores to individualized psychosis risk screening warrant further investigation.
Supplementary Material
Acknowledgments
Supported by NIMH grant U01 MH081984 (to Dr. Addington); grant U01 MH081902 (to Dr. Cannon), grant P50 MH066286 (Prodromal Core) (to Dr. Bearden); grants R01 MH60720, U01 MH082022, and K24 MH76191 (to Dr. Cadenhead); grant U01 MH081857 (to Dr. Cornblatt); grant K99 MH116115 (to Dr. Olde Loohuis); grant U01 MH082004 (to Dr. Perkins); grants U01 MH081928, P50 MH080272, and Commonwealth of Massachusetts grant SCDMH82101008006 (to Dr. Seidman); grant U01 MH081988 (to Dr. Walker); and grant U01 MH082022 (to Dr. Woods). The Broad Institute funded the costs of performing the Illumina assays.
The authors acknowledge the assistance of the Broad Institute, and they thank Elise Robinson for her assistance in organizing the genetic analyses for this project and for her useful comments and suggestions.
Dr. Cannon has served as a consultant for Boehringer-Ingelheim Phar- maceuticals and Lundbeck A/S. Dr. Mathalon has served as a consultant for Aptinyx, Boehringer-Ingelheim Pharmaceuticals, Cadent Therapeutics, and Greenwich Biosciences. Dr. Perkins has served as a consultant for Sunovion and Alkermes, has received research support from Boehringer- Ingelheim, and has received royalties from American Psychiatric Association Publishing. Dr. Woods has received investigator-initiated research support from Pfizer and sponsor-initiated research support from Auspex and Teva; he has served as a consultant for Biomedisyn (unpaid), Boehringer-Ingelheim, and Merck and as an unpaid consultant to DSM-5; he has been granted a patent for a method of treating prodromal schizophrenia with glycine; and he has received royalties from Oxford University Press. The other authors report no financial relationships with commercial interests.
Contributor Information
Diana O. Perkins, Department of Psychiatry, University of North Carolina, Chapel Hill
Loes Olde Loohuis, Center for Neurobehavioral Genetics, University of California, Los Angeles
Jenna Barbee, Department of Psychiatry, University of North Carolina, Chapel Hill
John Ford, Lineberger Bioinformatics Core, University of North Carolina, Chapel Hill
Clark D. Jeffries, Renaissance Computing Institute, University of North Carolina, Chapel Hill
Jean Addington, Hotchkiss Brain Institute, Department of Psychiatry, University of Calgary, Alberta, Canada
Carrie E. Bearden, Departments of Psychiatry and Biobehavioral Sciences and Psychology, University of California, Los Angeles
Kristin S. Cadenhead, Department of Psychiatry, University of California, San Diego
Tyrone D. Cannon, Department of Psychology, Yale University, New Haven, Conn.
Barbara A. Cornblatt, Department of Psychiatry, Zucker Hillside Hospital, Glen Oaks, N.Y.
Daniel H. Mathalon, Department of Psychiatry, University of California, San Francisco
Thomas H. McGlashan, Department of Psychiatry, Yale University, New Haven, Conn.
Larry J. Seidman, Department of Psychiatry, Harvard Medical School at Beth Israel Deaconess Medical Center and Massachusetts General Hospital, Boston
Ming Tsuang, Center for Behavioral Genomics, Department of Psychiatry, University of California, San Diego
Elaine F. Walker, Departments of Psychology and Psychiatry, Emory University, Atlanta
Scott W. Woods, Department of Psychiatry, Yale University, New Haven, Conn.
REFERENCES
- 1.Perälä J, Suvisaari J, Saarni SI, et al. : Lifetime prevalence of psychotic and bipolar I disorders in a general population. Arch Gen Psychiatry 2007; 64:19–28 [DOI] [PubMed] [Google Scholar]
- 2.Jääskeläinen E, Juola P, Hirvonen N, et al. : A systematic review and meta- analysis of recovery in schizophrenia. Schizophr Bull 2013; 39:1296–1306 [DOI] [PMC free article] [PubMed] [Google Scholar]
- 3.Ziermans TB, Schothorst PF, Sprong M, et al. : Transition and re- mission in adolescents at ultra-high risk for psychosis. Schizophr Res 2011; 126:58–64 [DOI] [PubMed] [Google Scholar]
- 4.Fusar-Poli P, Bonoldi I, Yung AR, et al. : Predicting psychosis: meta-analysis of transition outcomes in individuals at high clinical risk. Arch Gen Psychiatry 2012; 69:220–229 [DOI] [PubMed] [Google Scholar]
- 5.Katsura M, Ohmuro N, Obara C, et al. : A naturalistic longitudinal study of at-risk mental state with a 2.4 year follow-up at a specialized clinic setting in Japan. Schizophr Res 2014; 158:32–38 [DOI] [PubMed] [Google Scholar]
- 6.Demjaha A, Valmaggia L, Stahl D, et al. : Disorganization/cognitive and negative symptom dimensions in the at-risk mental state predict subsequent transition to psychosis. Schizophr Bull 2012; 38:351–359 [DOI] [PMC free article] [PubMed] [Google Scholar]
- 7.Ruhrmann S, Schultze-Lutter F, Salokangas RK, et al. : Prediction of psychosis in adolescents and young adults at high risk: results from the prospective European Prediction of Psychosis Study. Arch Gen Psychiatry 2010; 67:241–251 [DOI] [PubMed] [Google Scholar]
- 8.DeVylder JE, Muchomba FM, Gill KE, et al. : Symptom trajectories and psychosis onset in a clinical high-risk cohort: the relevance of subthreshold thought disorder. Schizophr Res 2014; 159:278–283 [DOI] [PMC free article] [PubMed] [Google Scholar]
- 9.Nelson B, Yuen HP, Wood SJ, et al. : Long-term follow-up of a group at ultra high risk (“prodromal”) for psychosis: the PACE 400 study. JAMA Psychiatry 2013; 70:793–802 [DOI] [PubMed] [Google Scholar]
- 10.Seidman LJ, Shapiro DI, Stone WS, et al. : Association of neuro-cognition with transition to psychosis: baseline functioning in the second phase of the North American Prodrome Longitudinal Study. JAMA Psychiatry 2016; 73:1239–1248 [DOI] [PMC free article] [PubMed] [Google Scholar]
- 11.Cannon TD, Yu C, Addington J, et al. : An individualized risk calculator for research in prodromal psychosis. Am J Psychiatry 2016; 173:980–988 [DOI] [PMC free article] [PubMed] [Google Scholar]
- 12.Carrión RE, Correll CU, Auther AM, et al. : A severity-based clinical staging model for the psychosis prodrome: longitudinal findings from the New York Recognition and Prevention Program. Schizophr Bull 2017; 43:64–74 [DOI] [PMC free article] [PubMed] [Google Scholar]
- 13.Corcoran CM, Carrillo F, Fernández-Slezak D, et al. : Prediction of psychosis across protocols and risk cohorts using automated language analysis. World Psychiatry 2018; 17:67–75 [DOI] [PMC free article] [PubMed] [Google Scholar]
- 14.Rezaii N, Walker E, Wolff P: A machine learning approach to predicting psychosis using semantic density and latent content analysis. NPJ Schizophr 2019; 5:9. [DOI] [PMC free article] [PubMed] [Google Scholar]
- 15.Lo Cascio N, Curto M, Pasqualetti P, et al. : Impairment in social functioning differentiates youth meeting ultra-high risk for psychosis criteria from other mental health help-seekers: a validation of the Italian version of the Global Functioning: Social and Global Functioning: role scales. Psychiatry Res 2017; 253:296–302 [DOI] [PubMed] [Google Scholar]
- 16.Ciarleglio AJ, Brucato G, Masucci MD, et al. : A predictive model for conversion to psychosis in clinical high-risk patients. Psychol Med 2019; 49:1128–1137 [DOI] [PMC free article] [PubMed] [Google Scholar]
- 17.Schultze-Lutter F, Klosterkötter J, Ruhrmann S: Improving the clinical prediction of psychosis by combining ultra-high risk criteria and cognitive basic symptoms. Schizophr Res 2014; 154:100–106 [DOI] [PubMed] [Google Scholar]
- 18.Zhang T, Xu L, Tang Y, et al. : Prediction of psychosis in prodrome: development and validation of a simple, personalized risk calculator. Psychol Med 2018; 49:1990–1998 [DOI] [PubMed] [Google Scholar]
- 19.Perkins DO, Jeffries CD, Cornblatt BA, et al. : Severity of thought disorder predicts psychosis in persons at clinical high-risk. Schizophr Res 2015; 169:169–177 [DOI] [PMC free article] [PubMed] [Google Scholar]
- 20.Fusar-Poli P, Tantardini M, De Simone S, et al. : Deconstructing vulnerability for psychosis: meta-analysis of environmental risk factors for psychosis in subjects at ultra high-risk. Eur Psychiatry 2017; 40:65–75 [DOI] [PubMed] [Google Scholar]
- 21.Carrión RE, Cornblatt BA, Burton CZ, et al. : Personalized prediction of psychosis: external validation of the NAPLS-2 psychosis risk calculator with the EDIPPP project. Am J Psychiatry 2016; 173: 989–996 [DOI] [PMC free article] [PubMed] [Google Scholar]
- 22.Lu Y, Pouget JG, Andreassen OA, et al. : Genetic risk scores and family history as predictors of schizophrenia in Nordic registers. Psychol Med 2017; 48:1201–1208 [DOI] [PMC free article] [PubMed] [Google Scholar]
- 23.Schizophrenia Working Group of the Psychiatric Genomics Consortium: Biological insights from 108 schizophrenia-associated genetic loci. Nature 2014; 511:421–427 [DOI] [PMC free article] [PubMed]
- 24.Vassos E, Di Forti M, Coleman J, et al. : An examination of polygenic score risk prediction in individuals with first-episode psychosis. Biol Psychiatry 2017; 81:470–477 [DOI] [PubMed] [Google Scholar]
- 25.Wimberley T, Gasse C, Meier SM, et al. : Polygenic risk score for schizophrenia and treatment-resistant schizophrenia. Schizophr Bull 2017; 43:1064–1069 [DOI] [PMC free article] [PubMed] [Google Scholar]
- 26.Zheutlin AB, Dennis J, Linner RK, et al. : Penetrance and pleiotropy of polygenic risk scores for schizophrenia in 106,160 patients across four health care systems. Am J Psychiatry 2019; 176:846–855 [DOI] [PMC free article] [PubMed] [Google Scholar]
- 27.Calafato MS, Thygesen JH, Ranlund S, et al. : Use of schizophrenia and bipolar disorder polygenic risk scores to identify psychotic disorders. Br J Psychiatry 2018; 213:535–541 [DOI] [PMC free article] [PubMed] [Google Scholar]
- 28.Lewis CM, Vassos E: Prospects for using risk scores in polygenic medicine. Genome Med 2017; 9:96. [DOI] [PMC free article] [PubMed] [Google Scholar]
- 29.Addington J, Cadenhead KS, Cornblatt BA, et al. : North American Prodrome Longitudinal Study (NAPLS 2): overview and recruitment. Schizophr Res 2012; 142:77–82 [DOI] [PMC free article] [PubMed] [Google Scholar]
- 30.Miller TJ, McGlashan TH, Rosen JL, et al. : Prospective diagnosis of the initial prodrome for schizophrenia based on the Structured Interview for Prodromal Syndromes: preliminary evidence of interrater reliability and predictive validity. Am J Psychiatry 2002; 159:863–865 [DOI] [PubMed] [Google Scholar]
- 31.McGlashan TH, Walsh BC, Woods SW: The Psychosis Risk Syn- drome: Handbook for Diagnosis and Follow-Up. New York, Oxford University Press, 2010 [Google Scholar]
- 32.First MB, Spitzer RL, Gibbon M, et al. : Structured Clinical Interview for DSM-IV TR Axis I Disorders, Non-Patient Edition (SCID-I/NP). New York, New York State Psychiatric Institute, Biometrics Re- search, 2002 [Google Scholar]
- 33.Lam M, Awasthi S, Watson HJ, et al. : RICOPILI: Rapid Imputation for COnsortias PIpeLIne. Bioinformatics (Epub ahead of print, Au- gust 8, 2019) [DOI] [PMC free article] [PubMed] [Google Scholar]
- 34.Manichaikul A, Mychaleckyj JC, Rich SS, et al. : Robust relationship inference in genome-wide association studies. Bioinformatics 2010; 26:2867–2873 [DOI] [PMC free article] [PubMed] [Google Scholar]
- 35.Stahl EA, Breen G, Forstner AJ, et al. : Genomewide association study identifies 30 loci associated with bipolar disorder. Nat Genet 2019; 51: 793–803 [DOI] [PMC free article] [PubMed] [Google Scholar]
- 36.Lee SH, Goddard ME, Wray NR, et al. : A better coefficient of determination for genetic profile analysis. Genet Epidemiol 2012; 36: 214–224 [DOI] [PubMed] [Google Scholar]
- 37.Jongsma HE, Gayer-Anderson C, Lasalvia A, et al. : Treated incidence of psychotic disorders in the Multinational EU-GEI Study. JAMA Psychiatry 2018; 75:36–46 [DOI] [PMC free article] [PubMed] [Google Scholar]
- 38.Martin AR, Kanai M, Kamatani Y, et al. : Clinical use of current polygenic risk scores may exacerbate health disparities. Nat Genet 2019; 51:584–591 [DOI] [PMC free article] [PubMed] [Google Scholar]
- 39.Martin AR, Gignoux CR, Walters RK, et al. : Human demographic history impacts genetic risk prediction across diverse populations. Am J Hum Genet 2017; 100:635–649 [DOI] [PMC free article] [PubMed] [Google Scholar]
- 40.Moons KG, Altman DG, Reitsma JB, et al. : New guideline for the reporting of studies developing, validating, or updating a multi- variable clinical prediction model: the TRIPOD statement. Adv Anat Pathol 2015; 22:303–305 [DOI] [PubMed] [Google Scholar]
- 41.Dohrenwend BS, Krasnoff L, Askenasy AR, et al. : Exemplification of a method for scaling life events: the Peri Life Events Scale. J Health Soc Behav 1978; 19:205–229 [PubMed] [Google Scholar]
- 42.Janssen I, Krabbendam L, Bak M, et al. : Childhood abuse as a risk factor for psychotic experiences. Acta Psychiatr Scand 2004; 109:38–45 [DOI] [PubMed] [Google Scholar]
- 43.Brandt J, Benedict RHB: Hopkins Verbal Learning Test–Revised (HVLT-R). Odessa, Fla., Psychological Assessment Resources, 1998 [Google Scholar]
- 44.Cornblatt BA, Auther AM, Niendam T, et al. : Preliminary findings for two new measures of social and role functioning in the prodromal phase of schizophrenia. Schizophr Bull 2007; 33:688–702 [DOI] [PMC free article] [PubMed] [Google Scholar]
- 45.Maxwell ME: Manual for the Family Interview for Genetic Studies. Bethesda, Md, National Institute of Mental Health, Intramural Research Program, Clinical Neurogenetics Branch, 1992 [Google Scholar]
- 46.Georgopoulos G, Stowkowy J, Liu L, et al. : The role of a family history of psychosis for youth at clinical high risk of psychosis. Early Interv Psychiatry 2019; 13:251–256 [DOI] [PubMed] [Google Scholar]
- 47.Nieboer D, Vergouwe Y, Ankerst DP, et al. : Improving prediction models with new markers: a comparison of updating strategies. BMC Med Res Methodol 2016; 16:128. [DOI] [PMC free article] [PubMed] [Google Scholar]
- 48.Disorder Bipolar and Schizophrenia Working Group of the Psychiatric Genomics Consortium: Genomic dissection of bipolar dis- order and schizophrenia, including 28 subphenotypes. Cell 2018; 173: 1705–1715.e16 [DOI] [PMC free article] [PubMed] [Google Scholar]
- 49.Duncan LE, Shen H, Gelaye B, Ressler KJ, Feldman MW, Peterson RE, Domingue BW: Analysis of polygenic score usage and performance across diverse human populations. Nat Commun 2019; vol 10, article 3328. [DOI] [PMC free article] [PubMed] [Google Scholar]
- 50.Wang SH, Hsiao PC, Yeh LL, et al. : Polygenic risk for schizophrenia and neurocognitive performance in patients with schizophrenia. Genes Brain Behav 2018; 17:49–55 [DOI] [PubMed] [Google Scholar]
- 51.Agerbo E, Sullivan PF, Vilhjálmsson BJ, et al. : Polygenic risk score, parental socioeconomic status, family history of psychiatric disorders, and the risk for schizophrenia: a Danish population-based study and meta-analysis. JAMA Psychiatry 2015; 72:635–641 [DOI] [PubMed] [Google Scholar]
- 52.Shafee R, Nanda P, Padmanabhan JL, et al. : Polygenic risk for schizophrenia and measured domains of cognition in individuals with psychosis and controls. Transl Psychiatry 2018; 8:78. [DOI] [PMC free article] [PubMed] [Google Scholar]
- 53.Ronald A, Pain O: A systematic review of genome-wide research on psychotic experiences and negative symptom traits: new revelations and implications for psychiatry. Hum Mol Genet 2018; 27(R2):R136–R152 [DOI] [PMC free article] [PubMed] [Google Scholar]
- 54.Pain O, Dudbridge F, Cardno AG, et al. : Genome-wide analysis of adolescent psychotic-like experiences shows genetic overlap with psychiatric disorders. Am J Med Genet B Neuropsychiatr Genet 2018; 177:416–425 [DOI] [PMC free article] [PubMed] [Google Scholar]
- 55.Sullivan PF, Agrawal A, Bulik CM, et al. : Psychiatric genomics: an update and an agenda. Am J Psychiatry 2018; 175:15–27 [DOI] [PMC free article] [PubMed] [Google Scholar]
- 56.Otani T, Noma H, Nishino J, et al. : Re-assessment of multiple testing strategies for more efficient genome-wide association studies. Eur J Hum Genet 2018; 26:1038–1048 [DOI] [PMC free article] [PubMed] [Google Scholar]
- 57.Woo HJ, Yu C, Kumar K, et al. : Large-scale interaction effects reveal missing heritability in schizophrenia, bipolar disorder, and post-traumatic stress disorder. Transl Psychiatry 2017; 7:e1089. [DOI] [PMC free article] [PubMed] [Google Scholar]
- 58.Vorstman JAS, Olde Loohuis LM, Kahn RS, et al. : Double hits in schizophrenia. Hum Mol Genet (Epub ahead of print, May 14, 2018) [DOI] [PMC free article] [PubMed] [Google Scholar]
Associated Data
This section collects any data citations, data availability statements, or supplementary materials included in this article.