

Abstract
PURPOSE:
To examine factors associated with completing enrollment milestones in the Together 5,000 cohort of at-risk men (n = 8661), transmen (n = 53), and transwomen (n = 63) who have sex with men.
METHODS:
Between 2017–2018, participants completed an online enrollment survey and were offered opportunities to complete an incentivized secondary online survey as well as self-administered at-home HIV testing (OraSure HIV-1 Oral specimen collection device). We explored factors associated with completing each study component.
RESULTS:
In total, 8,777 individuals completed our enrollment survey, 6,166 (70.3%) completed the secondary survey, and 5,010 returned the at-home HIV test kit that was mailed to them (81.3% of those mailed a kit). Consistent with other researchers, in our multivariable models, those who were White, with more years of education, were more likely to complete study components, although the magnitude of these associations was small. For example, 50.9% of those enrolled, 47.9% of those completing the secondary survey, and 46.8% of those completing HIV testing were persons of color—a statistically significant, but meaningfully insignificant decline.
CONCLUSIONS:
These findings highlight the ongoing need for researchers to identify barriers that may prevent persons of color and younger individuals from participating in research studies.
Keywords: Recruitment, HIV testing, Men who have sex with men, gay and bisexual men, attrition
INTRODUCTION
HIV disproportionally affects sexual and gender minorities, including gay and bisexual men (GBM). The CDC estimated that 67% of new HIV diagnoses were among GBM in 20161—GBM represented 83% of all diagnoses among men2 and 92% of diagnoses among men aged 18–24.3 At this rate, the CDC estimated that one-in-six men who have sex with men (MSM) will acquire HIV in their lifetime, including one-in-two Black MSM and one-in-four Latino MSM.2,4 Given the high incidence and burden of disease among MSM, it is vital to understand challenges of preventive services uptake and coverage as well as participation in HIV prevention research to help identify these challenges and their potential solutions.
Internet-based recruitment methods can be efficient for reaching large numbers of geographically diverse individuals in a relatively short period.5–9 In addition to identifying potential participants for face-to-face assessments, researchers have used the internet to conduct online assessments9–12 as well as to deliver fully online interventions.13–18 The feasibility of retaining online samples longitudinally has also been well established.19–21
In 2008, Apple Inc. launched the first “app” store, allowing smartphone users to install third-party applications that could take full advantage of the phone’s features, namely its mobility.22 In the years that followed, app developers released geosocial sexual networking apps that can be installed across mobile operating system (e.g., iOS, Android). These types of apps have rapidly been adopted as a means for GBM to meet sex partners, and offer important opportunities as recruitment venues for sexual health research studies.9,23–29
Despite the internet’s and, more recently, apps’ suitability for researchers to engage large numbers of geographically diverse GBM,12,30–33 public health researchers and practitioners remain concerned about adequate representation of those most vulnerable to HIV, including younger GBM and persons of color.9,34 Historically, persons of color have been harder to recruit, engage, and retain in research studies,35–37 and online-recruited studies have observed greater attrition among men of color during consecutive follow-up assessments.36,38,39 A 2016 study of over one thousand GBM reported that participants’ ability to complete various study milestones—consent, complete a baseline assessment, return an at-home HIV test via mail—was associated with higher level of education, living in the southern US, and reporting higher HIV-related risk behaviors.9 In another study of GBM recruited online that required participants to return an at-home HIV test, findings indicated that compliance was associated with White race, higher education, and higher annual income.34 There are substantial historical precedents for racial and ethnic minorities to be suspicious of, if not outright avoidant of, scientific research—not the least of which includes the racist injustices committed by the Tuskegee syphilis experiments.40–44
Taken together, in the present manuscript, we sought to describe factors associated with completing, or not completing, each study milestone in a large, ongoing internet-based U.S. national cohort study of men, transmen, and transwomen who have sex with men. We explored both behavioral as well as demographic factors. Given the high incidence of HIV among MSM of color and known challenges in engaging them in research, our goal was to enroll approximately 50% persons of color; however, ideally without having to establish quota sampling. By examining factors associated with study procedure attrition, our goal was to inform other HIV prevention researchers seeking to engage those most vulnerable to HIV including the use of novel at-home self-administered HIV testing.
METHOD
Cohort recruitment, enrollment, and surveys
This study uses data collected as part of the Together 5000 study, a U.S. national, internet-based cohort study of men, transmen, and transwomen who have sex with men. The overall goal of the study is to identify modifiable individual and structural factors associated with HIV seroconversion and PrEP uptake. Enrollment began October 2017 using ads on men-for-men geosocial networking phone applications, and concluded in June 2018. Eligibility criteria specified that participants were men, transmen, transwomen; aged 16 to 49; had at least 2 male sex partners in the past 3 months; were not currently participating in a HIV vaccine or PrEP clinical trial; were not on PrEP at the time of enrollment; lived in the US or its territories; self-reported HIV status as HIV-negative or unknown; and met at least one of the following additional criteria: diagnosed with syphilis in the past 12 months, diagnosed with rectal gonorrhea/chlamydia in the past 12 months, shared injection drug use needles in the past 12 months, self-reported more than one receptive condomless anal sex (CAS) act with a man in the past 3 months, self-reported greater than two insertive CAS acts with a man in the past 3 months, took post-exposure prophylaxis (PEP) in the past 12 months, and/or self-reported methamphetamine use in the past 3 months. Of note, our recruitment strategies were targeted to reach men who have sex with men, but our enrollment criteria did not exclude transmen and transwomen who otherwise met study criteria. Further, our goal was to enroll approximately 50% persons of color, though we did not employ quota sampling.
Participants clicking on one of our study ads (Figure 1) were routed from the geosocial apps to a secured informed consent and enrollment survey webpage that presented questions about demographic characteristics, sexual behavior, and substance use. Eligible participants who consented and completed the enrollment survey were later sent a link (email and text) to complete a secondary survey that collected additional data. Participants completing this secondary survey received a $15 gift card by email. Participants who completed the second were subsequently mailed an OraSure HIV-1 oral specimen collection device. Using a self-addressed and stamped envelope, participants mailed oral fluid samples to the study lab for analysis. Participants who returned a sample to the lab received another $15 gift card by e-mail.
Figure 1.
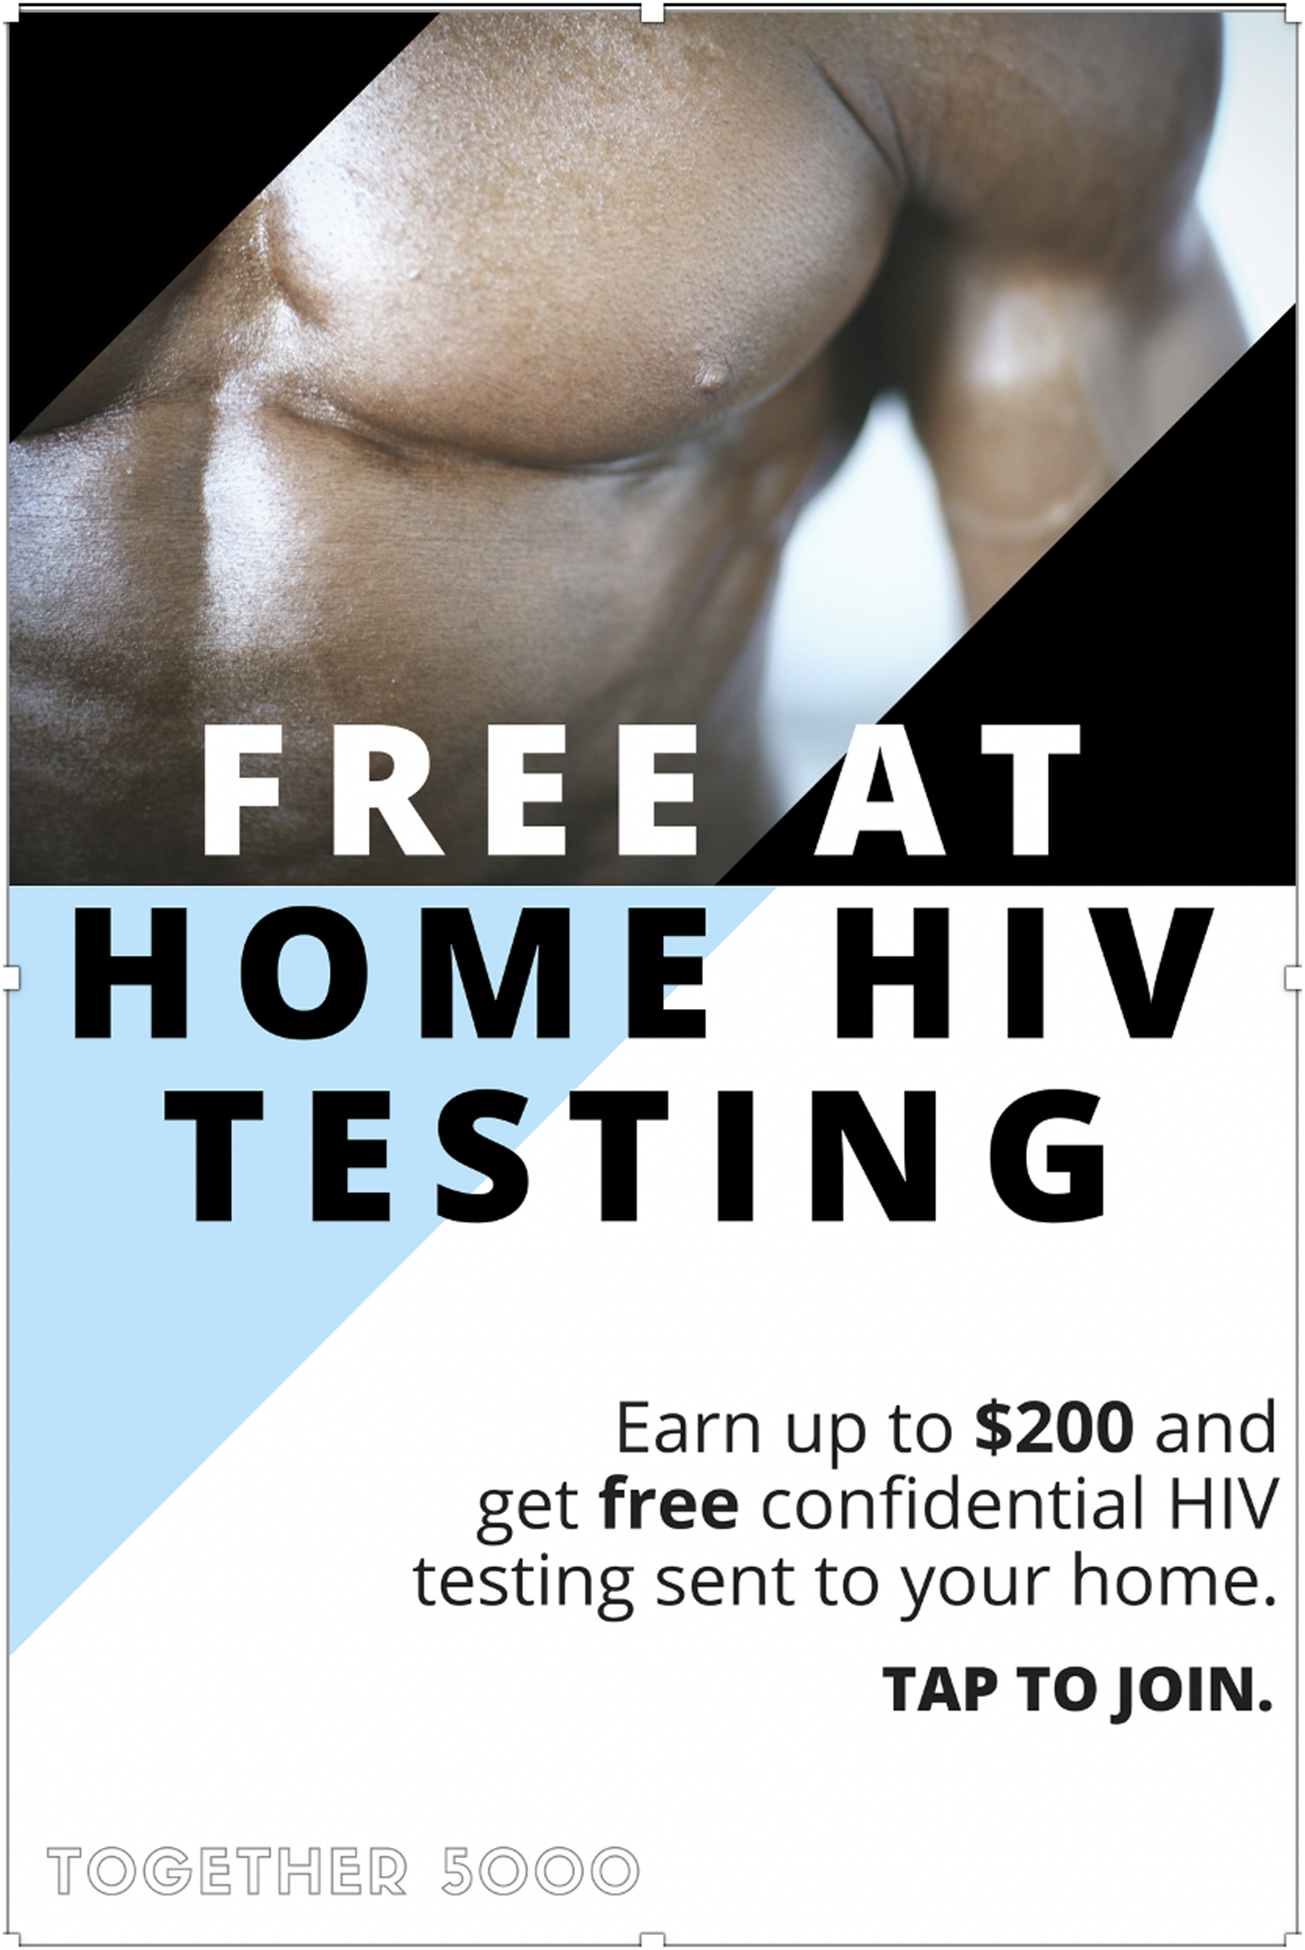
Sample recruitment ad
Survey and test kit response rates
In total, 43,161 individuals began the enrollment survey, and 22,091 (51.2%) completed it. Among those not completing, the vast majority left immediately (i.e., on the informed consent page). Of those who completed the enrollment survey, 8,777 unique participants met eligibility criteria and provided contact information for longitudinal follow-up. Of the 8,777 participants who enrolled, 6,166 (70.3%) completed the secondary survey and were mailed at-home HIV kits, and 5,010 (81.3%) of those who received kits returned them to the laboratory with samples that yielded valid HIV test results. An additional 56 participants returned kits to the lab, but the lab was unable to process them (e.g., container opened in transit to the lab) and our attempts to resample were unsuccessful.
Study measures:
Variables of interest for the current study included demographic characteristics and sexual heath factors related to HIV risk, status, and testing. Demographic characteristics measured in the enrollment survey included age, race/ethnicity, gender identity (i.e., male, transfemale, transmale), sexual identity (e.g., gay, bisexual), employment status, highest level of education, annual income, experiencing housing instability in the past 5 years, and having performed sex work in the past 3 months. Sexual health variables (also assessed in the enrollment survey) included perceived HIV status at enrollment (negative vs. unknown), HIV testing history, experience with PrEP and PEP, as well as the number of times participants had insertive and/or receptive CAS in the past 3 months. Additional demographic characteristics used for analyses—measured in the secondary survey (thus we lack full data on all participants)—were health insurance status, marital status (including commitment ceremonies), and lifetime incarceration (yes/no).
Analysis Plan
Our objective was to assess for sociodemographic and behavioral differences based on whether participants reached each stage of study procedure completion. The first group of participants were those who completed the enrollment survey and consented to study follow-up (i.e., Enrolled, n = 8777). The next group included those who additionally completed the second survey and were subsequently mailed an at-home HIV testing kit (i.e., Milestone 1, n = 6,166). The third group of participants were those who returned their HIV test kit to the lab with valid testing results (i.e., Milestone 2, n = 5,010).
Descriptive statistics were used to describe participants enrolled in the study (n = 8,777), as well as those who reached the additional study milestones. Bivariate tests (chi-square and t-tests, as appropriate) were used to assess for groups differences (e.g., Enrolled vs. Milestone 1; Milestone 1 vs. Milestone 2) in demographic characteristics and sexual health factors. Bivariate Poisson regression analyses were used to assess group differences for number of receptive CAS acts and number of insertive CAS acts (Chi-Squared values and p-values reported). Given our large sample size, and to avoid Type 1 errors, we used a statistical significance level of ≤ 0.01.
Next, we developed two multiple logistic regression models from results of the bivariate analyses and a priori knowledge of known factors associated with HIV risk. To compare participants who enrolled (but did not pass Milestone 1, n = 2,611) versus those who did (n = 6,166), regression analyses included age, gender, race/ethnicity, sexual orientation, employment status, highest level of education, annual income, having experienced housing instability in the past 5 years, transactional sex in the past 3 months, number of times having receptive and insertive CAS, perceived HIV status at enrollment (negative vs. unknown), and HIV testing history. To compare participants who passed Milestone 1 (but not Milestone 2, n = 1,156) versus those who did (n = 5,010), regression analyses included all of the variables mentioned previously plus, marital status, health insurance status, and if participants were ever incarcerated. For all regression analyses, β-estimates, adjusted odds ratios (aOR), and 95% confidence intervals (95% CI) are reported. All analyses were completed using SAS 9.4.
RESULTS
Description of participants who were eligible, consented, and enrolled (n = 8,777):
Descriptive statistics for demographic characteristics for all study milestones are presented in Table 1. Among participants enrolled in the study (n = 8,777), the mean age was 30.4 (SD = 8) and 97.5% identified as cis-men. Half (50.9%) of participants identified as persons of color or multiracial/other. Nearly two-thirds (61.5%) reported being fully employed, 45% reported having some college education or an associate’s degree, and 40.6% reported an annual income between $20,000 and $49,999. Most participants were not in a same-sex marriage (87.5%), and most (83.3%) identified as gay, queer, or homosexual. A quarter (27.5%) reported that they did not have/were unsure if they had health insurance, and 21.8% had experienced housing instability in the past 5 years. Finally, 15.3% reported engaging in transactional sex in the past 3 months, and 14.8% reported ever being incarcerated.
Table 1.
Demographic characteristics by study enrollment/survey milestone, Together5000 (T5K) study, 2017–2018, n = 8,777.
| Enrolled Completed enrollment survey. Consent for follow up |
Milestone 1 Completed second survey and mailed an HIV testing kit |
Milestone 2 Returned a HIV testing kit to lab, valid results |
|||||||
|---|---|---|---|---|---|---|---|---|---|
| Demographic Characteristics |
n = 8,777 n (%) |
Yes n = 6,166 n (%) |
No n = 2,611 n (%) |
Chi-Sq | p -value | Yes n = 5,010 n (%) |
No n = 1,156 n (%) |
Chi-Sq | p - value |
| Gender | 4.37 | 0.22 | 19.76 | 0.0002 | |||||
| Cis-man | 8554 (97.5) | 6016 (97.6) | 2538 (97.2) | 4899 (97.8) | 1117 (96.6) | ||||
| Trans-woman | 63 (0.7) | 41 (0.7) | 22 (0.8) | 22 (0.4) | 19 (1.6) | ||||
| Trans-man | 53 (0.6) | 41 (0.7) | 12 (0.5) | 37 (0.7) | 4 (0.3) | ||||
| Non-binary (male at birth) | 107 (1.2) | 68 (1.1) | 39 (1.5) | 52 (1.0) | 16 (1.4) | ||||
| Race/Ethnicity | 115.36 | <.0001 | 31.11 | <.0001 | |||||
| White | 4309 (49.1) | 3210 (52.1) | 1099 (42.1) | 2665 (53.2) | 545 (47.2) | ||||
| Black or African American | 1156 (13.2) | 679 (11.0) | 477 (18.3) | 507 (10.1) | 172 (14.9) | ||||
| Latinx | 2227 (25.4) | 1505 (24.4) | 722 (27.7) | 1203 (24.0) | 302 (26.1) | ||||
| Asian or Pacific Islander | 311 (3.5) | 224 (3.6) | 87 (3.3) | 194 (3.9) | 30 (2.6) | ||||
| Multiracial/Other | 774 (8.8) | 548 (8.9) | 226 (8.7) | 441 (8.8) | 107 (9.3) | ||||
| Employment Status (current) | 8.63 | 0.03 | 17.75 | 0.0005 | |||||
| Full-time | 5395 (61.5) | 3839 (62.3) | 1556 (59.6) | 3181 (63.5) | 658 (56.9) | ||||
| Part-time | 1160 (13.2) | 804 (13.0) | 356 (13.6) | 628 (12.5) | 176 (15.2) | ||||
| Working or full-time student | 1330 (15.2) | 930 (15.1) | 400 (15.3) | 739 (14.8) | 191 (16.3) | ||||
| Unemployed/Other | 892 (10.2) | 593 (9.6) | 299 (11.5) | 462 (9.2) | 131 (11.3) | ||||
| Highest level of Education | |||||||||
| < High school diploma | 269 (3.1) | 144 (2.3) | 125 (4.8) | 97.46 | <.0001 | 106 (2.1) | 38 (3.3) | 78.36 | <.0001 |
| High school diploma or GED | 1391 (15.9) | 880 (14.3) | 511 (19.6) | 660 (13.2) | 220 (19.0) | ||||
| Some college or associates degree | 3949 (45.0) | 2771 (44.9) | 1178 (45.1) | 2195 (43.8) | 576 (49.8) | ||||
| College graduate or higher | 3168 (36.1) | 2371 (38.5) | 797 (30.5) | 2049 (40.9) | 322 (27.9) | ||||
| Income | 22.66 | <.0001 | 30.56 | <.0001 | |||||
| Less than $20,000 | 3067 (34.9) | 2057 (33.4) | 1010 (38.7) | 1609 (32.1) | 448 (37.8) | ||||
| $20,000-$49,999 | 3559 (40.6) | 2561 (41.5) | 998 (38.2) | 2079 (41.5) | 482 (41.7) | ||||
| $50,000 or more | 2151 (24.5) | 1548 (25.1) | 603 (23.1) | 1322 (26.4) | 226 (19.6) | ||||
| Marital status | 8.97 | 0.003 | |||||||
| Yes (marriage license or commitment ceremony) | 665 (13.3) | 116 (10.0) | |||||||
| No | 4345 (86.7) | 1040 (90.0) | |||||||
| Health insurance | 23.70 | <.0001 | |||||||
| Yes | 3706 (74.0) | 772 (66.8) | |||||||
| No | 1304 (26.0) | 384 (33.2) | |||||||
| Housing instability | 11.60 | 0.001 | 23.62 | <.0001 | |||||
| Yes, within the last 5 years | 1912 (21.8) | 1283 (20.8) | 629 (24.1) | 982 (19.6) | 301 (26.0) | ||||
| No or not within the last 5 years | 6865 (78.2) | 4883 (79.2) | 1982 (75.9) | 4028 (80.4) | 855 (74.0) | ||||
| Sexual identity | 29.96 | <.0001 | 9.60 | 0.01 | |||||
| Gay, Queer, Homosexual | 7314 (83.3) | 5224 (84.7) | 2090 (80.1) | 4276 (85.4) | 948 (82.0) | ||||
| Bisexual | 1346 (15.3) | 860 (14.0) | 486 (18.6) | 675 (13.5) | 185 (16.0) | ||||
| Other (reports sex with men) | 117 (1.3) | 82 (1.3) | 35 (1.3) | 59 (1.2) | 23 (2.0) | ||||
| Transactional sex in the past 3 months | 0.79 | 0.37 | 24.49 | <.0001 | |||||
| Yes | 7438 (84.7) | 927 (15.0) | 412 (15.8) | 699 (14.0) | 228 (19.7) | ||||
| No | 1339 (15.3) | 5239 (85.0) | 2199 (84.2) | 4311 (86.1) | 928 (80.3) | ||||
| Incarcerated (ever) | 13.73 | 0.0002 | |||||||
| Yes | 688 (13.7) | 208 (18.0) | |||||||
| No | 4322 (86.3) | 948 (82.0) | |||||||
| Mean (SD) | Mean (SD) | Mean (SD) | t -value | p -value | Mean (SD) | Mean (SD) | t-value | p - value | |
| Age | 30.41 (7.9) | 30.54 (7.8) | 30.09 (8.0) | −2.49 | 0.01 | 30.89 (7.9) | 29.06 (7.4) | −7.15 | <.0001 |
Regarding sexual and HIV-related health behaviors (Table 2), the average number of receptive CAS acts in the past 3 months was 4 (SD = 11, IQR: 1—4) and the average number of insertive CAS occurrences was also 4 (SD = 8, IQR: 1—5). Four-in-ten participants (42.8%) said they were unsure of their HIV status at the time of enrollment, and one-in-eight (12.8%) had never tested for HIV. In total, 14% of participants reported prior—but not current—PrEP use. Most (94%) of our participants had never take PEP.
Table 2.
Description of sexual risk behaviors for the T5K Study population by study enrollment/survey milestone, Together 5000 Study (T5K), 2017–2018, n = 8,777.
| Enrolled | Milestone 1 Completed second survey and mailed an HIV testing kit |
Milestone 2 Returned a HIV testing kit to lab, valid results |
|||||||
|---|---|---|---|---|---|---|---|---|---|
| Characteristic |
n = 8,777 n (%) |
Yes n = 6,166 n (%) |
No n = 2,611 n (%) |
Chi-Sq | p -value | Yes n = 5,010 n (%) |
No n = 1,156 n (%) |
Chi-Sq | p -value |
| HIV, PrEP, and PEP Status | |||||||||
| HIV Status | 5.81 | 0.02 | 41.65 | <.0001 | |||||
| Negative | 5019 (57.2) | 3577 (58.0) | 1442 (55.2) | 3004 (60.0) | 573 (49.6) | ||||
| Unsure | 3758 (42.8) | 2589 (42.0) | 1169 (44.8) | 2006 (40.0) | 583 (50.4) | ||||
| Last HIV Test | 8.59 | 0.04 | 24.49 | <.0001 | |||||
| 6 months or less | 3748 (42.7) | 2632 (42.7) | 1116 (42.7) | 2209 (44.1) | 423 (36.6) | ||||
| 7–12 months ago | 1614 (18.4) | 1158 (18.8) | 456 (17.5) | 936 (18.7) | 222 (19.2) | ||||
| A year ago or longer | 2292 (26.1) | 1626 (26.4) | 666 (25.5) | 1278 (25.5) | 348 (30.1) | ||||
| I have never been tested | 1123 (12.8) | 750 (12.2) | 373 (14.3) | 587 (11.7) | 163 (14.1) | ||||
| Experience with PrEP | 0.05 | 0.82 | 0.27 | 0.61 | |||||
| I have never taken PrEP/I don’t know what PrEP is | 7525 (85.7) | 5283 (85.7) | 2242 (85.9) | 4287 (85.6) | 996 (86.2) | ||||
| I have taken PrEP, but not currently | 1252 (14.3) | 883 (14.3) | 369 (14.1) | 723 (14.4) | 160 (13.8) | ||||
| Experience with PEP | 0.01 | 0.92 | 0.002 | 0.96 | |||||
| I have never taken PEP | 8226 (93.7) | 5780 (93.7) | 2446 (93.7) | 4696 (93.7) | 1084 (93.8) | ||||
| I have taken PEP a year ago or longer | 551 (6.3) | 386 (6.3) | 165 (6.3) | 314 (6.3) | 72 (6.2) | ||||
| Sexual behaviors | Mean (SD) | Mean (SD) | Mean (SD) | Mean (SD) | Mean (SD) | ||||
| No. of times having receptive CAS* | 4.16 (10.7) | 4.26 (11.6) | 3.94 (8.3) | 41.59 | <.0001 | 4.13 (11.7) | 4.78 (11.2) | 88.66 | <.0001 |
| No. of times having insertive CAS* | 4.23 (7.8) | 4.33 (8.0) | 4.00 (7.3) | 44.13 | <.0001 | 4.26 (7.7) | 4.64 (9.5) | 30.92 | <.0001 |
Bivariate poisson regression analyses used to determined differences between mean counts
Bivariate comparisons of Milestone 1 completers (the secondary survey, n = 6,166) and non-completers (n = 2,611)
When compared to men who did not complete Milestone 1, those who completed the secondary survey were likely to be White (42.1% vs 52.1%), employed full-time (59.6% vs. 62.3%), earn a higher income, have more education, and identify as gay (80.1% vs. 84.7%). Milestone 1 completers reported a greater mean number of recent CAS acts (insertive and receptive) and were less likely to have experienced recent housing instability.
Bivariate comparisons of Milestone 2 completers (HIV testing, n = 5,010) and non-completers (n = 1,156)
Among those mailed an HIV test kit (n = 6,166), we next compared those who returned a valid sample to the lab (n = 5,010) (i.e., completed Milestone 2) versus those who did not return an HIV test kit (n = 1,156). Compared to those who did not return an HIV test kit, those who did were more likely to be older (29.1 vs. 30.9 years) and White (47.2% vs. 53.2%), employed full-time (56.9% vs 63.5%), earn a higher income, have more education, identify as gay (82.0% vs 85.4%), have health insurance (66.8% vs 74.0%), be married (10.0% vs. 13.3%), and cis-male (96.6% vs. 97.8%). Compared to those who returned an HIV test kit, those who did not were significantly more likely to have experienced unstable housing recently, ever been incarcerated, and appeared to have been at greater risk for HIV—they reported a greater number of recent CAS acts, were more likely to say they were unsure of their HIV status at enrollment, and more likely to have never been tested for HIV.
Multivariable Factors associated with completing study Milestones:
In multivariable logistic regression, factors independently associated with Milestone 1 (i.e., completing the secondary survey) vs. not, were being older and having more education. Compared to White men, Black/African American and Latino participants were less likely to complete the secondary survey. Participants identifying as bisexual were also less likely to complete the secondary survey. See Table 3.
Table 3.
Associations of demographic characteristics with passing Milestone 1 and Milestone 2, Together 5000 (T5K) study, 2017–2018, n = 8,777.
| Passed Milestone 1 (yes vs. no) Completed secondary survey and mailed an HIV testing kit |
Passed Milestone 2 (yes vs, no) Returned a HIV testing kit to lab, valid results |
|||||||||||
|---|---|---|---|---|---|---|---|---|---|---|---|---|
|
Estimate (B) |
Wald 95% Confidence Limits |
aOR | 95% Cl | p-value |
Estimate (B) |
Wald 95% Confidence Limits |
aOR | 95% Cl | p-value | |||
| Demographic Characteristics | ||||||||||||
| Age* | −0.02 | −0.05 | 0.02 | 0.98 | 0.95 -- 1.02 | 0.3774 | 0.15 | 0.09 | 0.20 | 1.16 | 1.10 -- 1.22 | <0001 |
| Gender | ||||||||||||
| Cis-man | Ref | Ref | ||||||||||
| Trans-woman | −0.10 | −0.66 | 0.47 | 0.91 | 0.51 -- 1.60 | 0.7320 | −1.11 | −1.79 | −0.43 | 0.33 | 0.17 -- 0.65 | 0.0014 |
| Trans-man | 0.40 | −0.26 | 1.05 | 1.49 | 0.77 -- 2.87 | 0.2333 | 0.90 | −0.15 | 1.95 | 2.46 | 0.86 -- 7.05 | 0.0928 |
| Non-binary (male at birth) | −0.28 | −0.70 | 0.15 | 0.76 | 0.50 -- 1.16 | 0.1993 | −0.12 | −0.71 | 0.47 | 0.89 | 0.49 -- 1.59 | 0.6860 |
| Race/Ethnicity | ||||||||||||
| White | Ref | Ref | ||||||||||
| Black or African American | −0.65 | −0.80 | −0.51 | 0.52 | 0.45 -- 0.60 | <.0001 | −0.34 | −0.55 | −0.13 | 0.71 | 0.58 -- 0.88 | 0.0015 |
| Latino | −0.32 | −0.44 | −0.21 | 0.72 | 0.64 -- 0.81 | <.0001 | −0.10 | −0.27 | 0.07 | 0.90 | 0.77 -- 1.07 | 0.2365 |
| Asian or Pacific Islander | −0.22 | −0.49 | 0.04 | 0.80 | 0.61 -- 1.04 | 0.0983 | 0.09 | −0.32 | 0.50 | 1.10 | 0.73 -- 1.65 | 0.6539 |
| Multiracial/Other | −0.13 | −0.30 | 0.05 | 0.88 | 0.74 -- 1.05 | 0.1559 | −0.02 | −0.27 | 0.22 | 0.98 | 0.77 – 1.24 | 0.8408 |
| Employment Status (current) | ||||||||||||
| Full-time | Ref | Ref | ||||||||||
| Part-time | 0.07 | −0.08 | 0.23 | 1.08 | 0.92 -- 1.26 | 0.3459 | −0.12 | −0.33 | 0.09 | 0.89 | 0.72 -- 1.10 | 0.2697 |
| Working or full-time student | 0.07 | −0.09 | 0.24 | 1.08 | 0.92 -- 1.27 | 0.3646 | 0.06 | −0.16 | 0.28 | 1.06 | 0.85 -- 1.33 | 0.6051 |
| Unemp loy ed/Other | −0.03 | −0.21 | 0.15 | 0.97 | 0.81 -- 1.16 | 0.7442 | −0.14 | −0.39 | 0.10 | 0.87 | 0.68 -- 1.11 | 0.2502 |
| Highest level of Education | ||||||||||||
| < High school diploma | −0.41 | −0.68 | −0.14 | 0.66 | 0.50 -- 0.87 | 0.0029 | −0.01 | −0.42 | 0.41 | 0.99 | 0.65 -- 1.51 | 0.9757 |
| High school diploma or GED | Ref | Ref | ||||||||||
| Some college or associates degree | 0.27 | 0.14 | 0.41 | 1.31 | 1.15 -- 1.51 | <0001 | 0.14 | −0.05 | 0.33 | 1.15 | 0.95 -- 1.39 | 0.1514 |
| College graduate or higher | 0.50 | 0.34 | 0.65 | 1.64 | 1.41 -- 1.91 | <0001 | 0.48 | 0.26 | 0.69 | 1.61 | 1.29 -- 2.00 | <0001 |
| Income | ||||||||||||
| Less than $20,000 | 0.06 | −0.10 | 0.23 | 1.06 | 0.90 -- 1.25 | 0.45 | 0.22 | −0.02 | 0.45 | 1.24 | 0.98 -- 1.57 | 0.0745 |
| $20,000-$49,999 | 0.17 | 0.04 | 0.30 | 1.19 | 1.04 -- 1.36 | 0.01 | 0.10 | −0.09 | 0.29 | 1.11 | 0.91 -- 1.34 | 0.2958 |
| $50,000 or more | Ref | Ref | ||||||||||
| Housing instability | ||||||||||||
| Yes, within the last 5 years | −0.10 | −0.23 | 0.02 | 0.90 | 0.80 -- 1.02 | 0.0964 | −0.10 | −0.27 | 0.07 | 0.90 | 0.76 -- 1.07 | 0.2504 |
| No or not within the last 5 y ears | Ref | Ref | ||||||||||
| Marital status | ||||||||||||
| Yes (marriage license or commitment ceremony) | -- | |||||||||||
| No | -- | −0.15 | −0.37 | 0.07 | 0.86 | 0.69 -- 1.08 | 0.19 | |||||
| Health insurance | ||||||||||||
| Yes | -- | |||||||||||
| No | -- | −0.12 | −0.27 | 0.04 | 0.89 | 0.76 -- 1.04 | 0.15 | |||||
| Sexual orientation | ||||||||||||
| Gay, Queer, Homosexual | Ref | Ref | ||||||||||
| Bisexual | −0.24 | −0.37 | −0.11 | 0.78 | 0.69 -- 0.89 | 0.0003 | −0.15 | −0.33 | 0.04 | 0.86 | 0.72 -- 1.04 | 0.12 |
| Other | 0.18 | −0.25 | 0.61 | 1.20 | 0.78 -- 1.85 | 0.4173 | −0.15 | −0.69 | 0.40 | 0.86 | 0.50 -- 1.49 | 0.6005 |
| Transactional sex in the past 3 months | ||||||||||||
| Yes | 0.08 | −0.06 | 0.22 | 1.09 | 0.95 -- 1.25 | 0.24 | −0.08 | −0.27 | 0.10 | 0.92 | 0.76 -- 1.11 | 0.3788 |
| No | Ref | Ref | ||||||||||
| Incarceration | ||||||||||||
| Yes | -- | −0.18 | −0.38 | 0.01 | 0.83 | 0.69 -- 1.01 | 0.0606 | |||||
| No | -- | Ref | ||||||||||
| No. of times having receptive CAS < 3 months | 0.00 | 0.00 | 0.01 | 1.00 | 1.00 -- 1.01 | 0.5604 | 0.00 | −0.01 | 0.00 | 1.00 | 0.99 -- 1.00 | 0.3872 |
| No. of times having insertive CAS < 3 months | 0.01 | 0.00 | 0.01 | 1.01 | 1.00 -- 1.01 | 0.1182 | 0.00 | −0.01 | 0.00 | 1.00 | 0.99 -- 1.00 | 0.3654 |
| Percieved HIV Status at enrollment | ||||||||||||
| Negative | Ref | Ref | ||||||||||
| Unsure | −0.07 | −0.18 | 0.05 | 0.94 | 0.83 -- 1.05 | 0.2568 | −0.25 | −0.41 | −0.09 | 0.78 | 0.66 -- 0.92 | 0.0025 |
| Last HIV Test | ||||||||||||
| 6 months or less | Ref | Ref | ||||||||||
| 7–12 months ago | 0.11 | −0.03 | 0.24 | 1.11 | 0.97 -- 1.28 | 0.1225 | −0.14 | −0.33 | 0.06 | 0.87 | 0.72 -- 1.06 | 0.1645 |
| A year ago or longer | 0.10 | −0.03 | 0.23 | 1.11 | 0.97 -- 1.26 | 0.1378 | −0.26 | −0.45 | −0.08 | 0.77 | 0.64 -- 0.92 | 0.0053 |
| I have never been tested | 0.03 | −0.14 | 0.21 | 1.04 | 0.87 -- 1.23 | 0.6920 | 0.06 | −0.18 | 0.30 | 1.06 | 0.83 -- 1.35 | 0.6366 |
Age scaled to 5 year increase
Regression analyses for factors associated with completing Milestone 2 (i.e., returning a valid HIV test sample versus not) indicated similar associations found in Milestone 1 analyses for age and level of education. Compared to White men, Black/African American participants were less likely to return an HIV test kit. Compared to cis-men, transwomen were significantly less likely to return an HIV test kit. Those failing to return a kit were also more likely to say they did not know their HIV status and to have last tested for HIV more than a year ago. In both models, although we identified statistical significance in these associations, the magnitude of these associations were small. These are discussed further in the next section.
DISCUSSION
We explored factors associated with completing stages of study enrollment procedures in a large, diverse US national cohort of individuals at risk for HIV. In our multivariable models, White, better-educated participants were more likely to complete study components—as has been observed by others.9,15,36,38,39,45 These findings highlight the ongoing need for researchers to identify barriers that prevent persons of color, particularly Black men, from both enrolling and being retained in research as well as utilize tailored methods for enhancing retention.19–21
That being said, and in spite of greater attrition we observed among persons of color, we highlight that our goal during recruitment was to enroll a sample that was approximately 50% persons of color, and to do so without setting quotas. Of note, our ads featured images that included men of color and we closely approximated this goal—50.9% were persons of color at enrollment, 47.9% of participants completing our secondary survey were persons of color, and 46.8% of those who returned an HIV test kit were persons of color (Figure 2). Furthermore, in multivariable models and compared to White participants, Latinos, Asians, and multiracial/“other” participants were not less likely to return an HIV test kit—in this model, only Black participants differed from White participants. Thus, although some racial differences in attrition were observed, these appear to have been lower in our study compared to others. It is possible the differences between our study and others were a factor of differences in enrollment criteria, study procedures, or incentives. Furthermore, our study featured men of color in the ads and that might have improved response rates.
Figure 2.
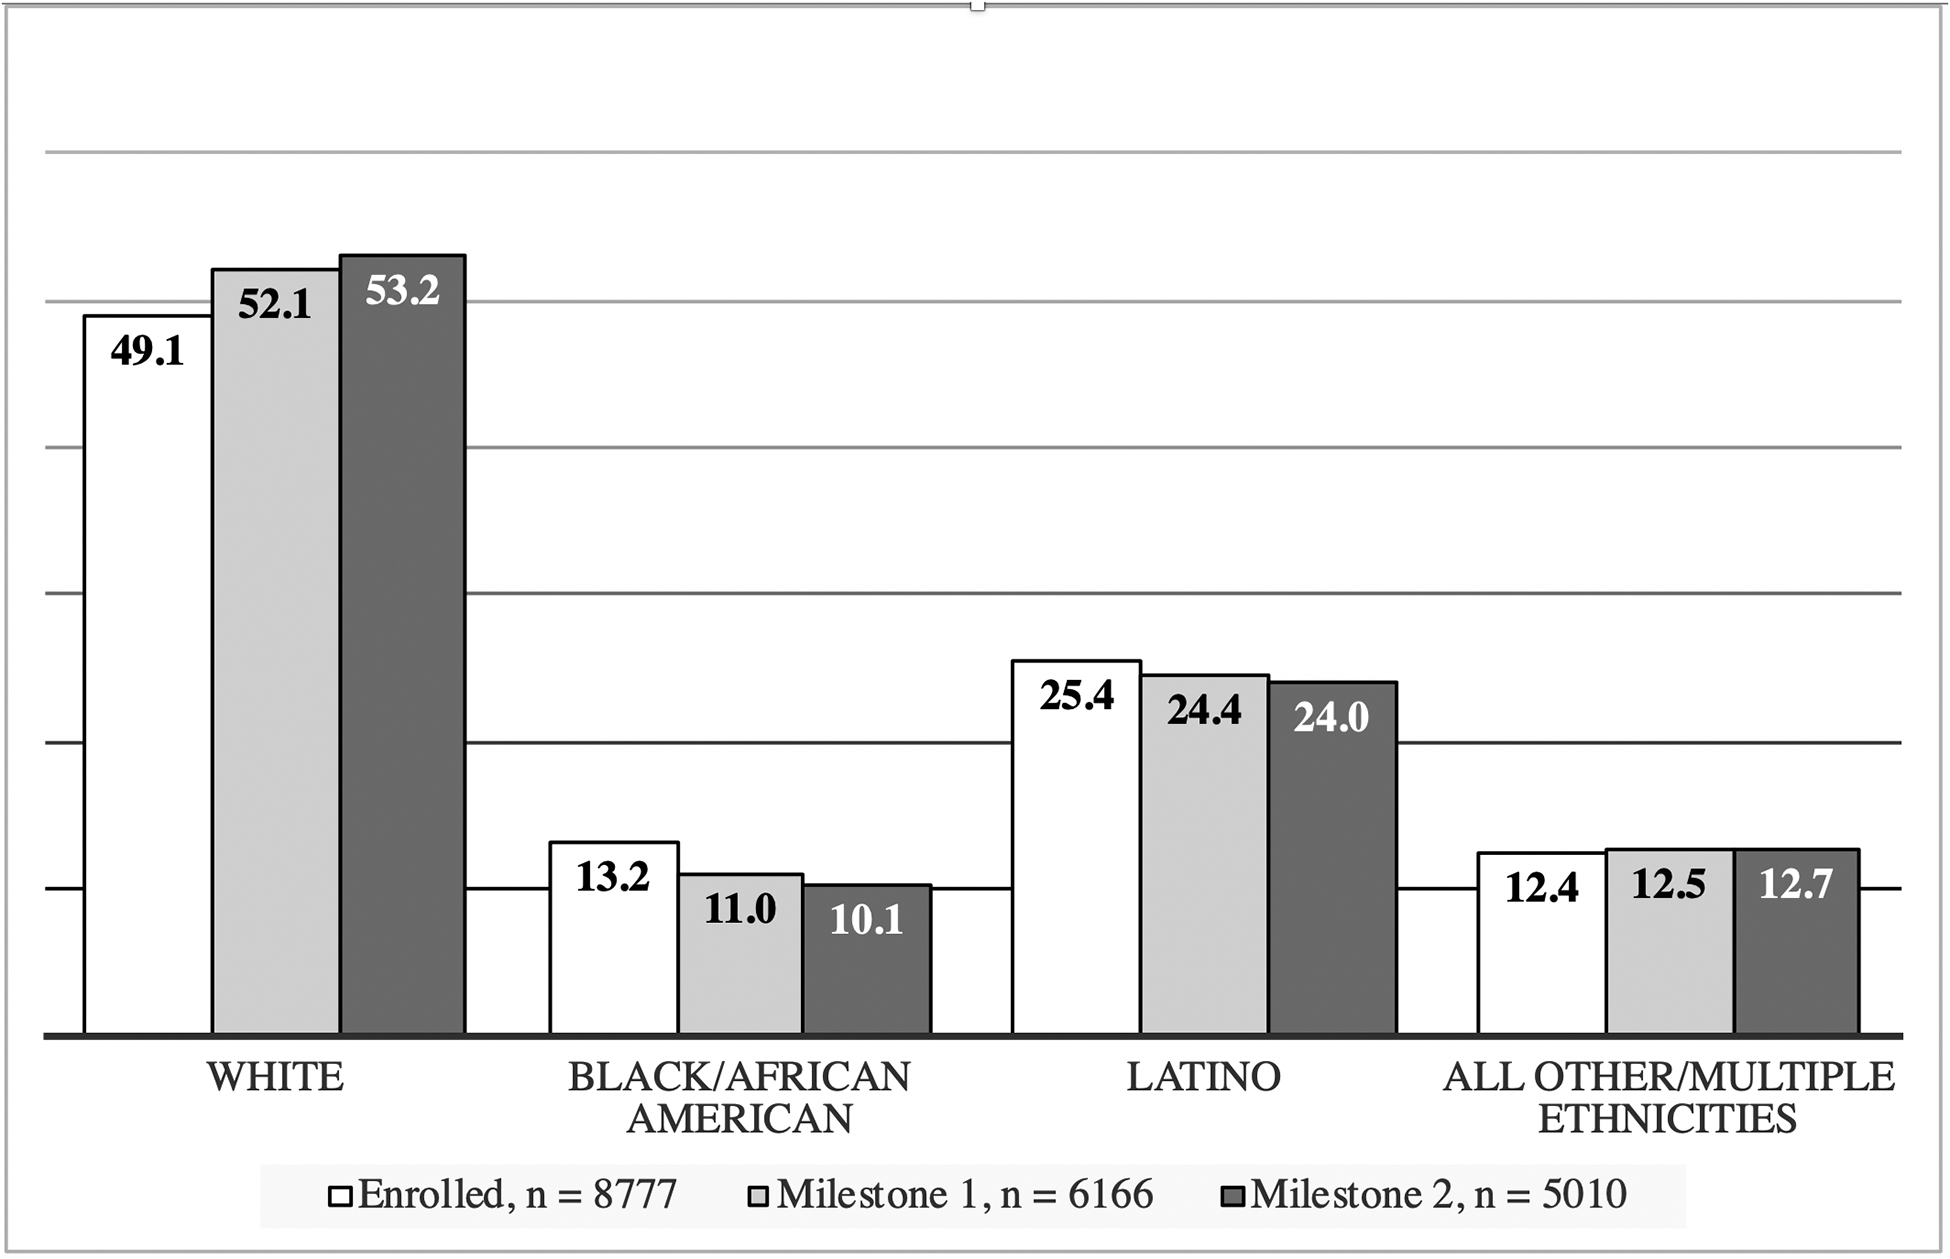
Differences in percentages of racial/ethnic categories by milestone cascade for the Together 5000 (T5K) study
A second notable finding from our multivariable models was that, although perceived HIV status at enrollment (HIV-negative vs. unknown) and prior HIV testing history were not associated with completing our secondary survey (i.e., Milestone 1), both were associated with failing to return an HIV test kit (i.e., Milestone 2). Those who were unsure of their HIV status or who had not tested recently are perhaps the most critical to engage in HIV testing, and at-home self-administered HIV testing could be an effective way to reach such individuals. Indeed, we enrolled 3,415 individuals who had not been tested for HIV in the last year, 1,857 of whom completed HIV testing. Taking an HIV test can be anxiety provoking and additional support in the form of telephone- or text-based HIV pre-test counselling might be appropriate to enhance uptake, particularly among those most at risk.
We also wish to note that the type of test used could also impact whether someone is willing to complete it at home. In our study, we used the OraSure HIV-1 Oral Specimen Collection device, which must be sent to a lab for analysis. In 2012, the FDA approved a rapid at-home HIV test kit that can produce results in 20 minutes, and this might have been more acceptable for some participants.46,47 We opted not to use this test given the added challenges that accurately capturing those results from participants would have posed to study integrity. Another study having used this kit asked participants to report their results via a digital photo of the test paddle,48 but there is some risk in under estimating the number of HIV-positive cases, given that these participants may be reluctant to send a photo of those results. Plus, there is a narrow window of time in which results can be interpreted (between 20–40 minutes after testing).
A third important finding from this study was the number of factors observed to be significant at the bivariate level that were not significant at the multivariate level. These were factors generally considered as variables that put individuals at risk for HIV (e.g., number of CAS acts, transactional sex, incarceration, lack of health insurance, housing instability). Although it is not surprising that some variables, which were significant at the bivariate level, were no longer significant in multivariable analyses, our findings highlight the importance of using multivariable models in order to identify factors that uniquely contribute to study attrition—controlling for potential confounding factors is crucial to obtain an unbiased effect estimate. We also note that there was insufficient evidence to suggest this was due to multicollinearity (data not shown). In the present study, we did not examine HIV risk/infection as an outcome, rather whether these factors would be associated with completing an online survey and completing at-home HIV testing. The fact that they were not significant suggests that, at least in our study, known factors that increase risk for HIV infection were not barriers to engaging individuals in an online survey nor HIV testing.
Our findings should be understood in light of their limitations. Although online studies can increase geographic reach and accessibility, these studies can also increase the potential for fraudulent participants.24,49–52 In our study, the only way participants could have learned about the study was via an ad sent to them on a sexual networking app, and ads were geo-fenced to users within the U.S. and its territories. Using cookies, our enrollment survey blocked multiple submissions. Next, much of our data were self-reported, which is subject to recall bias and social desirability. Third, although consistent with what other researchers have documented, a large number of participants quit the enrollment survey immediately. Because we lack data on these individuals, we are unable to characterize how they may differ from those who completed the enrollment survey. Fourth, biological samples (HIV testing) improves the rigor of our design (over self-report), but we also acknowledge that we have no way to verify the samples obtained actually belonged to the participants. Of note, however, participants’ results had no bearing on whether they would receive the incentive for testing, nor whether they would be eligible to remain in the cohort longitudinally. Fifth, although our sample size is large and geographically diverse, it does not generalize to all individuals at risk for HIV, and because participants were offered an opportunity for a mailed at-home HIV test kit, those who were homeless or experiencing serious housing instability may have opted not to respond to our ads. Sixth, the apps we advertised on were unable to provide us with consistent data on impressions delivered and click-through-rates.
Conclusion
We expected that not all participants enrolled in the study would complete all study components and highlight that our rates of secondary survey return (70.3%) and HIV test kit return (81.3%) was similar to that observed by other researchers.48,53 That being said, rates of attrition in our study varied in ways that have been observed by others, and in ways that are counterintuitive to HIV prevention efforts, i.e., those individuals who are most vulnerable to acquiring the virus were the most likely to be lost to follow-up. Our findings highlight the need for researchers to examine factors associated with attrition as well as institute study procedures that will minimize it. These could include efforts to enhance trust/prepublicity of the researchers themselves, the use of peers to “coach” participants through enrollment steps, or alternate incentive structures that encourage retention (e.g., a “bonus” incentive if a particular research step is completed within a given period of time). Finally, we highlight that online methods of outreach and research are not meant to supplant traditional face-to-face methods, as each has its unique capabilities and sets of limitations.
Acknowledgements:
Special thanks to additional members of the T5K study team: Sarit A. Golub, Gregorio Millett, Don Hoover, Sarah Kulkarni, Alexa D’Angelo, Gloria Perez, Irvin Parker, & Javier Lopez-Rios. Thank you to the program staff at NIH: Gerald Sharp, Sonia Lee, and Michael Stirratt. And thank you to the members of our Scientific Advisory Board: Michael Camacho, Adam Carrico, Demetre Daskalakis, Sabina Hirshfield, Jeremiah Johnson, Claude Mellins, and Milo Santos.
Funding: Together 5,000 was funded by the National Institutes for Health (UG3 AI 133675 - PI Grov). Viraj V. Patel was supported by a career development award (K23MH102118). Other forms of support include the CUNY Institute for Implementation Science in Population Health, and the Einstein, Rockefeller, CUNY Center for AIDS Research (ERC CFAR, P30 AI124414).
REFERENCES
- 1.CDC. HIV Surveillance Report, 2016. http://www.cdc.gov/hiv/library/reports/hiv-surveillance.html2017.
- 2.CDC. HIV Among Gay and Bisexual Men. 2016; http://www.cdc.gov/hiv/group/msm/. Accessed August 22, 2016.
- 3.CDC. Diagnoses of HIV infection among adolescents and young adults in the United States and 6 dependant areas 2010–2014. HIV Surveillance Supplemental Report. 2016;21(3):1–58. [Google Scholar]
- 4.CDC. Half of black gay men and a quarter of Latino gay men projected to be diagnosed within their lifetime. 2016; http://www.cdc.gov/nchhstp/newsroom/2016/croi-press-release-risk.html. Accessed April 26, 2016.
- 5.Vial AC, Starks TJ, Parsons JT. Relative efficiency of field and online strategies in the recruitment of HIV-positive men who have sex with men. AIDS Education and Prevention. 2015;27(2):103–111. [DOI] [PMC free article] [PubMed] [Google Scholar]
- 6.Grov C, Breslow AS, Newcomb ME, Rosenberger JG, Bauermeister JA. Gay and bisexual men’s use of the Internet: Research from the 1990s through 2013. Annu. Rev. Sex Res 2014;51(4):390–409. [DOI] [PMC free article] [PubMed] [Google Scholar]
- 7.Mustanski BS. Getting wired: Exploiting the Internet for the collection of valid sexuality data. Journal of Sex Research. 2001;38(4):292–301. [Google Scholar]
- 8.Chiasson MA, Parsons JT, Tesoriero JM, Carballo-Dieguez A, Hirshfield S, Remien RH. HIV behavioral research online. Journal of Urban Health. 2006;83(1):73–85. [DOI] [PMC free article] [PubMed] [Google Scholar]
- 9.Grov C, Cain D, Whitfield TH, et al. Recruiting a US national sample of HIV-negative gay and bisexual men to complete at-home self-administered HIV/STI testing and surveys: Challenges and opportunities. Sexuality Research and Social Policy. 2016;13(1):1–21. [DOI] [PMC free article] [PubMed] [Google Scholar]
- 10.Bauermeister JA, Carballo-Diéguez A, Ventuneac A, Dolezal C. Assessing motivations to engage in intentional condomless anal intercourse in HIV risk contexts (“bareback sex”) among men who have sex with men. AIDS Education & Prevention. 2009;21(2):156–168. [DOI] [PMC free article] [PubMed] [Google Scholar]
- 11.Hernandez-Romieu AC, et al. The comparability of men who have sex with men recruited from venue-time-space sampling and facebook: a cohort study. JMIR research protocols. 2014;3(3). [DOI] [PMC free article] [PubMed] [Google Scholar]
- 12.Lelutiu-Weinberger C, Pachankis JE, Gamarel KE, Surace A, Golub SA, Parsons JT. Feasibility, acceptability, and preliminary efficacy of a live-chat social media intervention to reduce HIV risk among young men who have sex with men. AIDS and Behavior. 2015;19(7):1214–1227. [DOI] [PMC free article] [PubMed] [Google Scholar]
- 13.Adam BD, Murray J, Ross S, Oliver J, Lincoln SG, Rynard V. Hivstigma. com, an innovative web-supported stigma reduction intervention for gay and bisexual men. Health Education Research. 2011;26(5):795–807. [DOI] [PubMed] [Google Scholar]
- 14.Martinez O, Wu E, Shultz AZ, et al. Still a hard-to-reach population? Using social media to recruit Latino gay couples for an HIV intervention adaptation study. Journal of medical Internet research. 2014;16(4). [DOI] [PMC free article] [PubMed] [Google Scholar]
- 15.Whiteley LB, Brown LK, Swenson RR, et al. African American adolescents meeting sex partners online: closing the digital research divide in STI/HIV prevention. The journal of primary prevention. 2012;33(1):13–18. [DOI] [PMC free article] [PubMed] [Google Scholar]
- 16.Young SD, Cumberland WG, Lee S-J, Jaganath D, Szekeres G, Coates T. Social networking technologies as an emerging tool for HIV prevention: a cluster randomized trial. Annals of internal medicine. 2013;159(5):318–324. [DOI] [PMC free article] [PubMed] [Google Scholar]
- 17.Mustanski B, Garofalo R, Monahan C, Gratzer B, Andrews R. Feasibility, acceptability, and preliminary efficacy of an online HIV prevention program for diverse young men who have sex with men: the keep it up! intervention. AIDS and Behavior. 2013;17(9):2999–3012. [DOI] [PMC free article] [PubMed] [Google Scholar]
- 18.Patel VV, Ginsburg Z, Golub SA, et al. Empowering With PrEP (E-PrEP), a Peer-Led Social Media–Based Intervention to Facilitate HIV Preexposure Prophylaxis Adoption Among Young Black and Latinx Gay and Bisexual Men: Protocol for a Cluster Randomized Controlled Trial. JMIR research protocols. 2018;7(8). [DOI] [PMC free article] [PubMed] [Google Scholar]
- 19.Hightow-Weidman LB, Pike E, Fowler B, et al. HealthMpowerment. org: feasibility and acceptability of delivering an internet intervention to young Black men who have sex with men. AIDS care. 2012;24(7):910–920. [DOI] [PMC free article] [PubMed] [Google Scholar]
- 20.Bowen A, Williams M, Daniel C, Clayton S. Internet based HIV prevention research targeting rural MSM: feasibility, acceptability, and preliminary efficacy. Journal of behavioral medicine. 2008;31(6):463–477. [DOI] [PMC free article] [PubMed] [Google Scholar]
- 21.Mustanski B, Madkins K, Greene GJ, et al. Internet-based HIV prevention with at-home sexually transmitted infection testing for young men having sex with men: study protocol of a randomized controlled trial of keep it up! 2.0. JMIR research protocols. 2017;6(1). [DOI] [PMC free article] [PubMed] [Google Scholar]
- 22.Silver S. The revolution Steve Jobs resisted: Apple’s App Store marks 10 years of third-party innovation. 2018. https://appleinsider.com/articles/18/07/10/the-revolution-steve-jobs-resisted-apples-app-store-marks-10-years-of-third-party-innovation. Accessed December 4, 2018.
- 23.Grov C, Breslow AS, Newcomb ME, Rosenberger JG, Bauermeister JA. Gay and bisexual men’s use of the Internet: research from the 1990s through 2013. The Journal of Sex Research. 2014;51(4):390–409. [DOI] [PMC free article] [PubMed] [Google Scholar]
- 24.Pequegnat W, Rosser BS, Bowen AM, et al. Conducting Internet-based HIV/STD prevention survey research: Considerations in design and evaluation. AIDS Behav. 2007;11(4):505–521. [DOI] [PubMed] [Google Scholar]
- 25.Newcomb ME, Mongrella MC, Weis B, McMillen SJ, Mustanski BS. Partner disclosure of PrEP use and undetectable viral load on geosocial networking apps: frequency of disclosure and decisions about condomless sex. JAIDS Journal of Acquired Immune Deficiency Syndromes. 2016;71:200–206. [DOI] [PMC free article] [PubMed] [Google Scholar]
- 26.Goedel WC, Duncan DT. Geosocial-Networking App Usage Patterns of Gay, Bisexual, and Other Men Who Have Sex With Men: Survey Among Users of Grindr, A Mobile Dating App. JMIR Public Health and Surveillance. 2015;1(1):e4. [DOI] [PMC free article] [PubMed] [Google Scholar]
- 27.Hambrick HR, Park SH, Goedel WC, et al. Rectal Douching Among Men Who Have Sex with Men in Paris: Implications for HIV/STI Risk Behaviors and Rectal Microbicide Development. AIDS Behav. 2018;22(2):379–387. [DOI] [PMC free article] [PubMed] [Google Scholar]
- 28.Phillips G II, Grov C, Mustanski B. Engagement in group sex among geosocial networking (GSN) mobile application-suing men who have sex with men (MSM). Sex. Health in press. [DOI] [PMC free article] [PubMed] [Google Scholar]
- 29.Phillips G II, Magnus M, Kuo I, et al. Use of Geosocial Networking (GSN) Mobile Phone Applications to Find Men for Sex by Men Who Have Sex with Men (MSM) in Washington, DC. AIDS and Behavior. 2014:1–8. [DOI] [PubMed] [Google Scholar]
- 30.Grov C, Rendina HJ, Ventuneac A, Parsons JT. HIV risk in group sexual encounters: An event‐level analysis from a national online survey of MSM in the US. The journal of sexual medicine. 2013;10(9):2285–2294. [DOI] [PMC free article] [PubMed] [Google Scholar]
- 31.Grov C, et al. Characteristics of men who have sex with men (MSM) who attend sex parties: results from a national online sample in the USA. Sex Transm Infect 2014;90(1):26–32. [DOI] [PMC free article] [PubMed] [Google Scholar]
- 32.Rendina HJ, Breslow AS, Grov C, Ventuneac A, Starks TJ, Parsons JT. Interest in couples-based voluntary HIV counseling and testing in a national US sample of gay and bisexual men: The role of demographic and HIV risk factors. Archives of sexual behavior. 2014;43(1):149–159. [DOI] [PMC free article] [PubMed] [Google Scholar]
- 33.Sineath RC, Finneran C, Sullivan P, et al. Knowledge of and interest in using preexposure prophylaxis for HIV prevention among men who have sex with men in Thailand. Journal of the International Association of Providers of AIDS Care (JIAPAC). 2013;12(4):227–231. [DOI] [PubMed] [Google Scholar]
- 34.Ricca AV, Hall EW, Khosropour CM, Sullivan PS. Factors associated with returning at-home specimen collection kits for HIV testing among internet-using men who have sex with men. Journal of the International Association of Providers of AIDS Care (JIAPAC). 2016;15(6):463–469. [DOI] [PubMed] [Google Scholar]
- 35.Khosropour CM, Johnson BA, Ricca AV, Sullivan PS. Enhancing retention of an Internet-based cohort study of men who have sex with men (MSM) via text messaging: randomized controlled trial. Journal of medical Internet research. 2013;15(8). [DOI] [PMC free article] [PubMed] [Google Scholar]
- 36.Khosropour CM, Sullivan PS. Predictors of retention in an online follow-up study of men who have sex with men. Journal of medical Internet research. 2011;13(3). [DOI] [PMC free article] [PubMed] [Google Scholar]
- 37.Sharma A, Sullivan PS, Khosropour CM. Willingness to take a free home HIV test and associated factors among internet-using men who have sex with men. Journal of the International Association of Physicians in AIDS Care. 2011;10(6):357–364. [DOI] [PMC free article] [PubMed] [Google Scholar]
- 38.Jain A, Ross MW. Predictors of Drop-Out in an Internet Study of Men Who Have Sex with Men. CyberPsychology & Behavior. 2008;11(5):583–586. [DOI] [PubMed] [Google Scholar]
- 39.Sullivan PS, Khosropour CM, Luisi N, et al. Bias in online recruitment and retention of racial and ethnic minority men who have sex with men. Journal of Medical Internet Research. 2011;13(2). [DOI] [PMC free article] [PubMed] [Google Scholar]
- 40.Freimuth VS, Quinn SC, Thomas SB, Cole G, Zook E, Duncan T. African Americans’ views on research and the Tuskegee Syphilis Study. Social science & medicine. 2001;52(5):797–808. [DOI] [PubMed] [Google Scholar]
- 41.Green BL, Maisiak R, Wang MQ, Britt MF, Ebeling N. Participation in health education, health promotion, and health research by African Americans: effects of the Tuskegee Syphilis Experiment. Journal of Health Education. 1997;28(4):196–201. [Google Scholar]
- 42.Katz RV, Green BL, Kressin NR, et al. The legacy of the Tuskegee Syphilis Study: assessing its impact on willingness to participate in biomedical studies. Journal of health care for the poor and underserved. 2008;19(4):1168. [DOI] [PMC free article] [PubMed] [Google Scholar]
- 43.Thomas SB, Quinn SC. The Tuskegee Syphilis Study, 1932 to 1972: implications for HIV education and AIDS risk education programs in the black community. American journal of public health. 1991;81(11):1498–1505. [DOI] [PMC free article] [PubMed] [Google Scholar]
- 44.Bogart LM, Galvan FH, Wagner GJ, Klein DJ. Longitudinal association of HIV conspiracy beliefs with sexual risk among black males living with HIV. AIDS Behav. 2011;15(6):1180–1186. [DOI] [PMC free article] [PubMed] [Google Scholar]
- 45.Young SD. Social Media Technologies for HIV Prevention Study Retention Among Minority Men Who Have Sex with Men (MSM). AIDS and Behavior. September 01 2014;18(9):1625–1629. [DOI] [PMC free article] [PubMed] [Google Scholar]
- 46.Carballo-Diéguez A, Frasca T, Balan I, Ibitoye M, Dolezal C. Use of a Rapid HIV Home Test Prevents HIV Exposure in a High Risk Sample of Men Who Have Sex With Men. AIDS and Behavior. October 01 2012;16(7):1753–1760. [DOI] [PMC free article] [PubMed] [Google Scholar]
- 47.Carballo-Diéguez A, Frasca T, Dolezal C, Balan I. Will Gay and Bisexually Active Men at High Risk of Infection Use Over-the-Counter Rapid HIV Tests to Screen Sexual Partners? The Journal of Sex Research. 2012/07/01 2012;49(4):379–387. [DOI] [PMC free article] [PubMed] [Google Scholar]
- 48.Grov C, Cain D, Whitfield THF, et al. Recruiting a U.S. national sample of HIV-negative gay and bisexual men to complete at-home self-administered HIV/STI testing and surveys: Challenges and opportunities. Sexuality Research & Social Policy. 2016;13(1–21). [DOI] [PMC free article] [PubMed] [Google Scholar]
- 49.Teitcher JEF, Bockting WO, Bauermeister JA, Hoefer CJ, Miner MH, Klitzman RL. Detecting, preventing, and responding to “fraudsters” in Internet research: ethics and tradeoffs. The Journal of Law, Medicine & Ethics. 2015;43(1):116–133. [DOI] [PMC free article] [PubMed] [Google Scholar]
- 50.Bauermeister JA, Pingel E, Zimmerman M, Couper M, Carballo-Dieguez A, Strecher VJ. Data quality in HIV/AIDS web-based surveys: Handling invalid and suspicious data. Field Methods. 2012;24(3):272–291. [DOI] [PMC free article] [PubMed] [Google Scholar]
- 51.Grey JA, Konstan J, Iantaffi A, Wilkerson JM, Galos D, Rosser BRS. An updated protocol to detect invalid entries in an online survey of men who have sex with men (MSM): how do valid and invalid submissions compare? AIDS Behav. 2015:1–10. [DOI] [PMC free article] [PubMed] [Google Scholar]
- 52.Konstan JA, Simon BRS, Ross MW, Stanton J, Edwards WM. The story of subject naught: A cautionary but optimistic tale of Internet survey research. Journal of Computer‐Mediated Communication. 2005;10(2):00–00. [Google Scholar]
- 53.Sharma AK, Sullivan PS, Khosropour CM. Willingness to take a free home HIV test and associated factors among internet-using men who have sex with men. Journal of the International Association of Physicians in AIDS Care (JIAPAC). 2011;10(6):357–364. [DOI] [PMC free article] [PubMed] [Google Scholar]