Introduction
Clinical studies routinely collect data on multiple efficacy or safety end points. Conventionally, summaries for the treatment effect are presented for each end point separately. This practice is suboptimal, because statistical significance is evaluated for each end point individually, not for multiple end points simultaneously. For studies of rare diseases, nominal statistical significance is often observed for some end points, but not for others, owing to study size limitations. This makes the interpretation of the overall treatment effect difficult. Recently, Ristl et al1 provided an excellent statistical review on this issue. Here, we apply a heuristic, analytical procedure to examine whether ataluren is beneficial vs placebo for treating patients with Duchenne muscular dystrophy using data from multiple end points of 2 independent trials.2,3
Methods
Data for this analysis were obtained from 2 randomized, double-blind, placebo-controlled trials of ataluren (dosage, 40 mg/kg/d) (ClinicalTrials.gov identifier NCT00592553,2 February 2008 to December 2009; and ClinicalTrials.gov identifier NCT01826487,3 March 2013 to August 2015). The primary end point for both studies was change in 6-minute walk distance from baseline to 48 weeks. Three prespecified secondary end points assessing muscle function were changes in time to walk or run 10 m, time to climb 4 stairs, and time to descend 4 stairs. For NCT00592553, 57 patients each were assigned to ataluren and placebo; for NCT01826487, 114 patients each were assigned to ataluren and placebo.
The deidentified data used for the present analysis did not involve any further patient participation or clinical assessments than were originally agreed to through consent and the institutional review boards of the original trials. Thus, there is no need to have additional institutional review board approval for using the data, in accordance with 45 CFR §46.102(f). This study follows the Strengthening the Reporting of Observational Studies in Epidemiology (STROBE) reporting guideline.
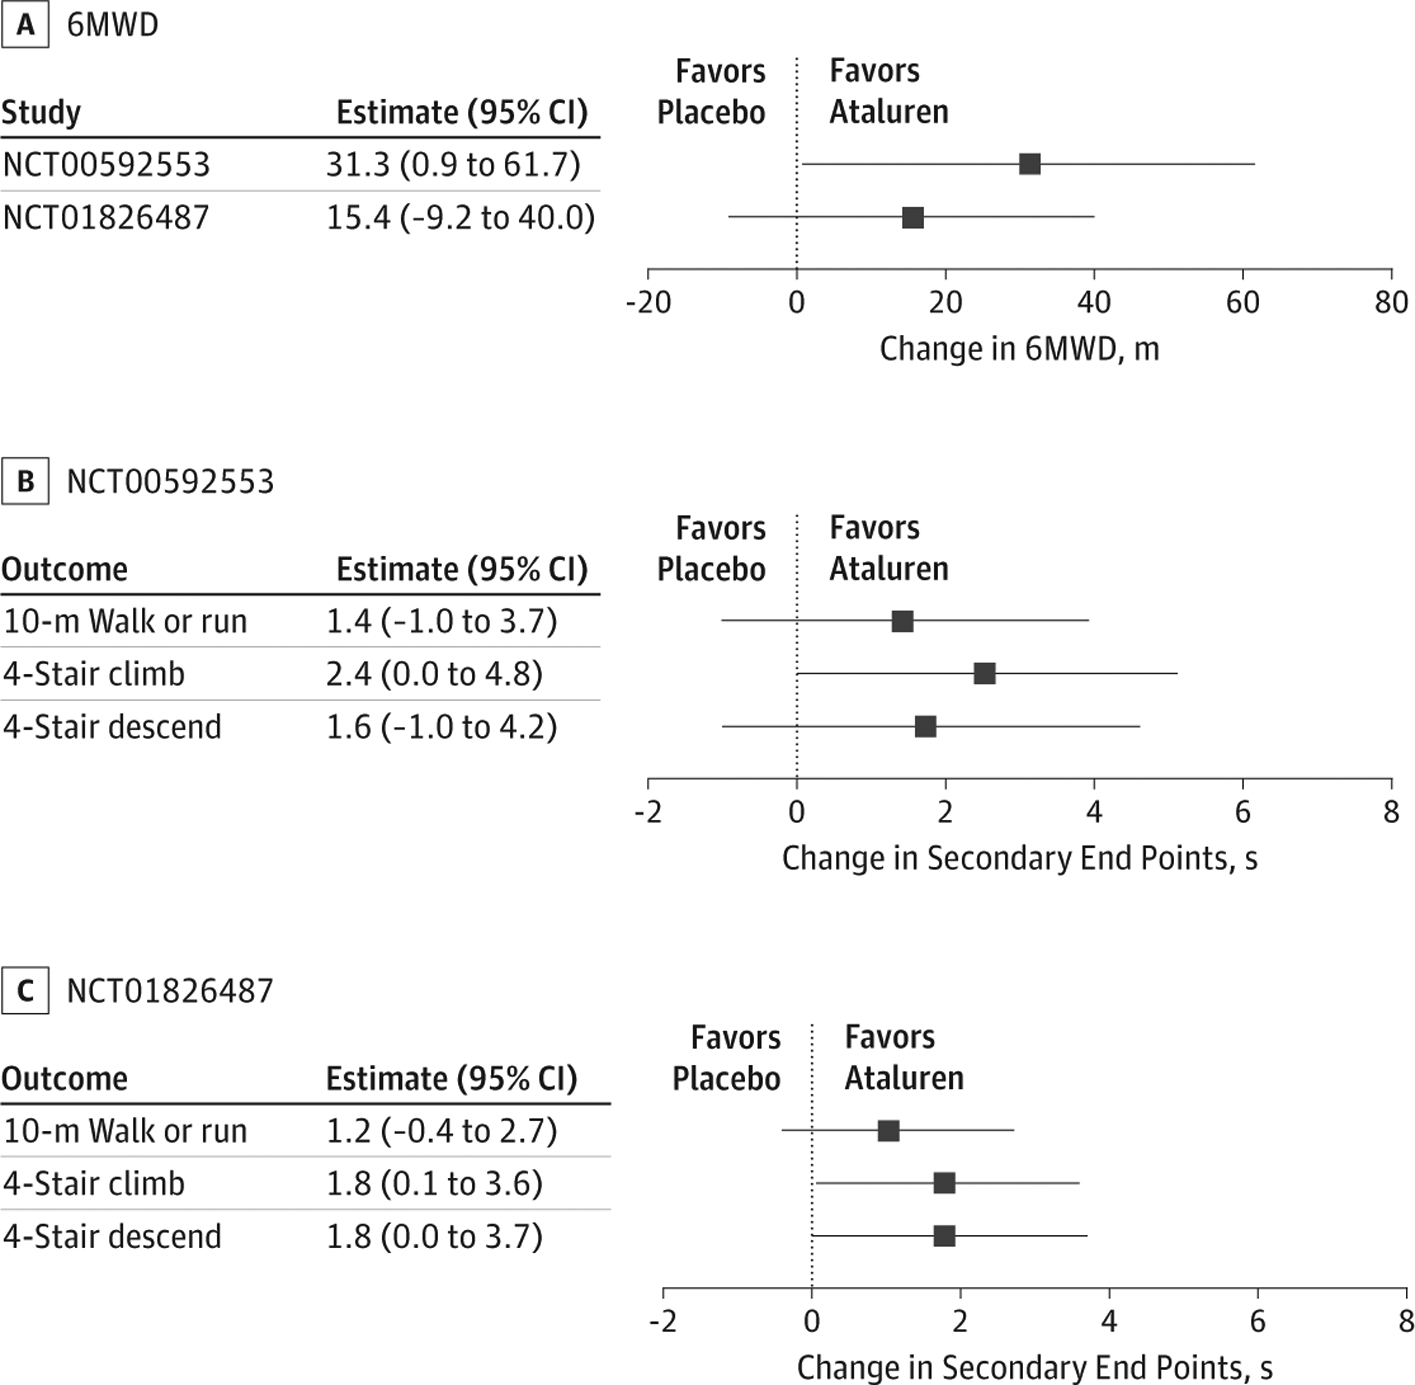
Data analysis was performed June through September 2019, using computer code we wrote using R statistical software version 3.5.3 (R Project for Statistical Computing). First, we performed a conventional end point–specific analysis via 2-sample t statistics with data observed at week 48. Figure 1 displays those results. For example, in NCT00592553, for 6-minute walk distance, the estimated mean difference between treatment with ataluren and placebo was 31.3 m (95% CI, 0.9 to 61.7 m; P = .04), and for 10-m walk or run, the estimated mean difference between placebo and ataluren was 1.4 seconds (95% CI, −1.0 to 3.7 seconds; P = .25). Although differences for some end points were not statistically significant at α = .05, all 8 estimated mean differences were greater than 0, indicating numerical improvement with ataluren for all end points.
Figure 1. Conventional End Point–Specific Analysis.

Results from conventional end point–specific analyses via 2-sided t statistics with data observed at week 48 are shown for 6-minute walk distance (6MWD), which was the primary outcome for both studies (A), and for the secondary outcomes for NCT00592553 (B) and NCT01826487 (C). Squares denote point estimates, and error bars denote 95% confidence intervals.
The question is how to combine information across 8 outcomes. Because the units of the end points are different (ie, the first is in meters and the other 3 are in seconds), we standardized the estimated group difference using z score, which is the estimated difference divided by the SE. The mean observed z score was 1.64 across 8 end points. If there were no differences between the 2 groups, each z score would be near 0 randomly. To assess the aggregated strength of evidence for treatment effect, we calculated the chance that the mean observed z score is greater than or equal to 1.64 under the assumption that there is no treatment effect. To generate the null distribution of the mean observed z score, we shuffled patients randomly between 2 groups for each study.
Results
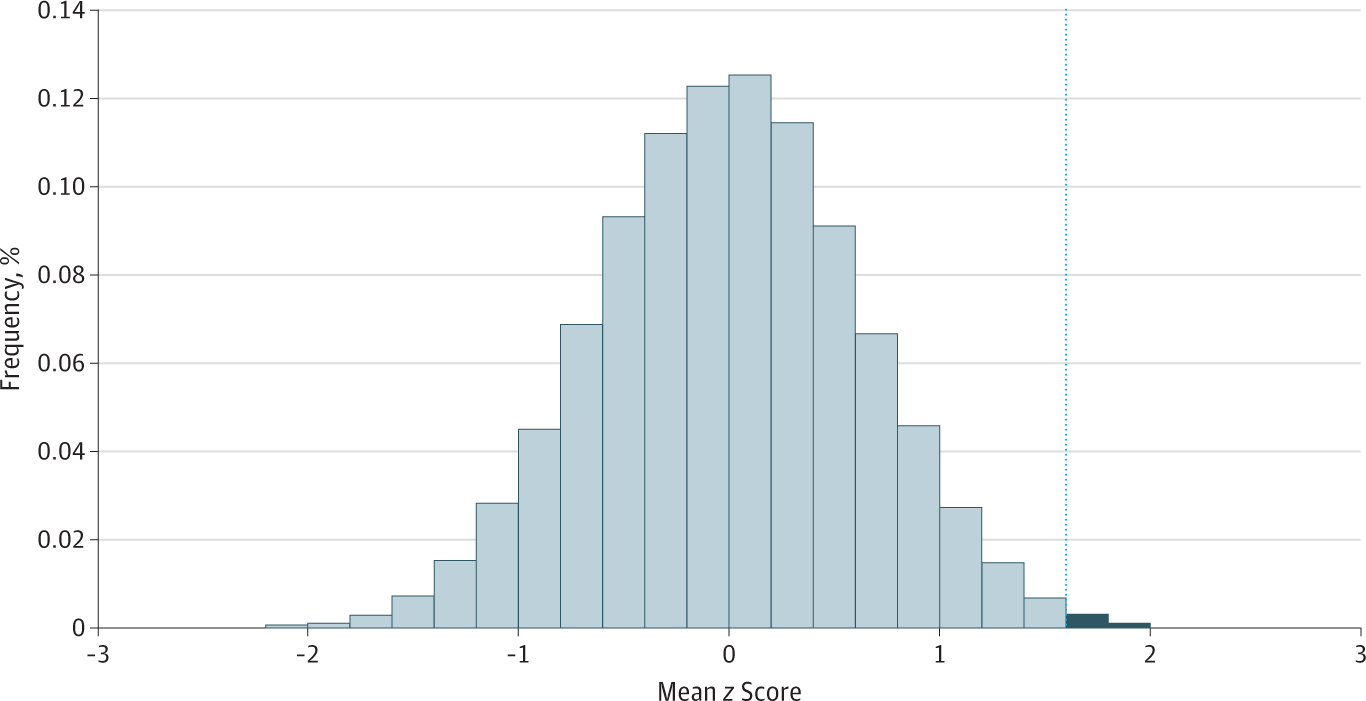
To assess how unlikely it is that one would observe the consistent profile of Figure 1, a permutation test was conducted in which we permuted the patients randomly in each study between 2 groups and calculated the mean observed z score for each iteration. We repeated this process 1 million times and constructed the frequency distribution of these realizations in Figure 2. The darker shaded area greater than the mean observed z score of 1.64 across 8 end points indicates 1-sided P = .004, meaning that ataluren is statistically significantly better than placebo. This is the first hurdle to be cleared for any study before discussing the clinical significance of treatment.
Figure 2. The Distribution of Simulated Mean Observed z Score Assuming No Treatment Effect.

Vertical line marks a mean observed z score of 1.64. The darker-shaded area greater than the mean observed z score of 1.64 indicates 1-sided P = .004, meaning that ataluren is statistically significantly better than placebo.
Discussion
Similar procedures have been discussed extensively in statistical literature1,4–6 but have not been widely used in medical research owing to a lack of awareness of this approach within the clinical community. The multiple end points considered should be prespecified to avoid post hoc selection of favorable end points. The primary limitation of this analysis is that unless the units of the outcomes are the same (eg, all the end points are binary), it is unclear how to combine estimates to quantify the overall treatment effect size.
Funding/Support:
This study was partially supported by grants from the National Institutes of Health and contracts from PTC Therapeutics to Dr Wei.
Role of the Funder/Sponsor: The funders had no role in the design and conduct of the study; collection, management, analysis, and interpretation of the data; preparation, review, or approval of the manuscript; and decision to submit the manuscript for publication.
Footnotes
Conflict of Interest Disclosures:
Dr McDonald reported receiving grants and personal fees from PTC Therapeutics, Sarepta Therapeutics, Santhera Pharmaceuticals, Catabasis Therapeutics, Capricor Therapeutics, Astellas, and Marathon Pharmaceuticals; and grants from Pfizer, Eli Lilly, Roche, and Italfarmaco outside the submitted work. Dr Kim reported receiving grants from the National Institutes of Health outside the submitted work. No other disclosures were reported.
Additional Information: The code for implementing the procedure is available at https://github.com/lidani1234/Totality-of-Evidence.
REFERENCES
- 1.Ristl R, Urach S, Rosenkranz G, Posch M. Methods for the analysis of multiple endpoints in small populations: a review. J Biopharm Stat. 2019;29(1):1–29. doi: 10.1080/10543406.2018.1489402 [DOI] [PubMed] [Google Scholar]
- 2.Bushby K, Finkel R, Wong B, et al. ; PTC124-GD-007-DMD Study Group. Ataluren treatment of patients with nonsense mutation dystrophinopathy. Muscle Nerve. 2014;50(4):477–487. doi: 10.1002/mus.24332 [DOI] [PMC free article] [PubMed] [Google Scholar]
- 3.McDonald CM, Campbell C, Torricelli RE, et al. ; Clinical Evaluator Training Group; ACT DMD Study Group. Ataluren in patients with nonsense mutation Duchenne muscular dystrophy (ACT DMD): a multicentre, randomised, double-blind, placebo-controlled, phase 3 trial. Lancet. 2017;390(10101):1489–1498. doi: 10.1016/S0140-6736(17)31611-2 [DOI] [PubMed] [Google Scholar]
- 4.Wei LJ, Lachin JM. Two-sample asymptotically distribution-free tests for incomplete multivariate observations. J Am Stat Assoc. 1984;79(387):653–661. doi: 10.1080/01621459.1984.10478093 [DOI] [Google Scholar]
- 5.Wei LJ, Johnson WE. Combining dependent tests with incomplete repeated measures. Biometrika. 1985;72(2): 359–364. doi: 10.1093/biomet/72.2.359 [DOI] [Google Scholar]
- 6.Rahlfs V, Vester JC. The new trend in clinical research: the multidimensional approach of testing individual endpoints [in German]. Pharmazeutische Medizin. 2012;3:160–165. [Google Scholar]


