Abstract
Photoacoustic computed tomography (PACT) is an emerging computed imaging modality that exploits optical contrast and ultrasonic detection principles to form images of the photoacoustically induced initial pressure distribution within tiaaue. The PACT reconstruction problem corresponds to a time-domain inverse source problem, where the initial pressure distribution is recovered from the measurements recorded on an aperture outside the support of the source. A major challenge in transcranial PACT of the brain is to compensate for aberrations and attenuation in the measured data due to the propagation of the photoacoustic wavefields through the skull. To properly account for these effects, a wave equation-based inversion method can be employed that can model the heterogeneous elastic properties of the medium. In this study, an optimization-based image reconstruction method for 3D transcranial PACT is developed based on the elastic wave equation. To accomplish this, a forward-adjoint operator pair based on a finite-difference time-domain diseretization of the 3D elastic wave equation is utilized to compute penalized least squares estimates of the initial pressure distribution. Computer-simulation and experimental studies are conducted to investigate the robustness of the reconstruction method to model mismatch and its ability to effectively resolve cortical and superficial brain structures.
1. Introduction
Photoacoustic computed tomography (PACT) is a noninvasive hybrid imaging modality that combines the optical absorption contrast of tissue with acoustic detection (R.Kruger et al., 1995; Kruger et al., 1999; Xu et al., 2011). In PACT, the target is illuminated with a short optical pulse resulting in the generation of acoustic pressure signals via the photoacoustic effect (Xu and Wang, 2006a; Oraevsky and Karabutov, 2003). The acoustic waves propagate out of the object and are subsequently detected by use of a collection of wideband ultrasonic transducers that are located outside the support of the object. Typically, the measured pressure signals are employed to estimate the induced initial pressure distribution or, equivalently, if the Grueneisen parameter is known, the absorbed optical energy distribution. The utility of PACT has been demonstrated in a number of in vivo studies of biological structure and function and in facilitating a number of medically relevant diagnostic tasks (Jones et al., 1980; Cheong et al., 2003; Xu et al., 2011; Xia et al., 2014).
Transcranial brain imaging represents an important application that may benefit significantly by the development of PACT methods. Existing high-resolution human brain imaging modalities include X-ray computed tomography (CT), magnetic resonance imaging (MRI), and positron emission tomography (PET). However, all suffer from significant shortcomings (Raichle, 1998; Pearce et al., 2013; Goo, 2013; Boxerman et al., 1995). Optical imaging modalities are desirable because they can provide functional information based on the high haemoglobin-contrast between tissues that contain different concentrations of blood. However, optical-only imaging, such as DOT, suffers from inherently low spatial resolution in transcranial imaging (Culver et al., 2003). On the other hand, PACT provides the same functional contrasts as optical imaging but has a superior spatial resolution due to the principles of ultrasonic detection. Hence, PACT is well-suited for anatomical and functional brain imaging applications. As PACT exploits haemoglobin-based endogenous optical contrast it can image anatomical structures such as blood vessels as well as measure functional parameters, such as oxygen saturation (sO2), and the metabolic rate of oxygen consumption (MRO2) (Yao et al., 2011; Zhang et al., 2006).
In vivo transcranial PACT studies have revealed structure and haemodynamic responses in small animals (Wang et al., 2003; Li et al., 2010; Xu et al., 2011). Because the skulls in these studies were relatively thin (~1 mm), they did not significantly aberrate the photoacougtic wavefields. Hence, conventional PACT image reconstruction algorithms such as backprojection (BP) (Kunyansky, 2007; Finch and Patch, 2004), that assume that the entire medium is acoustically homogeneous were successfully employed. This assumption in violated in transcranial PACT applications involving primate skulls. As a result, images produced by conventional reconstruction methods in the presence of a primate skull can contain significant distortions and degraded spatial resolution (Xu and Wang, 2006b; Jin et al., 2008; Yang and Wang, 2008; Nie et al., 2011; Huang et al., 2012). Thus, to render transcranial PACT an effective imaging modality for use in humans, it is necessary to develop image reconstruction methodologies that can accurately compensate for the skull-induced aberrations and attenuation of the recorded photoacoustic (PA) signals.
Numerous image reconstruction methods have been proposed to compensate for aberrations and attenuation of the measured PA wavefields induced by an acoustically heterogeneous fluid medium (Huang et al., 2013; Jin et al., 2008; Huang et al., 2012). However, a limitation of such works is that they assume a simplified wave propagation model in which longitudinal-to-shear-wave mode conversion within the skull (Schoonover and Anastasio, 2011; White et al., 2006; Fry, 1978) was neglected. As a result of the simplified models employed, only modest improvements in image quality were observed as compared to the use of a standard BP-based reconstruction algorithm. Therefore, there remains an important need for the development of improved reconstruction methodologies for transcranial PACT that are based on more accurate models of the imaging physics.
To circumvent limitations of the aforementioned approaches, a numerical framework for image reconstruction in transcranial PACT based on an elastic wave equation that describes an isotropic, 1ossy and heterogeneous medium was proposed and validated (Mitsuhashi et al., 2017). In that work, a discrete forward operator (i.e., imaging model) and an associated adjoint operator for transcranial PACT were implemented based on the 3D elastic wave equation. The adjoint operator was validated and employed as a reconstruction operator to compensate for aberrations introduced by the skull. Even though the adjoint operator may perform better than existing filtered BP methods in compensating for the acoustic and elastic properties of the skull, the use of the adjoint operator as a reconstruction operator possesses limitations. For instance, for a lossy medium and/or a sparsely sampled measurement aperture, the adjoint operator is not a good approximation of the inverse operator.
Furthermore, the use of an adjoint operator as a reconstruction operator does not provide a general framework for incorporating regularization that can help mitigate the effects of measurement noise and incomplete measurement data. Hence, the use of the adjoint operator to directly reconstruct images can reault in suboptimal contrast and suboptimal tradeoffs between image variance and spatial resolution. The use of the optimization-based image reconstruction methods proposed in this work can help circumvent these shortcomings. In other works, the adjoint of the continuous wave operator, which describes the propagation of PA waves in linear isotropic viscoelastic media has been proposed (Javaherian and Holman, 2018). Such studies have not explored image reconstruction problems with realistically sized 3D volumes or utilized experimentally acquired data.
In transcranial PACT, the head is illuminated from the outside with a near-infrared optical pulse resulting in the generation of acoustic pressure signals via the photoacoustic effect. As the scalp vessels can strongly absorb the illuminated light, only a small fraction of the illuminated light or optical fluence makes its way to the cortex resulting in the generation of initial pressure distribution in the cortex. Hence, there is a large difference in amplitude between the photoacoustically induced initial pressure distribution in the cortex and the photoacoustically induced initial pressure distribution in the scalp. Thus, spatially resolving the weak cortical structures from the strong scalp or superficial structures pokes a significant challenge for image reconstruction (Nie et al., 2012). A challenge for any transcranial PACT reconstruction algorithm is to be able to accurately reconstruct the cortical structures in the presence of large di8erences in amplitude between the initial pressure distribution generated in the cortex and the initial pressure distribution generated in the scalp. Furthermore, in most transcranial PACT image reconstruction algorithms it is assumed that the acoustic properties of the skull are known accurately beforehand. However, such information may be difficult to obtain in practice. Any inaccuracies in modeling the acoustic properties of the skull will be a source of model mismatch error in conventional image reconstruction algorithms. Thus, an additional challenge for a transcranial PACT reconstruction algorithm is to be able to robustly model errors arising from inaccurate modeling of the acoustic characteristics of the skull.
Given the previously developed numerical framework for implementing the forward-adjoint operator pair (Mitsuhashi et al., 2017), a natural topic of investigation in to explore the use of these operators in studies of optimization-based image reconstruction. Hence, in this work a modern optimization-based iterative image reconstruction algorithm for transcranial PACT in proposed and its performance in overcoming the aforementioned challenges is evaluated through computer-simulation and experimental studies. The computer-simulation studies explore the robustness of the optimization-based image reconstruction algorithm to noise as well as the model mismatch errors. In the presence of large differences in amplitude between the initial pressure distribution generated in the scalp and the initial pressure distribution generated in the cortex, the performance of the optimization-based reconstruction method (OBRM) in accurately spatially resolving the cortical and superficial structures is also investigated through computer-simulation and experimental studies.
The article is organized as follows. In Section 2, the physics of elastic wave propagation in elastic media is reviewed along with the modern optimization-based formulation of the image reconstruction problem. A description of the computer-simulation studies and a discussion of the corresponding results is provided in Section 3. In Section 4, the experimental phantom studies are described and the article concludes with a summary in Section 5.
2. Background
2.1. Photoacoustic wavefield propagation: Continuous and discrete formulation
Let the photoacougtically-induced stress tensor at location and time t ≥ 0 be defined as
| (1) |
where σij (r, t) represents the stress in the ith direction acting on a plane perpendicular to the jth direction. Additionally, let p0(r) denote the photoacoustically-induced initial pressure distribution within the object, referred to as the object function, and let represent the vector-valued acoustic particle velocity. Here, ρ(r), λ(r), and µ(r) represent the spatial distribution of the medium’s density and the spatial distribution of the Larne parameters, respectively. The compressional and shear wave propagation speed are given by and , respectively. The object function p0(r) and all functions that describe the elastic isotropic medium are assumed to be bounded with compact supports. Here, we model acoustic absorption of the skull by a diffusive absorption model (Moczo et al., 2007). The diffusive absorption model assumes that the wavefield absorption is independent of temporal frequency; this model does not accurately describe the power law based frequency-dependent absorption characteristics of soft tissue and bone (Szabo, 1994; Treeby and Cox, 2014). This model, however is sufficiently accurate in cases where the bandwidth of the photoacoustic signals is limited. Moreover the model also assumes that the shear absorption to compressional absorption ratio is given by the compressional velocity to shear velocity ratio. This is approximately true in bone, because slower shear waves are, in fact, more attenuated than faster compressive waves (Pinton et al., 2011). The model also assumes that for fluid media (soft tissue), the diffusive absorption value only describes the absorption of compressional waves as ‘shear waves are not supported in fluid media.
In a heterogenous isotropic elastic medium with a diffusive acoustic absorption distribution α(r), the propagation of and σ(r, t) can be modeled by the following two coupled equations (Boore, 1972; Virieux, 1986; Madariaga et al., 1998; Alterman and Jr., 1968):
| (2a) |
| (2b) |
subject to the initial conditions
| (2c) |
Here, tr (·) is the operator that calculates the trace of a matrix and in the identity matrix. In Eq. (2c), the object function p0(r) is assumed to be compactly supported in a fluid medium where the shear modulus µ(r) = 0. Hence, the formulation of the initial value condition assumes that there are no optical absorbers inside the elastic solid.
Consider that is recorded outside the support of the object for and , where denote a measurement aperture. In this case, the imaging model can be described by a continuous-to-continuous (C-C) mapping as:
| (3) |
where and in a linear operator that denotes the action of the wave equation given in Eq. (2). Moreover, denotes the measured data function, and the operator is the restriction of to .
In practice, the detected pressure wavefield is discretized temporally and spatially at specific transducer locations. Let denote the discretized pressure signal, where Nr represents the number of transducers and L represents the total number of discrete temporal samples. In the imaging model described in Eq. (3), the effects of the acousto-electrical impulse response (EIR) as well as the spatial impulse response (SIR) of the transducer have been ignored. However, the transducer responses can be incorporated into the imaging model readily (Huang et al., 2013). A continuous-to-discrete (C-D) PACT imaging model, can be generally expressed as
| (4) |
for k = 0, 1, 2, …, Nr, — 1 and l = 0, 1, 2, …, L — 1. Here, ∆t is the temporal sampling interval and the vectors , represent the position vectors of the Nr, receivers on the aperture .
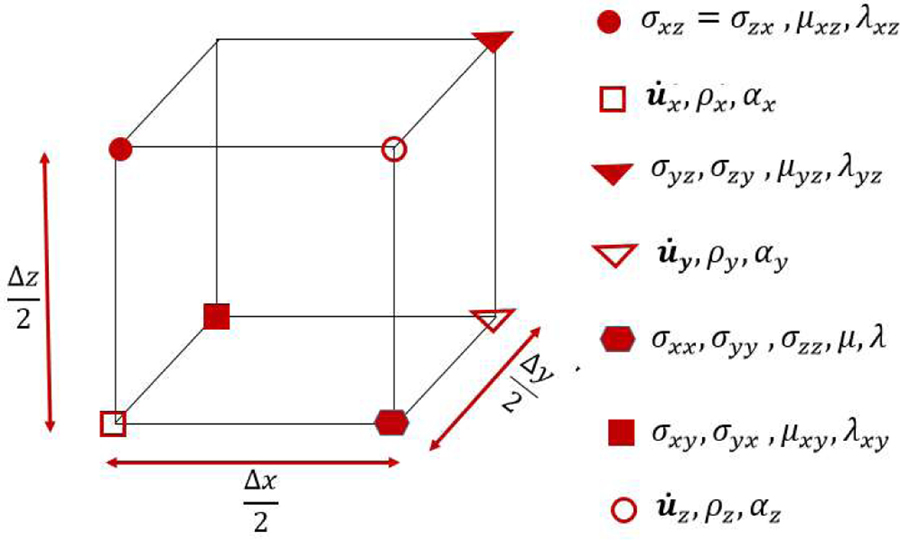
To obtain a discrete-to-discrete (D-D) imaging model for use with OBRM, finite-dimensional approximate representations of the object function p0(r) and the material parameters ρ(r), α(r), λ(r), and µ(r) need to be introduced. In this study, the numerical method employed to solve the wave equation in Eq. (2) was a 10th-order staggered grid finite difference time domain (FDTD) scheme. Note that for the staggered finite-difierence (FD) scheme, the material properties, stress, and particle velocity functions are sampled at different points of a staggered FDTD cell as shown in Fig. 1. Let ρ, α, λ, µ, and be the finite dimensional representations of ρ(r), α(r), λ(r), µ(r) and p0(r) respectively, where N is the total number of grid points on the 3D grid. For a given ρ, α, λ, µ, and p0, the FDTD method for solving the elastic wave equation can be described in operator form as
| (5) |
where is the discrete approximation of the wave operator that solves the initial value problem defined in Eq. (2) and is a sampling matrix that maps pressure data sampled on the computational grid onto the transducer locations. In this study, the transducers are assumed to be point-like and thus when the receiver and grid point locations do not coincide, an interpolation method is required. In this study, the elements of are chosen such that trilinear interpolation is performed. The goal of image reconstruction in a discrete setting is to determine an estimate of p0 given the measured data p and the forward model in Eq. (5).
Figure 1:
A staggered-grid FD cell with positions of the wavefield variables (Moczo et al., 2007).
In our previous work, the use of the adjoint operator as a reconstruction operator was investigated (Mitsuhashi et al., 2017). The reconstructed estimate of p0 obtained by use of the adjoint operator is given by
| (6) |
2.2. Optimization-based image reconstruction method (OBRM)
By use of the proposed D-D imaging model defined in Eq. (5), a variety of OBRMs can be employed for determining estimates of p0. In this work, we utilize an iterative reconstruction algorithm that seeks to compute penalized least squares estimates (PLS) by solving
| (7) |
where γ is a regularization parameter and is a regularizing penalty term. In the studies below, the total variance (TV) semi-norm penalty, given by
| (8) |
was employed. Here, [p0]n denotes the nth grid node, and [p0]n1-, [p0]n2-, and [p0]n3- are the neighboring nodes before the nth node along the first, second and third dimension, respectively. The fast iterative shrinkage/thresholding algorithm (FISTA) with backtracking linesearch and adaptive restart was employed to solve the optimization problem in Eq. (7) (Beck and Teboulle, 2009a; Beck and Teboulle, 2009b; Beck, 2014; O’donoghue and Candes, 2015).
3. Computer-simulation studies
The performance and robustness of the proposed OBRM was initially evaluated by use of computer-simulation studies as described below. Additionally, computer-simulation studies that assess the performance of the OBRM in the presence of measurement noise and the effects of TV regularization are summarized in Appendix A.
3.1. Resolution of superficial and cortical structures
As a consequence of the large differences in amplitude between the initial pressure distribution generated in the cortex and the initial pressure distribution generated in the scalp, spatially resolving the weak cortical structures from the strong scalp or superficial structures poses a significant challenge for transcranial image reconstruction (Nie et al., 2012). A computer-simulation study was performed to evaluate the performance of the proposed OBRM in accurately reconstructing cortical structures in the presence of strong absorbers in the scalp.
3.1.1. Methods
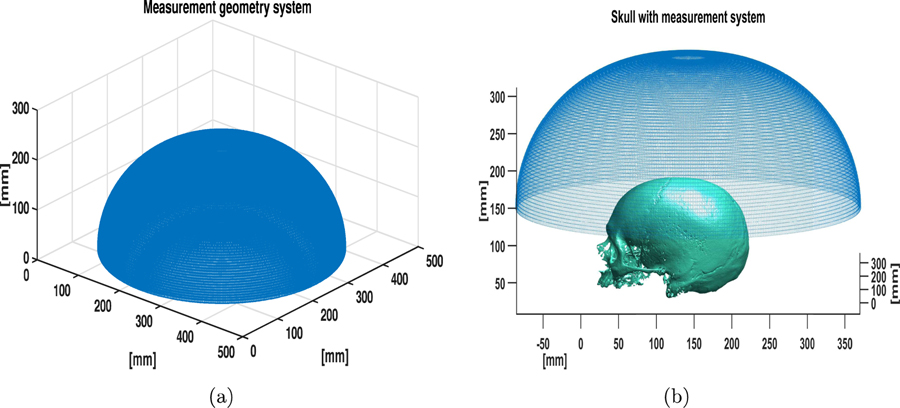
To study the performance of the OBRM in resolving scalp and cortical structures, the numerical blood vessel phantom shown in Fig. 2 was employed. The superficial blood vessels located in the scalp and the cortical vessels are visible in the maximum intensity projection (MIP) images. For display purposes, the dynamic range was adjusted so that the cortical vessels are visible; as a result, the superficial vessels appear saturated. The optical fluence ratio between the superficial and cortical vessel was assumed to be 50 (Nie et al., 2012). Hence, the ratio of initial pressure distribution between superficial and cortical blood vessels in the phantom shown in Fig. 2 was set to 50. A 3D computational volume of 408.0 mm × 408.0 mm × 190.2 mm was employed. A 3D approximately hemispherical measurement system, as shown in Fig. 3(a), was emulated. The measurement system consisted of a total 38400 transducers distributed evenly across 64 rings. The measurement system was similar to the experimental system used for acquisition of pressure data as described in Section 4. The position of the measurement system with respect to the skull is shown in Fig. 3(b).
Figure 2:
The maximum intensity projections of the numerical phantom that represents the 3D initial pressure distribution along (a) x-, (b) y- and (c) z-axes, respectively.
Figure 3:
(a) The map of transducer locations employed for the simulation studies. (b) The position of the skull relative to the transducer locations.
A 3D X-ray CT image of an intact human skull was utilized to generate the isotropic, elastic medium employed for the simulation studies. The CT images of the skull were employed to infer the thickness and contour of the skull and place it within the 3D simulation volume. For this set of simulation studies, the skull was assumed to be an acoustically homogeneous. In reality, however the skull bone is acoustically heterogeneous and consists of three relatively homogeneous layers: the outer table, inner table and the central diploe layer (Sadleir and Argibay, 2007; Marieb, 2011).
In order to extract the contour and location of the skull from CT images, a segmentation algorithm was employed. The segmentation algorithm generated a binary mask specifying the location of the skull within the 3D volume. The value of the medium parameters in the 3D volume were assigned such that the skull acoustic parameters (, , and ) were set at all grid positions where the mask was equal to one and the background acoustic parameters (, , and ) were set all grid positions where the mask was equal to zero. At the material interface between the skull and the background fluid medium, the density and the absorption values were averaged to avoid any instability with the FDTD wave equation solver (Moczo et al., 2007).
Different discretization strategies were employed to generate the simulated pressure data and to reconstruct the initial pressure distribution, thereby avoiding inverse crime (Colton and Kress, 2013). The simulated pressure data were generated by use of a spatial grid size of ∆x = 0.225 mm and a temporal sampling rate of 50 MHz. The simulated pressure data were corrupted white Gaussian noise with a standard deviation 10 percent of the maximum amplitude of cortical signals.
3.1.2. Results
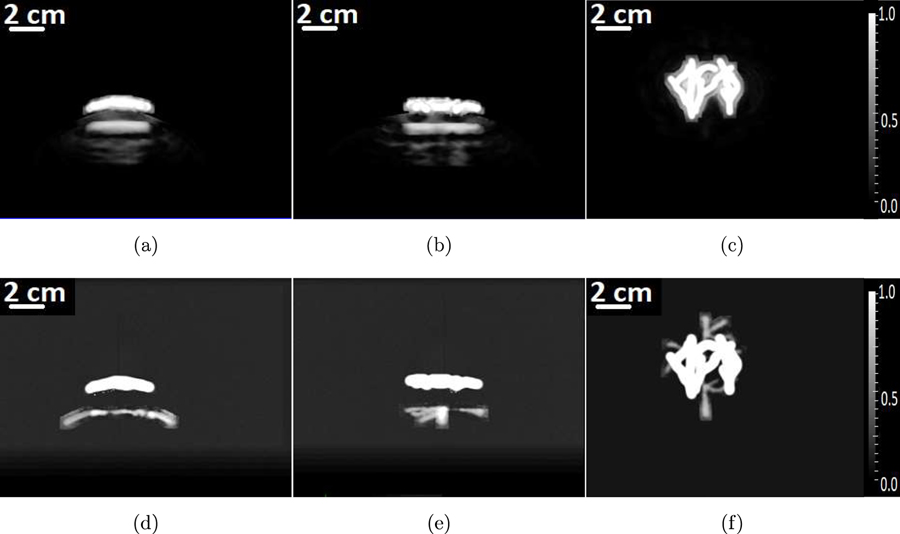
The MIP images of the 3D volumes reconstructed by use of the adjoint operator and the OBRM are shown in Figs. 4(a) to 4(c) and Figs. 4(d) to 4(f), respectively. Each column of images represents the MIPs of the reconstructed initial pressure distribution along the x-, y- and z-axes, respectively. All images were reconstructed with a uniform spatial grid sampling of ∆x = 0.3 mm. From Figs. 4(a) to 4(c), it is observed that the images produced by use of the adjoint operator do not clearly reveal the cortical vessels. This is because the bleed down effect from the superficial structures overwhelms the signal from the cortical structures. However this is not the case in the images reconstructed by use of the OBRM, as shown in Figs. 4(d) to 4(f). In these images, the superficial vessels are accurately resolved because the strong signals from the superficial vessels are spatially separated and do not overwhelm the cortical vessels. The OBRM was successful in improving the resolution of the superficial structures, thereby reducing the amount of contamination that affects the cortical structures. Hence, compared to the images reconstructed by use of the adjoint operator, the cortical vessels are prominent and visible in the images reconstructed by use of the OBRM.
Figure 4:
The MIP of the reconstructed 3D initial pressure distribution. The first row of images corresponds to images reconstructed using the matched adjoint operator. The second row of images corresponds to images reconstructed using the OBRM. Each column of images corresponds to the MIP of the 3D initial pressure distribution along x-, y- and z-axes, respectively.
3.2. Model mismatch studies
The proposed OBRM requires that the acoustic properties of the skull are known. However, such information may be difficult to obtain in practice. Any inaccuracies in modeling the acoustic properties of the skull will be a source of model mismatch error in Eq. (5). Model mismatch errors can result in artifacts in the reconstructed images. Hence, in this section, computer-simulation studies were conducted to evaluate the robustness of the proposed OBRM to model mismatch.
There are at least two major types of skull model errors/mismatches that are challenging to account for in OBRM. The first source of model mismatch resides in the inaccuracies in modeling the frequency-dependent absorption characteristics of the skull (White et al., 2006; Fry, 1978). In transcranial PACT imaging applications, the acoustic absorption is not negligible. In the initial value problem described in Eq. (2), the acoustic absorption within the skull was described by a diffusive absorption model (Aubry et al., 2003). The model ignores the fact that the wavefield absorption within the skull is dependent on the temporal frequency of the PA signals (White et al., 2006). This approximation, however, may be only reasonable for cases where the bandwidth of the PA signals are limited (Aubry et al., 2003). Computer-simulation studies were performed to explore the feasibility of the proposed OBRM when there was significant model mismatch with respect to accurately modeling the acoustic absorption characteristics of the skull.
The second major source of model mismatch that we commonly encounter originates from the failure to model the presence of acoustic heterogeneities within the skull. Various adjunct imaging data based methods as well as joint reconstruction methods can be employed to account for acoustic variations in the skull in the proposed optimization-based image reconstruction framework (Matthews et al., 2018; Poudel et al., 2018; Huang et al., 2016). A study of these techniques is beyond the scope of this study.
3.2.1. Methods
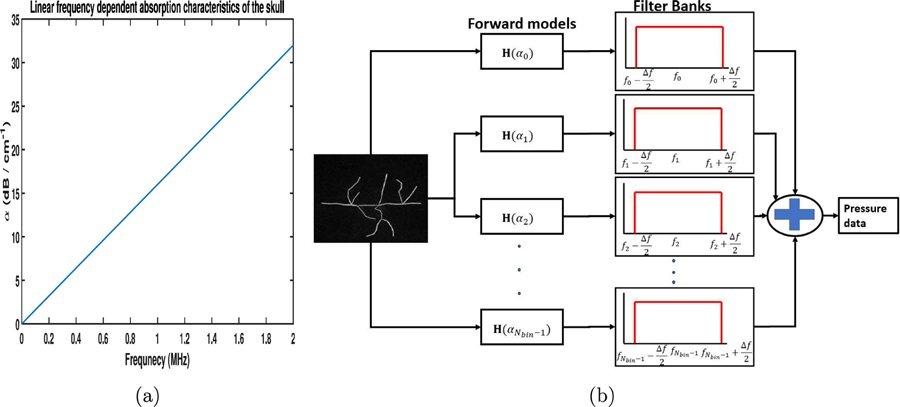
To study the impact of model mismatch associated with acoustic absorption, the cortical blood vessel phantom shown in Fig. 5 was employed. The forward pressure data were generated employing a skull model that had linear frequency-dependent absorption characteristics. The linear dependence of the compressional wave absorption value with respect to frequency is shown in Fig. 6(a). The slope of the linear frequency-dependent was 16 dBcm−1MHz−1. The shear wave absorption value is dependent on the ratio between the compressional speed and shear speed. hence, for the configuration described in Fig. 6(a), the shear wave absorption characteristics will be linear with respect to frequency and will have a slope of 32 dBcm−1MHz−1.
Figure 5:
The maximum intensity projections of the 3D initial pressure distribution along (a) x-, (b) y- and (c) z-axes, respectively.
Figure 6:
(a) The linear frequency-dependent compressional wave absorption characteristics of the skull. (b) A schematic describing the generation of forward data when employing the frequency-dependent absorption model.
In order to generate the simulated pressure data that modeled the frequency-dependent absorption characteristics of the skull, multiple runs of the imaging model with different diffusive absorption values had to be performed. This is due to the fact that the imaging operator in Eq. (5) assumed a diffusive absorption model where the absorption coefficient value is independent of frequency of PA signals. In order to account for the frequency-dependent absorption characteristics of the skull, multiple runs of the imaging operator and filtering operations need to be performed. A schematic describing the generation of the forward pressure data from a skull model with frequency-dependent absorption characteristics is shown in Fig. 6(b). The set of discrete diffusive absorption coefficient values used to generate the forward data are given by , where α0 is the linear slope value of the frequency-dependent absorption model. Here, Nbin are the number of frequency bins and fi represents the central frequency of the each bin. Let ∆f be the size of each frequency bin. To generate the pressure data, the frequency spectrum was discretized into different bins and the corresponding diffusive absorption value is assigned based on the central frequency of the bin. Hence, each frequency band was assigned its own constant diffusive absorption coefficient value that was calculated based on the frequency-dependent absorption characteristics shown in Fig. 6(a). Subsequently, pressure data corresponding to each of the diffusive absorption value αi were generated using the imaging model . Here, represents the D-D imaging model when the diffusive acoustic absorption value of the skull was set to αi. The pressure data corresponding to each fi are then subsequently filtered and summed to generate the final pressure data. Hence, the final pressure data contains contribution from all the frequency bands that have been appropriately weighted based on the action of the imaging operator and the filtering operation. For the simulation studies, we assume Nbin = 10 and ∆f = 0.2 MHz.
The same 3D computational volume and the measurement geometry employed in Section 3.1 were utilized. Furthermore, different discretization strategies were employed to generate the simulated pressure data and to reconstruct the initial pressure distribution. The simulated pressure data were generated using a spatial grid size of ∆x = 0.225 mm and a temporal sampling rate of 50 MHz. The simulated pressure data were corrupted with white Gaussian noise with a standard deviation 5 percent of the maximum amplitude of cortical signals before the application of the reconstruction method. The OBRM employed a diffusive absorption model with a fixed skull absorption coefficient for image reconstruction. All other acoustic properties of the skull other than the absorption coefficient value were assumed to be known.
3.2.2. Results
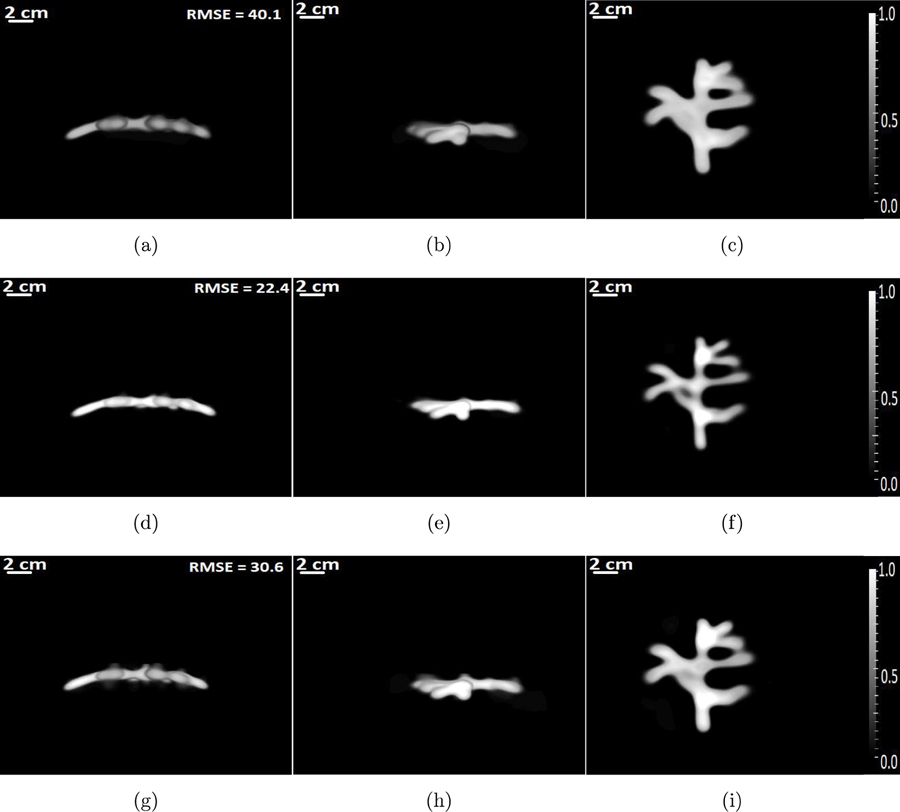
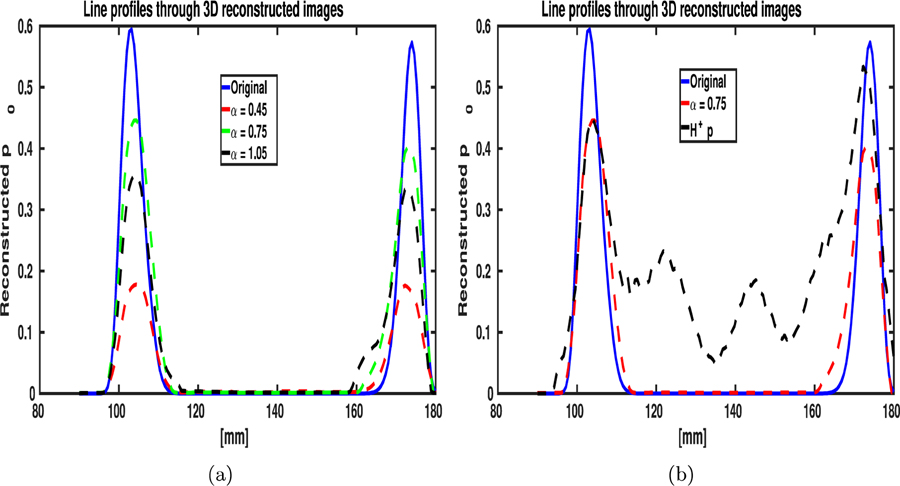
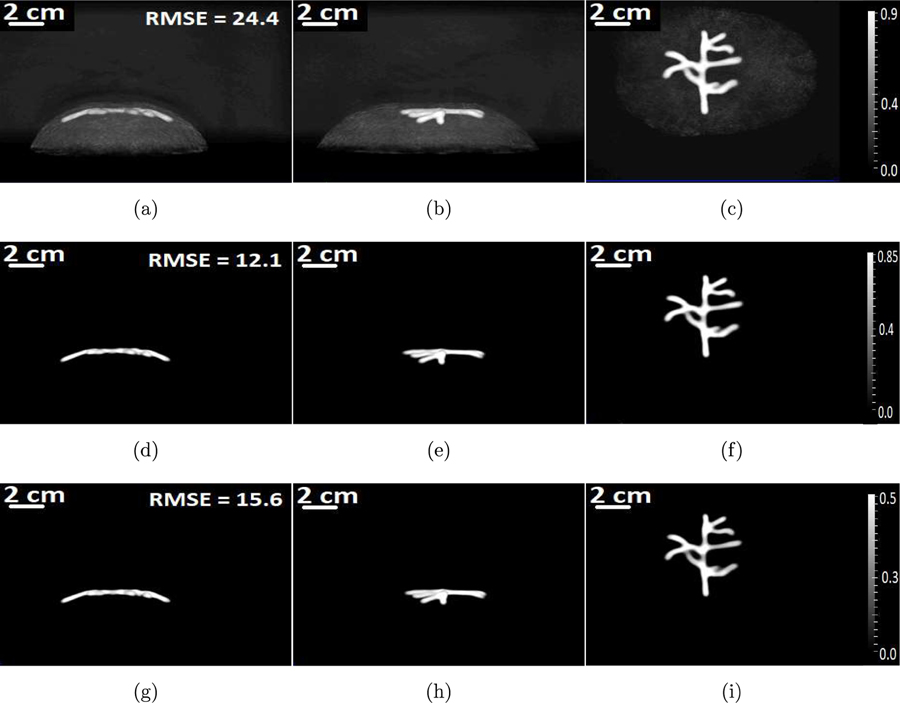
The MIPs of the 3D images reconstructed by use of the OBRM are shown in Fig. 7. Each column of images represent the maximum intensity projections of the reconstructed initial pressure distribution along the x-, y- and z-axes, respectively. Each row of Fig. 7 displays images reconstructed with a different diffusive absorption value. All the reconstruction was performed with a spatial grid sampling of ∆x = 0.3 mm. From Fig. 7, one can observe that the minimum root mean square error (RMSE) was obtained for the initial pressure distribution reconstructed with a diffusive absorption value of . The optimal value of the diffusive absorption value of α = 0.75 is associated with a central frequency of 0.5 MHz and the frequency bin of [0.4 MHz, 0.6MHz]. The optimal diffusive absorption value is defined as the diffusive absorption value associated with the OBRM that produced images with the lowest RMSE. The optimal absorption value was associated with the frequency band that contains the most energy in the measured pressure data. From the results, one can observe that the model mismatch due to inaccuracy in modeling for frequency-dependent characteristics of the skull can be accounted for by using a diffusive absorption model, as long as the diffusive absorption value is representative of the dominant frequency band in the measured pressure data. The line profiles through the reconstructed 3D images, shown in Fig. 9(a), also emphasize these observations.
Figure 7:
The maximum intensity projections of the 3D initial pressure distribution reconstructed by use of the OBRM. The first row of images corresponds to images reconstructed using a diffusive absorption value of α = 0.45. The second row of images corresponds to images reconstructed using a diffusive absorption value of α = 0.75, and the third row of images corresponds to images reconstructed using a diffusive absorption value of α = 1.05. Each column of images corresponds to MIP projections along x-, y-, and z-axes, respectively.
Figure 9:
The line profiles through the 3D volumes reconstructed using (a) the OBRM with different diffusive absorption values. (b) The line profile through the 3D volume reconstructed using the adjoint operator (α = 0.75) is compared with the line profile of the 3D volume reconstructed with the OBRM (α = 0.75).
The MIPs of the reconstructed 3D images reconstructed by use of the adjoint operator are shown in Figs. 8(a) to 8(c). The adjoint operation was performed with the optimal diffusive absorption value of . From Fig. 7 and Figs. 8(a) to 8(c), the contrast of the images obtained using the adjoint as the reconstruction operator is observed to be poor compared to the images obtained using the OBRM. The sharp difference in contrast can be also be observed by comparing the line profiles through the reconstructed images shown in Fig. 9(b).
Figure 8:
The maximum intensity projections of the reconstructed 3D initial pressure distribution using the adjoint operator with α = 0.75 along (a) x-, (b) y-, and (c) z-axes, respectively.
In summary, one can observe that the impact of the failure to model the frequency-dependent absorption characteristics of the skull results in blurring of the reconstructed images. However, the impact of model mismatch errors on the accuracy of the reconstruction can be minimized by employing diffusive absorption value associated with the dominant frequency band in the measured pressure data. This conclusion was confirmed by calculating at the RMSE of the reconstructed pressure distribution with different diffusive absorption values.
4. Experimental studies
In this section, studies that utilized experimental PACT data produced by use of a physical phantom are presented. Two sets of experimental PACT data were employed to validate the proposed OBRM. The experimental phantoms and the setup employed to acquire the measurement data are described below.
4.0.1. Phantoms
The design of the physical phantom employed for the experimental studies was motivated by transcranial PACT. The phantom was comprised of a spherical acrylic globe of thickness of 2.5 mm and an inner radius of 76.2 mm, placed within a 3D volume filled with water. The acrylic globe is an elastic solid that possesses acoustic property values that are representative of a human skull.
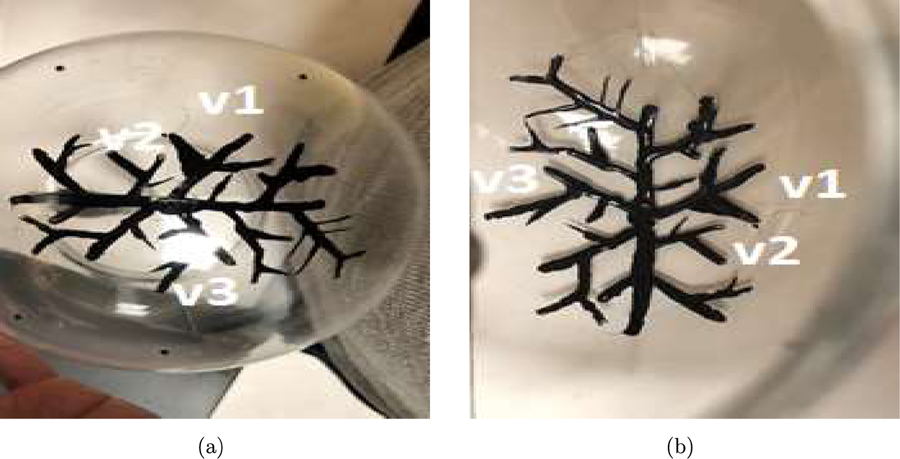
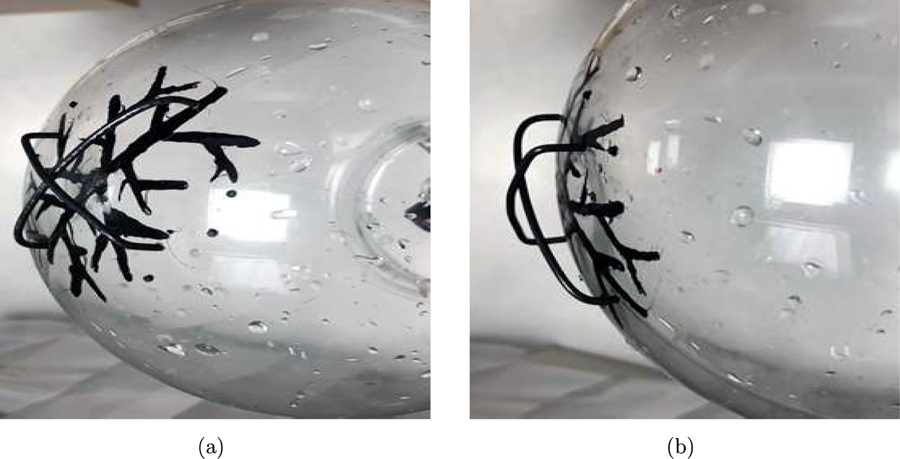
For the experimental studies, two configurations of optical absorbing vessel-like structures were employed with the acrylic globe. In the first configuration, referred to as phantom #l, optically absorbing vessel-like structures were painted on the inner surface of the acrylic globe, as shown in Fig. 10. These vessels were intended to mimic cortical vessels that reside near the top surface of a brain. Some of the cortical vessels painted on the acrylic globe have been labeled in Fig. 10 and will be referred to in the subsequent discussions. In the second configuration, also referred to as phantom #2, strips of superficial absorbers were placed outside the acrylic globe along with cortical vessels of phantom #l as shown in Fig. 11. Hence, the experimental data obtained from illuminating phantom #2 mimicked the more realistic Scenario described in Section 3.1 whereby the PACT data were generated from cortical aa well as superficial structures.
Figure 10:
Pictures of the vessels drawn on the inner surface of the acrylic globe.
Figure 11:
Pictures of the superficial structures placed outside the globe and the cortical structures placed inside the globe
4.0.2. System
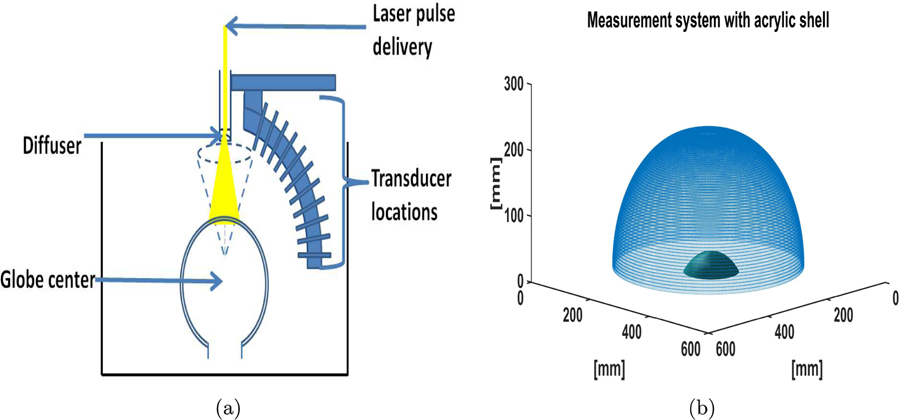
A 64 element transducer arc was scanned over 600 evenly distributed locations in the azimuthal direction in an approximately hemispherical configuration as shown in Fig. 12 to acquire the experimental data. The location of the acquisition system with respect to the acrylic globe is shown in Fig. 12(a). A short 6 ns laser pulse (Nd-YAG Quantel Brilliant B laser) with a repetition rate of 10 Hz at a wavelength of 1064 nm was used to irradiate a sample located in the center of the measurement system as shown in Fig. 12(a). The generated acoustic signals were detected by unfocused transducers, with a center frequency of 1 MHz and a −6 dB fractional bandwidth of 80 %. The electrical signals recorded by the transducers were sampled at a temporal sampling rate of 25 MHz. This system was employed to image the physical phantoms.
Figure 12:
(a) The schematic of the experimental transcranial PACT imaging system. (b) The position of the acrylic globe relative to the measurement system.
4.0.3. Data preprocessing
Prior to image reconstruction, the measured data were preprocessed. The preprocessing involved deconvolving the acquired EIR of the transducer. The Wiener deconvolution method was employed to estimate the deconvolved PA signals from the raw electrical transducer measurements. After deconvolution, the data were filtered with a Hann-window low-pass filter with a cutoff frequency of 2 MHz. The filtered data were also upsampled by a factor of 2.5, with the goal of circumventing numerical stability issues with the wave equation solver.
4.1. Results
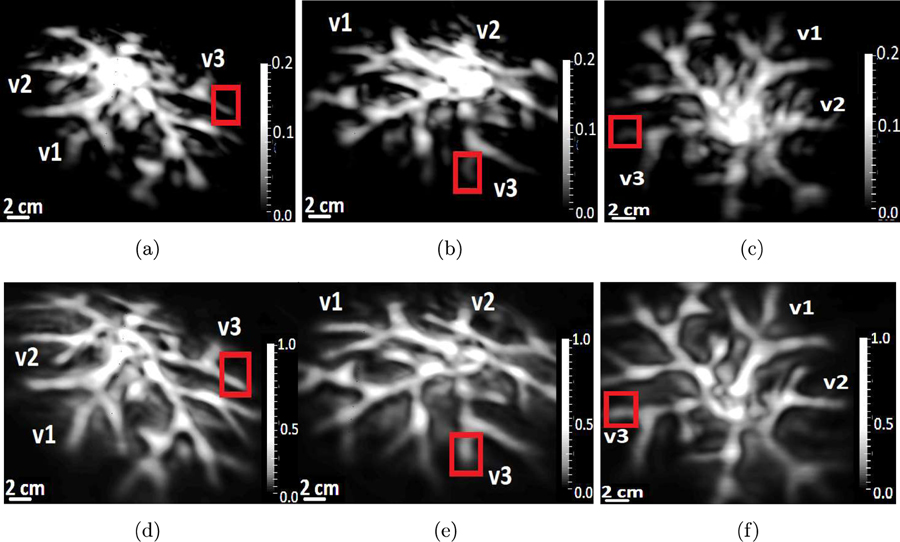
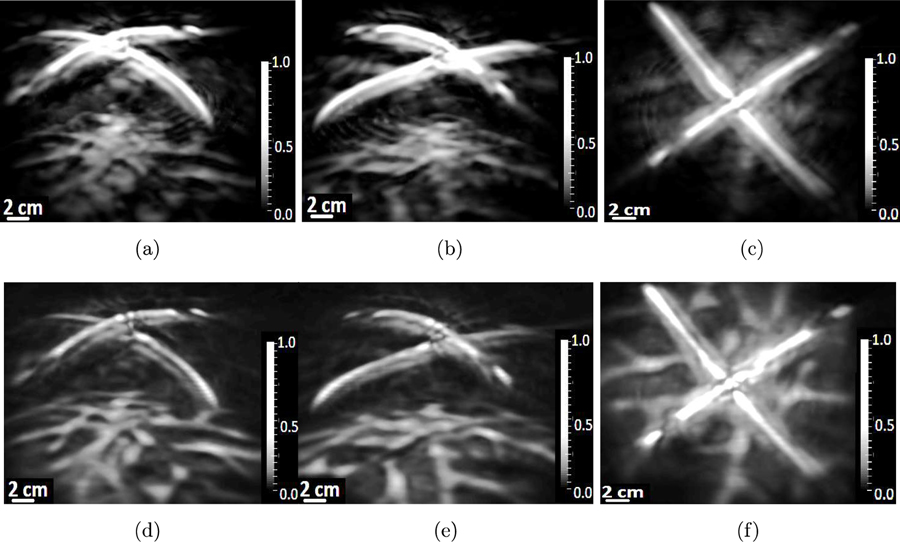
When employing either the adjoint operator or the OBRM for image reconstruction, the acoustic parameters of the acrylic globe were set to be , , . Similar to the computer-simulation study, at the material interface between the globe and the background fluid medium, the density and the absorption values were arithmetically averaged to avoid any instability issues with the FDTD wave equation solver. The images reconstructed from experimental data are shown in Figs. 13 and 14. The first set of results shown in Fig. 13 corresponds to an experiment where the pressure data were generated by illuminating phantom #l. Each column of images shown in Fig. 13, corresponds to 2D maximum intensity projections of the reconstructed 3D volume along three mutually perpendicular directions. The first row of images shown in Fig. 13 corresponds to images reconstructed by use of the adjoint operator while the second row of images corresponds to images reconstructed by use of the OBRM with no regularization.
Figure 13:
The maximum intensity projections along three mutually perpendicular directions of the 3D cortical structures of phantom #l reconstructed by use of the (a)-(c) adjoint operator and, (d)-(f) the OBRM.
Figure 14:
The maximum intensity projections along three mutually perpendicular directions of the 3D cortical and superficial structures of phantom #2 reconstructed by use of (a)-(c) the adjoint operator, and (d)-(f) the OBRM.
The vessels in the reconstructed images in Fig. 13 are given the same labels (v1, v2, v3) as the vessels shown in Fig. 10 to facilitate comparison between the reconstructed images and the photographic images. Similar to the computer-simulation studies, the contrast of the images reconstructed by use of the OBRM, shown in Figs. 13(d) to 13(f), is significantly higher compared to that of the images reconstructed by use of the adjoint operator shown in Figs. 13(a) to 13(c). The contrast was quantitatively evaluated in 3D region demarcated by the red bounding box shown in Fig. 13. The contrast was evaluated by dividing the difference in mean signal intensity of the vessel structure and the background in the selected 3D volume and dividing it by the variance of the background signal. It was found that the contrast of the image reconstructed by use of the the OBRM was 12.6 compared to a contrast of 3.2 for the image reconstructed by use of the adjoint operator. Hence, an improvement of contrast by a factor of approximately 4 was observed when the image was reconstructed by use of the OBRM as opposed to reconstructed by use of the matched adjoint operator. Furthermore, one can observe vessel like structures labelled v1, v2, v3 towards the outer periphery of the images are distinctly visible in the images reconstructed by use of the OBRM while the same structures are not in the images reconstructed by use of the adjoint operator. The results in Fig. 13 demonstrate that the use of OBRM to reconstruct initial pressure distribution within an elastic media can lead to significant improvement in image quality compared to the images generated using the adjoint operator. The second set of experimental resu1tg corresponding to pressure data generated by illuminating phantom #2 is shown in Fig. 14. Each column of images shown in Fig. 14 have been generated by performing MIP of the reconstructed 3D volume along three mutually perpendicular directions. In addition, the first row of images shown in Fig. 14 corresponds to images reconstructed by use of the adjoint operator while the second row of images corresponds to images reconstructed by use of the OBRM with no TV regularization. In the images reconstructed by use of the adjoint operator as shown in Figs. 14(a) to 14(c), the signals from the superficial structures spread into the cortical region to considerably degrade the image quality of the reconstructed cortical structures. In the computer-simulation results obtained using the adjoint as a reconstruction operator, the cortical structures were not visible as they were completely overwhelmed by signals from the superficial structures. In the images reconstructed by use of the adjoint operator from the experimental data, the signal from the superficial structures do not overwhelm the cortical structures to the same extent as shown in the images reconstructed with the use of the adjoint operator in the computer-simulation studies. This is due to the fact that the acrylic globe is far less absorbing than a human skull. Hence, the fluence mismatch in the experimental setup using a acrylic skull is not high enough for the signals from the superficial structures to completely overwhelm the cortical vessels in the images reconstructed by use of an adjoint operator.
However, the signals from the superficial structures that contribute to obscuring the cortical structures, is significantly mitigated in the images reconstructed with the aid of the OBRM, as shown in Figs. 14(d) to 14(f). The vessel like cortical structures are much more clearly visible in the images reconstructed by use of the OBRM as compared to the images reconstructed by use of the adjoint operator. Hence, the results in Fig. 14 demonstrate that the OBRM is effective in accurately resolving the superficial structures and is successful in mitigating the signals from superficial structures that contribute to obscuring the cortical structures. This leads to significant improvements in image quality of the reconstructed cortical structures when employing the OBRM as compared to the adjoint operator.
5. Conclusion
In this work, an OBRM for use in transcranial PACT was proposed and investigated. The proposed method was based on the 3D elastic wave equation that accurately modeled the physics of acoustic wave propagation in linear, isotropic elastic lossy, heterogeneous media. Such modern reconstruction methods allow for accurate modeling of the imaging physics and provide a general framework to incorporate regularization, which can help mitigate the effects data incompleteness, model mismatch and noise. The proposed OBRM was validated and investigated in computer-simulation and experimental phantom studies whose designs were motivated by transcranial PACT applications.
The computer-simulation and experimental studies compared and contrasted the performance of the OBRM and the adjoint as a reconstruction operator. The results from the studies demonstrated that the use of adjoint as a reconstruction operator yielded reconstructed images that possessed suboptimal contrast. The images reconstructed by use of the OBRM had improved contrast and also allowed for flexibility in reconstructing images with improved tradeoff between image variance and spatial resolution. Furthermore, the robustness of the OBRM to model mismatch was also studied. The model mismatch associated with failure to model accurately the acoustic absorption capabilities of the skull was explored through computer-simulation studies. The results demonstrated that when employing the OBRM, the failure to model the frequency-dependent characteristics did not have a significant effect on the reconstructed image quality when an appropriate diffusive absorption coefficient value was employed, that corresponded to the dominant frequency band in the measured pressure data.
A challenge for any transcranial PACT reconstruction algorithm is to be able to accurately reconstruct the cortical structures in the presence of large differences in amplitude between the initial pressure distribution generated in the cortex and the initial pressure distribution generated in the scalp. Hence, computer-simulation studies and experimental phantom studies were conducted to explore the feasibility of the proposed OBRM in resolving superficial and cortical structures. The results from both computer-simulation and experimental phantom studies demonstrated that the OBRM is effective in accurately resolving the superficial structures and cortical structures. The significant improvement in the image quality of the cortical structures when employing the OBRM was more pronounced when the difference in optical fluence between the scalp and the cortex was high.
There remain several important topics for further investigation. One of the major sources of model mismatch that we commonly encounter in transcranial PACT originates from the failure to model the presence of acoustic heterogeneities within the skull. Therefore, future studies should work towards formulation of joint reconstruction problem for transcranial PACT applications. In such joint reconstruction formulations, the optimization-based reconstruction procedure can be employed to reconstruct both the initial pressure distribution and the spatial distribution of the skull acoustic parameters concurrently.
Acknowledgments
This work was supported in part by National Institutes of Health grants R01 NS102213, U01 NS099717 and 5T32EB01485505.
Appendix A. General reconstruction studies
The performance of the OBRM with varying TV regularization parameters was evaluated in the presence of measurement noise. The performance of the OBRM was evaluated by comparing the image quality of the iteratively reconstructed images with different regularization parameters with that of images reconstructed by use of the matched discrete adjoint operator. Although employing the matched discrete adjoint operator as a reconstruction operator allows one to compensate for the presence of elastic media such as the skull, it is ineffective in compensating for measurement noise and also yields images with suboptimal contrast.
Methods
The initial pressure distribution employed in the simulation studies mimicked cortical blood vessels (CBVs). The numerical phantom, shown in Fig. 5, consisted of CBVs positioned approximately 6 mm below the inner surface of the skull. The 2D maximum intensity projection images along the x-, y-, and z-axes of the initial pressure distribution are shown in Fig. 5. The same 3D computational volume and the measurement geometry employed in Section 3.1 were utilized. In addition, the skull model described in Section 3.1 was used to simulate the pressure data. The simulated pressure data were generated using a spatial grid sampling of ∆x = 0.225 mm and a temporal sampling rate of 50 MHz The simulated pressure data were corrupted with white Gaussian noise with a standard deviation 5 percent of the maximum amplitude of cortical signals before the application of the reconstruction operator.
Results
The MIP of the reconstructed 3D images using the OBRM are shown in Fig. Al. Each column of images represent the MIP of the reconstructed initial pressure distribution along the x-, y- and z-axes, respectively. Each row of images in Fig. A1 were reconstructed with a different TV regularization parameter value γ. The reconstruction algorithm was performed with a spatial grid sampling of ∆x = 0.3 mm.
The images reconstructed by use of the OBRM with different TV regularization parameter values show that with increased regularization, the images get less noisy along with getting increasingly blurred. Hence, the tradeoff between variance and spatial resolution with different regularization parameter values is illustrated by comparing the reconstructed images shown in Fig. Al. The line profiles through the reconstructed 3D images, shown in Fig. 3(a), also illustrate the impact of TV regularization on the mitigation of noise in the reconstructed image. The root mean square error (RMSE) between the original initial pressure distribution and the reconstructed initial pressure distribution is shown on the image corresponding to the projection along x-axis in Fig. Al. The minimum RMSE was obtained for the initial pressure distribution reconstructed with a TV regularization parameter value of γ =0.05.
The MIP of the reconstructed 3D images using the adjoint as the reconstruction operator is shown in Figs. 2(a) to 2(c). From the images shown in Fig. A1 and Figs. 2(a) to 2(c), we can observe that the contrast of the images obtained using the adjoint operator as the reconstruction operator is poor compared to the images obtained using the OBRM. The sharp difference in contrast can be also be observed by comparing the line profiles through the reconstructed images shown in Figs. 3(a) and 3(b). Owing to the lack of regularization in the adjoint formulation, the images reconstructed by use of the adjoint operator are noisy and have poor image quality.
Figure Al:
The MIPs of the reconstructed 3D initial pressure distribution by use of the OBRM. The first row of images corresponds to images reconstructed with a TV regularization value of γ = 0, the second row of images corresponds to images reconstructed with a TV regularization value of γ = 0.05 and the third row of images corresponds to images reconstructed with a TV regularization value of γ = 0.1. Each column of images corresponds to MIP projections along x-, y-, and z-axes, respectively.
Figure A2:

The maximum intensity projections of the reconstructed 3D initial pressure distribution using the adjoint operator along (a) x-, (b) y-, and (c) z-axes, respectively.
Figure A3:
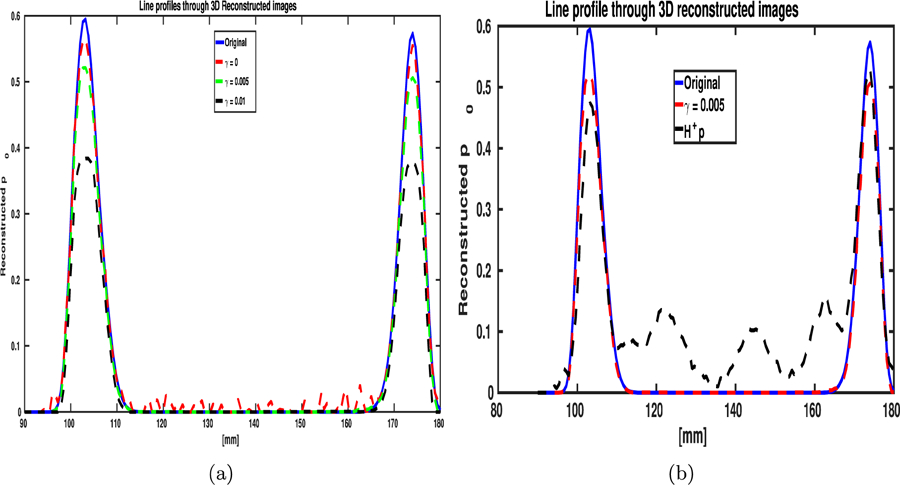
The line profiles through the 3D volumes reconstructed by use of the (a) the OBRM with different valuea of TV regularization parameters. (b) The line profile through the 3D volume reconstructed using the adjoint operator is compared with the line profile of the 3D volume reconstructed with the OBRM (γ = 0.05).
Appendix B. OBRM algorithm
The proposed OBRM is described in detail in Algorithm 1. Since, the regularization term is non-smooth, the use of accelerated proximal gradient-based methods like, FISTA, can be employed to solve the optimization problem. The following notation to describe the proximal operator of a scaled function κf, wheres κ > 0, is employed to describe the algorithm
| (B.1) |
For brevity, the following notation is employed
| (B.2) |
| (B.3) |
| (B.4) |
The algorithm described in Algorithm 1 has a number of advantages over alternative first-order optimization methods. First-order optimization methods refer to the set of methods for which the computation of the descent direction involves a linear or first order taylor approximation of the cost function. Hence, information about the gradient of the function is employed to compute the descent direction. The FISTA method belongs to a subset of the first-order methods called the proximal-gradient methods that permits the use of non-smooth regularization terms, such as the TV semi-norm. Furthermore, it also belongs to a family of optimization methods that for weakly convex optimization problems achieves the optimal asymptotic convergence rate (Beck and Teboulle, 2009a; Beck and Teboulle, 2009b; Beck, 2014). Namely, for a weakly convex function C(p0) FISTA obtains the convergence rate
| (B.5) |
where k is the iteration number and is the estimate of the sought-after quantity for the k-th iteration. The problem given by Eq. (7) represents a weakly convex optimization problem whenever is not full rank and is convex.
References
- Alterman Z and Jr. F K 1968. Bulletin of the Seismological Society of America 58(1), 367–398. [Google Scholar]
- Aubry JF, Tauter M, Pernot M, Thomas JL and Fink M 2003. The Journal of the Acoustical Society of America 113(1), 84–93. [DOI] [PubMed] [Google Scholar]
- Beck A 2014. Introduction to Nonlinear Optimization: Theory, Algorithms, end Applications with MATLAB Vol. 19 SIAM. [Google Scholar]
- Beck A and Teboulle M 2009a. IEEE Transactions on Image Processing 18(l1), 2419–2434. [DOI] [PubMed] [Google Scholar]
- Beck A and Teboulle M 2009b. SIAM journal on imaging sciences 2(1), 183–202. [DOI] [PMC free article] [PubMed] [Google Scholar]
- Boore DM 1972. in Bolt B, ed., ‘Methods in Computational Physics’ Academic Press; New York. [Google Scholar]
- Boxerman JL, Bandettini PA, Kwong KK, Baker JR, Davis TL, Rosen BR and Weisskoff RM 1995. Magnetic Resonance in Medicine 34(1), 4–10. [DOI] [PubMed] [Google Scholar]
- Cheong W, Prahl S and Welch A 2003. ITEM. Journal of Quantum Electronics 26(12), 1086–1099. [Google Scholar]
- Colton D and Kress R 2013. Inverse Acoustic end Electromagnetic Scattering Theory 2nd edn Springer; New York. [Google Scholar]
- Culver J, Choe R, Holboke M, Zubkov L, Durduran T, Slemp A and et al. 2003. Medical Physics 30, 235–47. [DOI] [PubMed] [Google Scholar]
- Finch D and Patch SK 2004. SIAM journal on mathematical analysis 35(5), 1213–1240. [Google Scholar]
- Fry FJ 1978. J. Accoust. Soc. Am 63(5), 1576–1590. [DOI] [PubMed] [Google Scholar]
- Goo H 2013. Clinical Pediatric Hematology-Oncology 20, 13–21. [Google Scholar]
- Huang C, Nie L, Schoonover RW, Guo Z, Schirra CO, Anastasio MA and Wang LV 2012. Journal of Biomedical Optics 17(6), 066016–1–066016–8. URL: 10.1117/1.JBO.14.d.06016 [DOI] [PMC free article] [PubMed] [Google Scholar]
- Huang C, Nie L, Wang LV and Anastasio MA 2013. IEEE. Trans. Med. Imag 32(32), 1097–1110. [DOI] [PMC free article] [PubMed] [Google Scholar]
- Huang C, Wang K, Schoonover RW, Wang LV and Anastasio MA 2016. IEEE transactions on computational imaging 2(2), 136–149. [DOI] [PMC free article] [PubMed] [Google Scholar]
- Javaherian A and Holman S 2018. Inverse Problems 34(8), 085003. [Google Scholar]
- Jin X, Li C and Wang LV 2008. Medical physics 35(7Part1), 3205–3214. [DOI] [PMC free article] [PubMed] [Google Scholar]
- Jones W, Jirtle R, Rafal M and Schaeffer D 1980. Radiat. Oncol., Biol., Phys 6, 681–687. [DOI] [PubMed] [Google Scholar]
- Kruger R, Reinece D and Kruger G 1999. Med. Phys 26, 1832–1837. [DOI] [PubMed] [Google Scholar]
- Kunyansky LA 2007. Inverse Problems 23, 373–383. [Google Scholar]
- Li C, Aguirre A, Gamelin J, Maurudis A, Zhu Q and Wang LV 2010. J. Biomed. Opt 15(1), 010509. [DOI] [PMC free article] [PubMed] [Google Scholar]
- Madariaga R, Olaen K and Archuleta R 1998. Bulletin of the Seismological Society of America 88(5), 1182–1197. [Google Scholar]
- Marieb E. ‘Essentials Of human anatomy and physiology (10th)’. 2011.
- Matthews TP, Poudel J, Li L, Wang LV and Anastasio MA 2018. SIAM journal on imaging sciences 11(2), 1560–1588. [DOI] [PMC free article] [PubMed] [Google Scholar]
- Mitsuhashi K, Poudel J, Matthews TP, Garcia-Uribe A, Wang LV and Anastasio MA 2017. SIAM journal on imaging sciences 10(4), 2022–2048. [DOI] [PMC free article] [PubMed] [Google Scholar]
- Moczo P, Kriatek J, Galia M, Pazak P and Balazovjech M 2007. acta physica slovaca 57(2), 177–406. [Google Scholar]
- Nie L, Car X, Maalov KI, Garcia-Uribe A, Anastasio MA and Wang LV 2012. Journal of biomedical optics 17(11), 110506. [DOI] [PMC free article] [PubMed] [Google Scholar]
- Nie L, Guo Z and Wang LV 2011. J. Adorned. Opt 16(7), 076005. [DOI] [PMC free article] [PubMed] [Google Scholar]
- O’donoghue B and Candes E 2015. Foundations of computational mathematics 15(3), 715–732. [Google Scholar]
- Oraevsky A and Karabutov AA 2003. in Vo-Dinh T, ed., ‘Biomedical Photonics Handbook’ CRC; Boca Raton, FL. [Google Scholar]
- Pearce M, Salotti J and Little M 2013. Pediatric Radiology 43, 517–18. [Google Scholar]
- Pinton G, Aubry JF, Bosay E, Mueller M, Pernot M and Tauter M 2011. Medical Physics 39, 299–307. [DOI] [PubMed] [Google Scholar]
- Poudel J, Matthews TP, Anastasio MA and Wang LV 2018. in ‘Photons Plus Ultrasound: Imaging and Sending 2018’ Vol. 10494 International Society for Optics and Photonics p. 104942U. [Google Scholar]
- Raichle ME 1998. Proceedings of the National Academy of Sciences 95, 765–772. [DOI] [PMC free article] [PubMed] [Google Scholar]
- Kruger R, Liu P, Fang Y and Appledorn CR 1995. Med. Phys 22, 1605–1609. [DOI] [PubMed] [Google Scholar]
- Sadleir R and Argibay A 2007. Annals of Biomedical engineering 35(10), 1699–1712. [DOI] [PMC free article] [PubMed] [Google Scholar]
- Schoonover RW and Anastasio MA 2011. JOSA A 28(10), 2091–2099. [DOI] [PMC free article] [PubMed] [Google Scholar]
- Szabo TL 1994. The Journal of the Acoustical Society of America 96(1), 491–500. [Google Scholar]
- Treeby BE and Cox B 2014. The Journal of the Acoustical Society of America 136(4), 1499–1510. [DOI] [PubMed] [Google Scholar]
- Virieux J 1986. Geophysics 51(4), 889–901. [Google Scholar]
- Wang GX, Pang Y and Wang LV 2003. Nat. Biotechnology 21, 803–806. [DOI] [PubMed] [Google Scholar]
- White P, Clement G and Hynynen K 2006. Ultrasound in medicine & biology 32(7), 1085–1096. [DOI] [PMC free article] [PubMed] [Google Scholar]
- Xia J, Yao J and Wang LV 2014. Electromagnetic waves (Cambridge, Mass.) 147, 1. [DOI] [PMC free article] [PubMed] [Google Scholar]
- Xu M and Wang LV 2006a. Rev. Sci. Instrum. 77, 041101. [Google Scholar]
- Xu Y and Wang LV 2006b. IEEE. Trans. on Ultrasonics, Ferroelectrics, and Freq. Control 53(3), 542–548. [DOI] [PubMed] [Google Scholar]
- Xu Z, Zhu Q and Wang LV 2011. J. Biomed. Opt 16(6), 066020. [DOI] [PMC free article] [PubMed] [Google Scholar]
- Yang X and Wang LV 2008. J. Biomed. Opt 13(4), 044009. [DOI] [PubMed] [Google Scholar]
- Yao J, Maalov KI, Zhang Y, Xia Y and Wang LV 2011. Journal of Biomedical Optics 16(7), 076003–076003–11. [DOI] [PMC free article] [PubMed] [Google Scholar]
- Zhang HF, Maslov K and Wang LV 2006. Nature Biotech 24, 848–851. [DOI] [PubMed] [Google Scholar]


