ABSTRACT
Maternally inherited diabetes and deafness (MIDD) is a mitochondrial disease associated with dysfunction of the retinal pigment epithelium and photoreceptor outer segments in a peri-foveal arrangement. If chorioretinal atrophy develops, patients risk losing vision. We retrospectively analysed three patients with genetically proven MIDD, assessing atrophy size and progression using overlay in photoshop. Patients showed increase in chorioretinal atrophy of 205%, 46% and 34%, respectively. We also found location-specific progression, where hyper-autofluorescent deposits evolved into areas of atrophy. These results support the use of fundus autofluorescence as a valuable tool in monitoring disease progression and providing prognostic information for clinicians and patients.
KEYWORDS: Atrophy, fundus autofluorescence, maculopathy, MIDD
Introduction
In patients with maternally inherited diabetes and deafness (MIDD) harbouring the m.3243A>G mitochondrial DNA mutation, attempts have been made to understand the macular dystrophy which is seen in up to 85.7%1 of the patients. These changes typically involve the macula in a peri-foveal pattern, and have been correlated with outer retinal layer dysfunction on optical coherence tomography (OCT). Our three patients show varying degrees of maculopathy in genetically proven MIDD, and highlight the utility of fundus autofluorescence (FAF) in this context.
Materials and methods
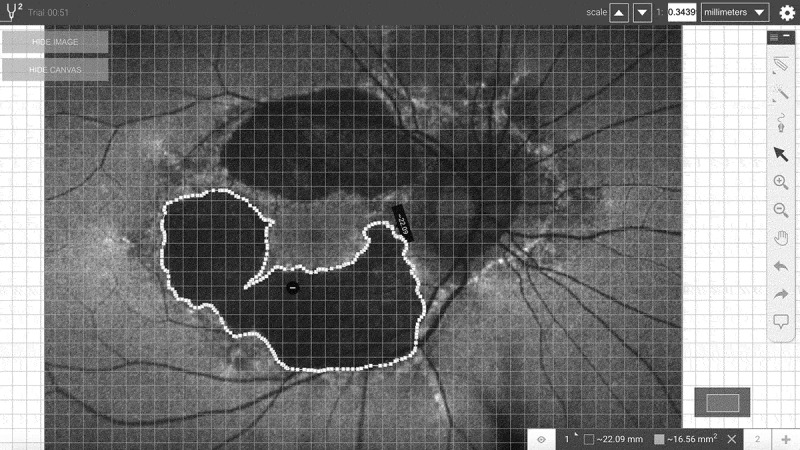
Patients with genetically proven MIDD were retrospectively analysed, comparing findings at initial diagnosis with follow-up 3 years later. FAF images were analysed, with the area of macular atrophy estimated using an online program SketchAndCalc (iCalc Inc. See Figure 1). For each image, optic disc area (correlating with the borders of Elschnig’s ring) was also calculated using this method. Total atrophy area was then standardised with respect to optic disc area, to allow comparison between initial and follow-up images, as well as improve accuracy of comparison between subjects. Initial and follow-up images were then overlayed using layer techniques in Photoshop CC (Adobe Systems Incorporated, San Jose, United States), with distortion and lens correction optimised to create the most accurate overlay possible. Extent of macular atrophy was thus compared quantitatively using area, as well as qualitatively by visual overlay. Size of atrophy and percentage increase was reported, however formal statistical analysis was not performed due to the small sample size.
Figure 1.

Sample image analysis. Areas of posterior pole changes were outlined, and adjusted to optic disc area. Image analysis performed using SketchAndCalc (iCalc Inc).
Results
Subjects
Patient 1 was a 52-year-old Australian woman of Italian background with insulin-dependent diabetes mellitus, gradually progressive sensorineural hearing loss and maculopathy. Her mother and maternal grandmother displayed similar symptoms. Her visual acuity was 6/6 in both eyes without other ophthalmic signs or symptoms, and these findings remained unchanged at 3-year follow-up.
Patient 2 was a 69-year-old Caucasian man with sudden onset sensorineural hearing loss 20 years earlier, diet controlled diabetes mellitus, and maculopathy. He described doughnut-shaped scotomas developing several weeks prior to diagnosis. Bilateral hearing loss affected his mother and maternal grandmother. His visual acuities were 6/6 bilaterally, with marked pericentral scotomas on perimetry. Follow-up ophthalmic assessment was unchanged.
Patient 3 was a 72-year-old man of Northern Italian heritage with bilateral sensorineural hearing loss, asymptomatic insulin-dependent diabetes mellitus and maculopathy. He also described diplopia, ptosis and imbalance, and developed dilated cardiomyopathy after an acute deterioration. Hearing loss was present in his mother, while his younger brother is diabetic. Initially, his visual acuities were 6/6 with marked colour blindness (Ishihara 0/14) bilaterally. Global ophthalmoplegia (−2 to −3), proximal muscle weakness, ataxia and absent ankle jerks were also noted. At follow-up, his best-corrected visual acuities were 6/12 right eye and 6/24 left eye, with worsening ataxia and cognitive slowing.
Analysis
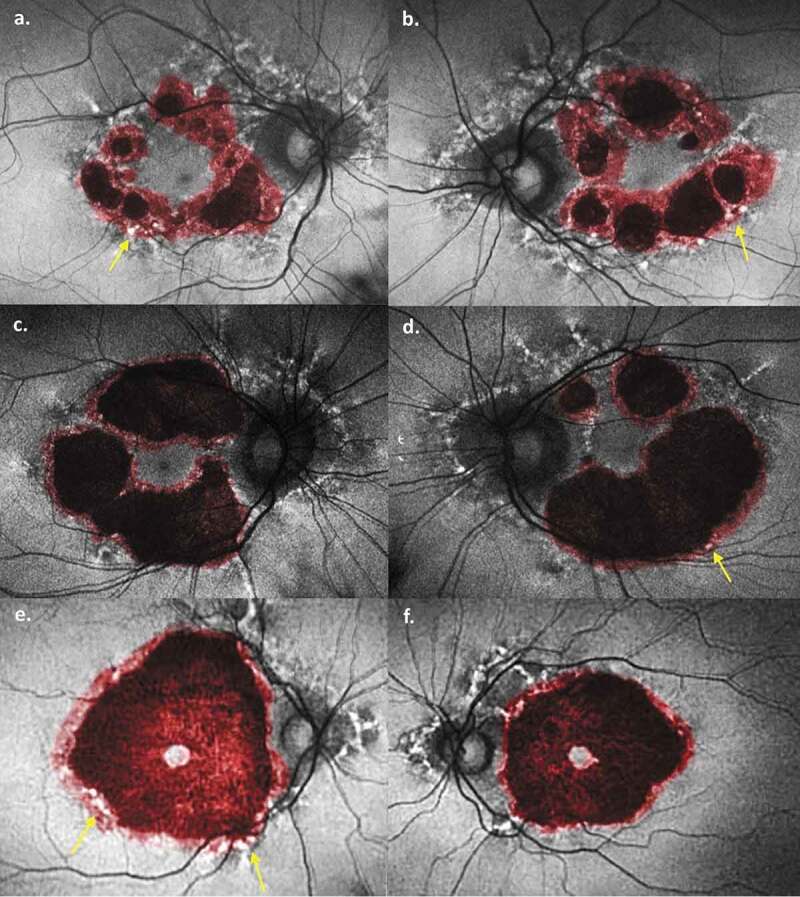
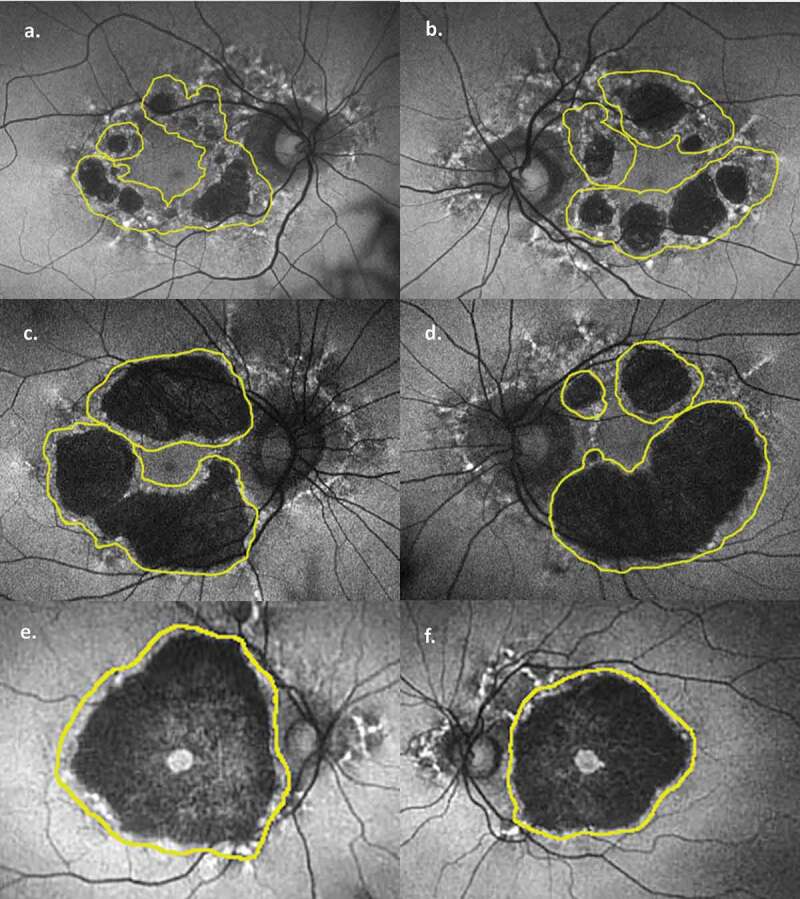
Net increase in atrophy size in patient 1 was 8.0 disc areas (3.1 initially to 11.1 at follow-up) in the right eye and 7.9 disc areas (4.8 to 12.7) in the left eye, a relative increase of 254% and 165%, respectively. Patient 2 showed net increase of 4.3 disc areas (9.4 to 13.7, 45%) and 5.5 disc areas (11.9 to 17.4, 46%), and patient 3 showed net increase of 4.3 disc areas (15.1 to 19.4, 29%) and 6.3 disc areas (16.0 to 22.3, 39%) in the right and left eyes, respectively. These changes are depicted in Figures 2 and 3. The use of image overlay qualitatively showed areas of pigment hyper-autofluorescence on initial imaging which became atrophic at the time of follow-up imaging. All areas of clearly identifiable pigment hyper-autofluorescence either remained stable (the minority) or became atrophic (the majority) – none spontaneously returned to normal retina.
Figure 2.

Combination fundus autofluorescence images. Atrophy at initial presentation (black) has been overlaid with atrophy at follow-up (red). (a) Patient 1 right eye, (b) Patient 1 left eye, (c) Patient 2 right eye, (d) Patient 2 left eye, (e) Patient 3 right eye, (f) Patient 3 right eye. Areas of hyper-autofluorescent pigment deposits (white spots) progressing to atrophy are marked by yellow arrows. Images created in Photoshop 2018 CC (Adobe Systems Incorporated, San Jose, United States).
Figure 3.

Original fundus autofluorescence images with future atrophy outlined (yellow). (a) Patient 1 right eye, (b) Patient 1 left eye, (c) Patient 2 right eye, (d) Patient 2 left eye, (e) Patient 3 right eye, (f) Patient 3 right eye. Underlying retina prior to its progression to atrophy is more easily visualised. Images created in Photoshop 2018 CC (Adobe Systems Incorporated, San Jose, United States).
Discussion
Several notable features of the MIDD maculopathy are evident from our fundus autofluorescence (FAF) images. First, there is significant progression of the disease in each patient over a 3-year period despite stable (in 5 of 6 eyes) visual acuity. To allow standardisation of measurements between time points (and to minimise error from different magnification and distortion), areas of atrophy were measured with respect to optic disc area. Both the net increase in atrophy size, and particularly the percentage increase in atrophy size, were most notable earlier in the disease. Patient 1 saw a relative increase of 254% and 165% in the right and left eyes, respectively, compared with 45% and 46%, respectively, in patient 2, and 29% and 39%, respectively, in patient 3. Patient 1 displayed no visual symptoms and had the most mild macular changes on initial imaging. Thus, there appears to be more significant progression earlier in the disease course, with some evidence of slowing as atrophy becomes more widespread. Notably, however, there was still significant expansion of atrophy in patient 3, likely heralding future foveal involvement. These changes are clearly depicted in Figure 2.
The second notable feature of our FAF images is the progression of discrete areas of pigment hyperfluorescence on initial imaging to atrophy in follow-up images. The pathogenesis of the macular dystrophy in MIDD patients is related to a disruption of oxidative phosphorylation and energy production in the highly metabolically active outer retinal layers.2,3 Early in the disease, this is characterised by hyper-reflective retinal pigment epithelium (RPE) deposits2 and thickened and disorganised outer retinal layers3 on ocular coherence tomography (OCT), which correlate to focal points of hyperfluorescence on FAF.2,3 Patients with more advanced disease show marked attenuation of both RPE and photoreceptor layers on OCT, correlating with well-defined atrophy on FAF.2,3 In our images it is possible to see this process unfold, as areas of perifoveal speckled hyperfluorescence on initial imaging are seen to give way to atrophy in follow-up images (best seen in Figure 2(a,b,d,e)). Thus, our images support a dynamic process moving from hyperfluorescent deposits to atrophy, which has been suggested but not proven previously. This progression supports the theory of de Laat et al.3, who proposed a grading system based on retinal findings, and suggested that patients may progress from a lower grade (marked by speckled pigment and FAF changes) to a higher grade (where geographic atrophy predominates). They showed a patient progressing from grade 2 to 3 after 4 years, while longer term follow-up in other studies has shown similar progression at 15 years4 and 20 years.1 This is in contrast to the report by Rath et al.5 who observed two distinct retinal phenotypes, namely discontinuous circumferential perifoveal atrophy in some (corresponding to a grade 3 or 4 in de Laat3), while others displayed a more classical pattern dystrophy with pale deposits, RPE granularity and diffuse speckled macula autofluorescence (consistent with grade 2 in de Laat.3) While we did not have any patients progressing from grade 2 to 3, other groups1,3,4 have witnessed such a progression. Thus, our images in combination with other studies suggest that the findings by Rath et al. may instead be capturing a progressive disease process at two distinct time points – one earlier and the other later – rather than two distinct phenotypes. In our patients, areas of hyperfluorescence occasionally persisted in follow-up images, but they never resolved. Conversely, some areas without hyperfluorescence also progressed to atrophy, and it is conceivable that these areas developed deposits at some point during the 3-year follow-up period. More frequent imaging would be required to confirm this. Thus, the presence of these hyperfluorescent deposits are good predictors of future atrophy at that location.
A similar progression has been identified in patients with age-related macular degeneration (ARMD), where hyperfluorescence at the border of geographic atrophy heralds new geographic atrophy at that site.6 Theories of retinal pigment epithelium (RPE) hypertrophy, subretinal RPE shedding and phagocytosis of debris including melanin have been proposed but not proven. The hyper-reflective retinal pigment epithelium (RPE) deposits2 seen in MIDD are not unlike those found in ARMD, and may suggest a similar outer retinal microenvironment and mechanism of hyperautofluorescence predicting atrophy.
FAF therefore allows assessment of disease progression in MIDD patients by monitoring the appearance, size and extent of perifoveal changes. It may conceivably predict imminent visual loss, as in a patient with hyperfluorescent deposits within the fovea suggesting impending atrophy in the same region. This is important, as patients typically maintain relatively good vision until the fovea is affected.3 Several studies have noted FAF more clearly identifies the changes in MIDD than fundus photography alone5,7, and avoids the risks associated with fluorescein angiography. Electrophysiology has shown promise, however the small areas of abnormality in MIDD are often diluted by the pan-retinal signal of full-field electroretinogram (ERG), pattern ERG and electro-oculogram, and results have been variable.3,8–10 Multi-focal ERG results are suggestive of cone outer segment dysfunction2,11, and in one of our patients this was also present. However, follow-up multifocal ERG showed progression in one eye and a marked loss of fixation in the other, highlighting the technical difficulties which make this modality less suitable for following the progression.
Conclusion
MIDD maculopathy results from dysfunctional outer retinal layers and appears to progress more rapidly earlier in the disease course. Areas of hyper-autofluorescent pigment deposits are a predictor of future atrophy at that location. We thus propose FAF as a safe and useful method for monitoring maculopathy and predicting future progression in MIDD patients.
Declaration of interest
The authors report no conflict of interest.
References
- 1.Massin P, Virally-Monod M, Vialettes B, et al. Prevalence of macular pattern dystrophy in maternally inherited diabetes and deafness. Ophthalmology. 1999;106(9):1821–1827. doi: 10.1016/s0161-6420(99)90356-1. [DOI] [PubMed] [Google Scholar]
- 2.Daruich A, Matet A, Borruat F-X.. Macular dystropht associated ith the mitochondrial DNA A3243G mutation: pericentral pigment deposits or atrophy? Report of two cases and review of the literature. BMC Ophthalmol. 2014;14:77. doi: 10.1186/1471-2415-14-77. [DOI] [PMC free article] [PubMed] [Google Scholar]
- 3.de Laat P, Smeitink JAM, Janssen MCH, Keunen JEE. Boon CJF mitochondrial retinal dystrophy associated with the m.3243A>G mutation. Ophthalmology. 2013;120(12):2684–2696. doi: 10.1016/j.ophtha.2013.05.013. [DOI] [PubMed] [Google Scholar]
- 4.Ambonville C, Meat T, Lecleire-Collet A, et al. Macular pattern dystrophy in MIDD: long-term follow-up. Diabetes Metab. 2008;34:389–391. doi: 10.1016/j.diabet.2008.05.002. [DOI] [PubMed] [Google Scholar]
- 5.Rath PP, Jenkins S, Michaelides M, et al. Characterisation of the macular dystrophy in patients with the A3243G mitochondrial DNA point mutation with fundus autofluorescence. British J Ophthalmol. 2008;92:623–629. doi: 10.1136/bjo.2007.131177. [DOI] [PMC free article] [PubMed] [Google Scholar]
- 6.Ly A, Nivison-Smith L, Assaad N, Kalloniatis M. Fundus autofluorescence in age-related macular degeneration. Optometry Vision Sci. 2017;94(2):246–257. doi: 10.1097/OPX.0000000000000997. [DOI] [PMC free article] [PubMed] [Google Scholar]
- 7.Michaelides M, Kenkins SA, Bamiou D-E, et al. Macular dystrophy associated with the A3243G mitochondrial DNA mutation. Arch Ophthalm. 2008;126:320–328. doi: 10.1001/archopht.126.3.320. [DOI] [PubMed] [Google Scholar]
- 8.Latkany P, Ciulla TA, Cucchillo P, Malkoff MD. Mitochondrial maculopathy: geographic atrophy of the macula in the MELAS Associated A to G 3243 mitochondrial DNA point mutation. Am J Ophthalmol. 1999;128:112 –114. doi: 10.1016/s0002-9394(99)00057-4. [DOI] [PubMed] [Google Scholar]
- 9.Latvala T, Mustonen E, Uusitalo R, Majamaa K. Pigmentary retinopathy in patients with the MELAS mutation 3243A—> G in mitochondrial DNA. Graef Arch Clin Exp Ophthalm. 2002;240:795–801. doi: 10.1007/s00417-002-0555-y. [DOI] [PubMed] [Google Scholar]
- 10.Smith PR, Bain SC, Good PA, et al. Pigmentary retinal dystrophy and the sydnrome of maternally inherited diabetes and deafness caused by the mitochondrial DNA 3243 tRNA(Leu) A to G mutation. Ophthalmology. 1999;106(6):1101–1108. doi: 10.1016/S0161-6420(99)90244-0. [DOI] [PubMed] [Google Scholar]
- 11.Bellmann C, Neveu MM, Scholl HPN, et al. Localized retinal electriphysiological and fundus autofluorescence imaging abnormalities in maternal inherited diabetes and deafness. Invest Ophthalmol Vis Sci. 2004;45(7):2355–2360. doi: 10.1167/iovs.03-1090. [DOI] [PubMed] [Google Scholar]


