

Abstract
Reovirus is an enteric virus comprising eight structural proteins that form a double-layered capsid. During reovirus entry into cells, the outermost capsid layer (composed of proteins σ3 and μ1C) is proteolytically processed to generate an infectious subviral particle (ISVP) that is subsequently uncoated to produce the transcriptionally active core particle. Kinetic studies suggest that protein σ3 is rapidly removed from virus particles and then protein μ1C is cleaved. Initial cleavage of μ1C has been well described and generates an amino (N)-terminal δ peptide and a carboxyl (C)-terminal φ peptide. However, cleavage and removal of σ3 is an extremely rapid event that has not been well defined. We have treated purified reovirus serotype 1 Lang virions with a variety of endoproteases. Time-course digestions with chymotrypsin, Glu-C, pepsin, and trypsin resulted in the initial generation of two peptides that were resolved in SDS–PAGE and analyzed by in-gel tryptic digestion and MALDI-Qq-TOFMS. Most tested proteases cut σ3 within a “hypersensitive” region between amino acids 217 and 238. In addition, to gain a better understanding of the sequence of subsequent proteolytic events that result in generation of reovirus subviral particles, time-course digestions of purified particles were performed under physiologic salt conditions and released peptide fragments ranging from 500 to 5000 Da were directly analyzed by MALDI-Qq-TOFMS. Trypsin digestion initially released a peptide that corresponded to the C-terminus of μ1C, followed by a peptide that corresponded to amino acids 214–236 of the σ3 protein. Other regions of μ1C were not observed until protein σ3 was completely digested. Similar experiments with Glu-C indicated the hypersensitive region of σ3 was cut first when virions were treated at pH values of 4.5 or 7.4, but treatment of virions with pepsin at pH 3.0 released different σ3 peptides, suggesting acid-induced conformational changes in this outer capsid protein. These studies also revealed that the N-terminus of σ3 is acetylated.
Introduction
A large number of viruses (e.g., caliciviruses, coronaviruses, many enteric picornaviruses, and reoviruses) are primarily transmitted from host to host by the fecal–oral route. Thus, the predominant route of host infection by such viruses is enteric. During a gastrointestinal infection, such viruses must go through the stomach and endure an acidic pH that can be as low as 0.82 (Vander et al., 1994). Successful replication of viruses, similar to other obligate intracellular pathogens, requires that the pathogenic organism gain entry into susceptible host cells. Initial steps in such a process involve recognition of the host cell by appropriate viral proteins. After attachment of the virus to a suitable receptor, the virus must be internalized. While some details of how viruses are internalized remain controversial, there is mounting evidence that entry of many viruses is mediated by conformational changes that take place in virus structural proteins. Some of these changes appear to involve exposure of the virus to acidic pH and others appear to involve proteolysis of external virion proteins White and Fenner 1994, Young 2001.
The mammalian orthoreoviruses (reovirus) are the prototypic members of the nonfusogenic Reoviridae, enteric viruses that consist of a genome of double-stranded (ds) RNA encased in multiple concentric protein capsids. Reoviruses are constructed from eight structural proteins arranged as two concentric capsids; an outer capsid that surrounds an inner capsid “core” (reviewed in Nibert and Schiff, 2001). The outer capsid is composed of up to 36 copies of the cell attachment protein σ1 (Larson et al., 1994), 600 copies of protein σ3 (Dryden et al., 1993), and 600 copies of protein μ1, which occurs in the viral capsid both as μ1 and its cleavage product μ1C (Nibert and Fields, 1992). The inner core, which is the transcriptionally active structure that produces progeny capped and methylated mRNA from the genomic dsRNA (Yeager et al., 1996), comprises two major proteins (120 copies of λ1 and 150 copies of σ2; Reinisch et al., 2000), and two minor proteins (12 copies of λ3 and about 20 copies of μ2; Coombs, 1998). Sixty copies of an additional protein (λ2) form pentameric spike structures at each of the virion’s icosahedral vertices Ralph et al 1980, Metcalf et al 1991, Dryden et al 1993 that bridge the inner and outer capsid layers.
Entry of reovirus into cells is accompanied by significant alterations in the virus outer capsid, which results in the generation of an infectious (or intermediate) subviral particle (ISVP). The virus attaches to the receptor using its cell attachment protein σ1 (Lee et al., 1981). Binding of the virion to the receptor leads to a conformational change in the viral capsid as demonstrated by reversible alterations in pepsin sensitivity (Fernandes et al., 1994). Such an altered conformational state may be necessary for viral entry and subsequent uncoating.
Once attached, the virion appears to be taken up into endosomes Borsa et al 1979, Georgi et al 1990, Rubin et al 1992. An influx of H+ ions, mediated by proton pumps present on the endosomal membrane, creates an acidic environment, which, in conjunction with the presence of acid-dependent proteases such as cathepsins Sherry et al 1996, Baer and Dermody 1997, is believed to proteolytically process the virion into subviral particles such as ISVPs. Upon exposure of the ISVP to the cytosol it is subsequently converted into the core particle. Evidence also suggests that ISVPs may be formed extracellularly by proteolysis of the virion with proteases such as pepsin in the stomach, or chymotrypsin or trypsin in the intestinal lumen Bodkin et al 1989, Vander et al 1994, and that these ISVPs can directly cross through the membrane, bypassing endocytic uptake Borsa et al 1979, Sturzenbecker et al 1987.
Proteolytic processing of the outer capsid also is achieved in vitro by treatment of virions with any of a variety of proteases, including the alkaline proteases trypsin and chymotrypsin (Joklik, 1972) and acidic proteases such as cathepsins Ebert et al 2002, Jane-Valbuena et al 2002. Such in vitro proteolysis, mediated either by trypsin or by chymotrypsin, is very rapid. Most σ3 is removed from particles within 1 min of protease treatment (Nibert et al., 1995). Thus, details of σ3 cleavage have not been completely delineated, although a region near amino acid residues 210–242 was very recently shown to initially be cleaved by various alkaline and acidic proteases Ebert et al 2002, Jane-Valbuena et al 2002. Subsequent cleavage of σ3, which appears to be a prerequisite for removal of this protein from the particle and conversion of the virion into the ISVP (Jane-Valbuena et al., 2002), has not yet been defined.
To delineate early steps in virus entry mediated by outer capsid proteolysis, we have determined the kinetics of σ3 digestion in purified intact reovirus type 1 Lang virions. Virions were digested with various proteinases for various periods of time. Products then were analyzed by matrix-assisted laser desorption ionization quadrupole/time-of-flight mass spectrometry (MALDI-Qq-TOFMS). These studies indicate the σ3 hypersensitive region is initially cut by a large number of endoproteases under a wide range of pH conditions (from acidic to neutral), the nature of the blocking group at the N-terminus of σ3, and the sequence and kinetics of σ3 proteolysis during subsequent virion uncoating events.
Results
Proteolysis of reovirus virions alters outer capsid proteins σ3 and μ1 to generate subviral particles
Treatment of purified reovirus virions with 200 μg/ml α-chymotrypsin, conditions generally used for in vitro generation of subviral particles such as the ISVP and core Joklik 1972, Coombs 1998, resulted in the rapid removal of σ3 protein from virions (Fig. 1A). Other reports indicate similar results are obtained when virions are treated with similar concentrations of trypsin (Nibert et al., 1995). In each of these studies, all detectable σ3 was digested within 1–2 min. Under these conditions, digestion of μ1C into δ and φ occurs shortly after σ3 has been removed, implying that σ3 occupies an outermost layer within the virus particle that covers accessible sites in μ1C, consistent with structural interpretations from electron cryomicroscopic (Dryden et al., 1993) and X-ray crystallographic (Liemann et al., 2002) image reconstructions.
Fig. 1.
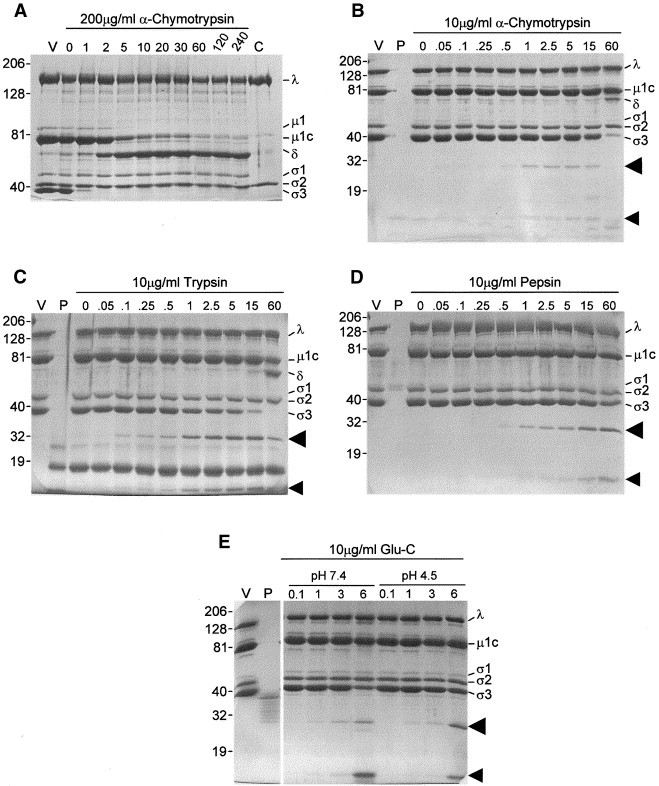
Kinetics of virus digestion. Aliquots of gradient-purified T1L virions were diluted to concentrations of 7.3–8.6 × 10¹¹ particles/μl in appropriate buffers (pH 7.4 for α-chymotrypsin, trypsin, and S. aureus V8 (Glu-C); or pH 4.5 for Glu-C; or pH 3.0 for pepsin), digested with either (A) 200 μg/ml α-chymotrypsin, or (B) 10 μg/ml α-chymotrypsin, (C) 10 μg/ml trypsin, (D) 10 μg/ml pepsin, or (E) 10 μg/ml Glu-C for the indicated periods of time (minutes for (A–D); hours for (E)) at 37°C. Reactions were stopped by chilling and addition of phenylmethylsulfonyl fluoride to a final concentration of 5 mM to α-chymotrypsin reactions, by addition of soybean trypsin inhibitor to a final concentration of 125 μg/ml to trypsin reactions, by adjustment of pepsin reactions to a pH of 7.5, or by chilling Glu-C reactions. One-quarter volume of 5× electrophoresis sample buffer was added and peptides from about 1 × 10¹¹ particles were resolved in either a 4–16% exponential gradient (A) or a 6–16% linear gradient (B–E) mini-SDS–PAGE (8 × 10 × 0.04 cm) at 150–180 V for 60 min. Gels were fixed and stained with Coomassie brilliant blue R-250. V: gradient-purified virions; P: 150 ng of indicated protease; C: gradient-purified core particles, separately prepared. Molecular weights, determined from coelectrophoresis of Kaleideoscope Rainbow Marker, are indicated to left of each gel. Virion proteins (λ, μ, and σ1–σ3), μ1C digestion product δ, and potential σ3 digestion products (indicated by arrowheads) are indicated to the right of each gel.
Reovirus outer capsid virion protein σ3 is initially cut by a variety of proteases in one region
To slow the digestion of σ3 and attempt to identify regions of outer capsid protein σ3 that are initially cut, and presumably exposed on the surface of the intact virion, we then digested highly purified virions with a significantly lower amount of enzyme for shorter and comparable amounts of time and analyzed resulting products. Treatment of virions with 10 μg/ml α-chymotrypsin at 37°C for as little as 6 s resulted in the appearance of two smaller polypeptides with apparent molecular weights of 27 and 12.5 kDa, as resolved in SDS–PAGE (Fig. 1B, arrowheads). The sum of these two polypeptide fragment molecular weights is close to the molecular weight of the 41 kDa σ3 protein, suggesting the two peptides result from a single cleavage of the protein. Longer digestions lead to the appearance of additional smaller peptides and the eventual generation of a peptide profile similar to that of ISVPs (Fig. 1B, rightmost lane). Treatment of purified virions with low concentrations of other proteases (trypsin, Glu-C, and pepsin) at various pH values for suitable periods of time also led to the generation of two polypeptides (Fig. 1C–E, arrowheads), whose aggregate molecular weights added to about 41 kDa. To identify each of the polypeptides generated by each of the proteases and determine precisely where σ3 was cut by each of them, we resolved larger aliquots of briefly digested virions in preparative gels, excised the 27- and 12.5-kDa bands, and subjected each to in-gel tryptic digestion. Digests then were extracted from the gel matrix as described under materials and methods and examined by MALDI-Qq-TOFMS (i.e., peptide mass mapping) (Fig. 2B–E). All peaks detected were checked against a database of predicted σ3 and trypsin peptide masses to assign peaks to appropriate σ3 peptides (Table 1) and the amino acid sequences of some peaks were examined by tandem mass spectrometry to corroborate amino acid assignments. For each of the larger 27-kDa polypeptides, we were able to identify a number of σ3 peptides, including those corresponding to amino acids 23–34, 123–143, and 203–208 (Fig. 2F, bars above sequence scale line). Each of the smaller 12.5-kDa polypeptides contained several σ3 peptides, including those corresponding to amino acids 248–259, 297–310, and 313–326 (Fig. 2F, bars below sequence line). In addition, depending upon the initial protease used prior to gel purification, additional tryptic fragments were identified that allowed us to determine the exact cleavage sites used by each protease. For example, the large 27-kDa polypeptide generated by chymotrypsin digestion contained a tryptic fragment with an m/z value of 2918.359, predicted to correspond to amino acids 214–238 and the small 12.5-kDa polypeptide contained a tryptic fragment with an m/z value of 1069.657, predicted to correspond to amino acids 239–247. In addition, the large 27-kDa polypeptide contained no tryptic fragments that would correspond to amino acids from residue 239 to the C-terminus and the small 12.5-kDa polypeptide contained no tryptic fragments that would correspond to amino acids from the N-terminus to residue 238. Analyses of these fragments accounted for 220 of the 365 predicted amino acids in σ3 (60.3% coverage). We initially did not observe fragments that would correspond to either the N-terminus (residues 1–22) or the C-terminus (348–365). However, these terminal fragments were detected in direct MALDI-Qq-TOFMS measurements of longer digestions (below), suggesting they were present within the 27- and 12.5-kDa polypeptides but not effectively eluted from the gel matrix. Taken together, these observations indicate that the initial cut made in σ3 by α-chymotrypsin occurs between Tyr238 and Arg239 (Fig. 2G, H), also as very recently determined (Jane-Valbuena et al., 2002). The identities of many of these tryptic fragments were corroborated by tandem mass spectrometry (MS) (see below). Similar analyses of the large and small peptides generated by other proteases indicated that trypsin cut predominantly between Arg236 and Ala237, although, in a small proportion of σ3 molecules, the initial trypsin cut was between Arg259 and Ala260 (which is consistent with the appearance of a doublet in the gel (Fig. 2A)), and Glu-C cut predominantly between Glu217 and Trp218, irrespective of whether the reaction was performed at pH values of 7.4 or pH 4.5, which is consistent with the slightly faster migration of the Glu-C-generated large peptides (Fig. 2A). There were some differences in the distribution of tryptic peptides identified after Glu-C digestion under different pH conditions, suggesting some minor acid-induced conformational changes in σ3. No peaks corresponding to amino acids C-terminal of residue 214 were found in the 27-kDa polypeptide generated by Glu-C digestion at pH 7.4 (Table 1). However, small peaks corresponding to tryptic fragments 214–236 (m/z 2647.335) and 209–236 (m/z 3290.522) were observed in spectra generated from 27-kDa polypeptides purified after Glu-C digestion at pH 4.5 (Table 1), suggesting that, in some particles treated at this acidic pH, Glu-C cut between Glu241 and Leu242. Analyses of tryptic fragments in the large and small pepsin-generated peptides indicated that this protease initially cut σ3 at one of two possible sites, and with apparently nearly equal efficiency. Thus, some σ3 molecules were initially cut between Ala237 and Tyr238, whereas other σ3 molecules were cut between Thr244 and Pro245.
Fig. 2.
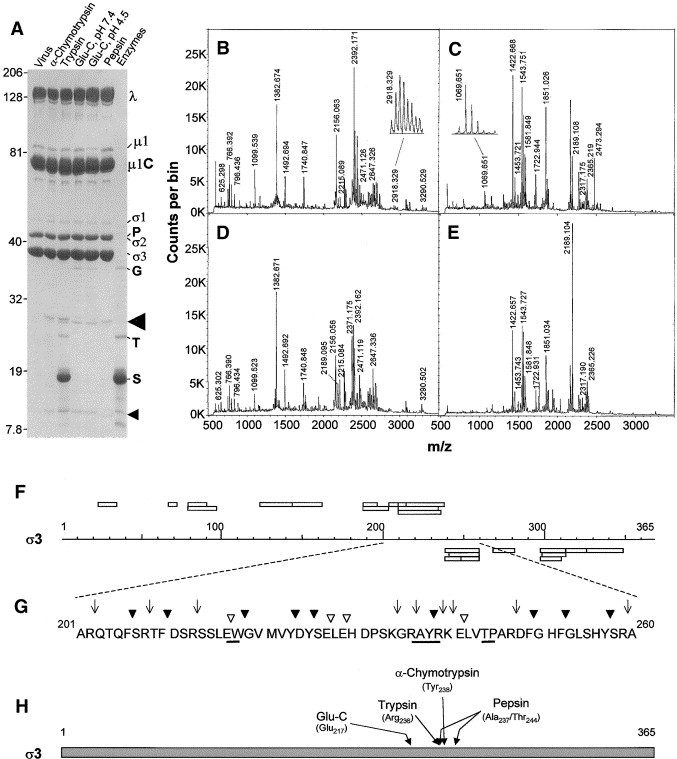
Identification of large and small σ3 peptide fragments. (A) Electrophoretic separation of 2.5 × 10¹¹ virions digested with 10 μg/ml of indicated proteases for 30 s (α-chymotrypsin, trypsin, and pepsin) or for 1.5 h (Glu-C) and resolved in a 6–16% linear gradient SDS–PAGE (16 × 16 × 0.1 cm) at 6.0 W for 5 h. Molecular weights, determined from coelectrophoresis of Kaleidoscope Rainbow Marker, are indicated to left of gel. Virion proteins, enzymes (∼250 ng), and inhibitors (P: pepsin; G: Glu-C; T: trypsin/chymotrypsin; S: soybean trypsin inhibitor), and potential σ3 digestion products (indicated by arrowheads and subsequently analyzed by mass spectrometry) are indicated to right of gel. (B–E) MALDI-Qq-TOF mass spectra obtained from tryptic in-gel digestions of (B) α-chymotrypsin-generated large fragment (indicated by large arrow head in A), (C) α-chymotrypsin-generated small fragment (indicated by small arrow head in A), (D) trypsin-generated large fragment, and (E) trypsin-generated small fragment. Values above peaks indicate measured m/z values of peaks identified as corresponding to virion protein σ3 (shown in Table 1). Peak in B with m/z value of 2918.329 (subsequently shown to correspond to amino acid sequence 214–238) and peak in c with m/z value of 1069.651 (subsequently shown to correspond to amino acid sequence 239–247) are expanded in insets. (F) Diagrammatic representation of strategy to determine where each protease initially cleaves virion-associated σ3. Rectangles above sequence scale correspond to MS-predicted tryptic fragments found in large (∼27-kDa polypeptide) and rectangles below sequence scale correspond to MS-predicted tryptic fragments found in small (∼12.5-kDa polypeptide) as listed in Table 1. (G) Detailed sequence of σ3 protein between amino acid residues 201 and 260, indicating potential cleavage sites for trypsin (▿), α-chymotrypsin (▾), and Glu-C (↓). Underline corresponds to cleavage sites identified as initially used. (H) Diagrammatic representation of entire σ3 protein with initial cleavage sites of tested proteases indicated.
Table 1.
Tryptic peptides identified in 27- and 12.5-kDa fragments after brief digestion of σ3 with indicated proteases
| σ3 Sequence assignment | Observed mass |
Calculated mass | Δ(Da)a | ||||
|---|---|---|---|---|---|---|---|
| Chymotrypsin | Trypsin | Glu-C, pH 7.4 | Glu-C, pH 4.5 | Pepsin | |||
| Tryptic fragments found in large peptides | |||||||
| Tryptic fragments found in all protease digests | |||||||
| 203–208 | 766.392 | 766.390 | 766.386 | 766.385 | 766.399 | 766.385 | ±0.014 |
| 67–72 | 796.437 | 796.434 | 796.420 | 796.432 | 796.437 | 796.433 | ±0.013 |
| 187–196 | 1099.540 | 1099.537 | 1099.527 | 1099.524 | 1099.548 | 1099.528 | ±0.020 |
| 23–34 | 1382.675 | 1382.671 | 1382.651 | 1382.666 | 1382.683 | 1382.659 | ±0.024 |
| 79–90 | 1492.701 | 1492.692 | 1492.702 | 1492.687 | 1492.701 | 1492.682 | ±0.020 |
| 187–202 | 1740.849 | 1740.848 | 1740.843 | 1740.838 | 1740.850 | 1740.841 | ±0.009 |
| Tryptic fragments found in some protease digests | |||||||
| 209–213 | 625.298 | 625.302 | 625.298 | 625.303 | 625.294 | ±0.009 | |
| 237–244 | 979.571 | 979.560 | ±0.011 | ||||
| 144–162 | 2156.064 | 2156.059 | 2156.050 | ±0.014 | |||
| 241–259 | 2189.095b | 2189.088 | ±0.008 | ||||
| 79–96 | 2215.023 | 2215.084 | 2215.075 | 2215.068 | ±0.045 | ||
| 79–97 | 2371.176 | 2371.179 | 2371.165 | 2371.169 | ±0.010 | ||
| 123–143 | 2392.177 | 2392.165 | 2392.164 | 2392.186 | 2392.160 | ±0.026 | |
| 214–234 | 2471.126 | 2471.119 | 2471.123 | 2471.150 | 2471.107 | ±0.043 | |
| 214–236 | 2647.326 | 2647.337 | 2647.335b | 2647.344 | 2647.329 | ±0.015 | |
| 214–237 | 2755.289 | 2755.270 | ±0.019 | ||||
| 214–238 | 2918.359 | 2918.330 | ±0.029 | ||||
| 209–236 | 3290.539 | 3290.502 | 3290.522b | 3290.505 | ±0.034 | ||
| Tryptic fragments found in small peptides | |||||||
| Tryptic fragments found in all protease digests | |||||||
| 248–259 | 1422.669 | 1422.657 | 1422.668 | 1422.653 | 1422.653 | 1422.655 | ±0.014 |
| 268–281 | 1453.751 | 1453.743 | 1453.753 | 1453.746 | 1453.742 | 1453.743 | ±0.010 |
| 313–326 | 1542.729 | 1542.727 | 1542.734 | 1542.729 | 1542.714 | 1542.716 | ±0.018 |
| 297–310 | 1581.852 | 1581.850 | 1581.820 | 1581.836 | 1581.833 | 1581.838 | ±0.018 |
| 297–312 | 1851.037 | 1851.034 | 1850.996 | 1851.019 | 1851.022 | 1851.023 | ±0.027 |
| 327–348 | 2365.230 | 2365.226 | 2365.201 | 2365.224 | 2365.215 | 2365.214 | ±0.016 |
| Tryptic fragments found in some protease digests | |||||||
| 239–247 | 1069.657 | 1069.648 | ±0.009 | ||||
| 249–259 | 1307.633 | 1307.637 | 1307.636 | 1307.628 | ±0.009 | ||
| 298–312 | 1722.944 | 1722.931 | 1722.925 | 1722.935 | 1722.928 | ±0.016 | |
| 245–259 | 1746.852 | 1746.850 | ±0.002 | ||||
| 241–259 | 2189.114 | 2189.107 | 2189.091 | 2189.088 | ±0.026 | ||
| 240–259 | 2317.190 | 2317.190 | 2317.183 | ±0.007 | |||
| 239–259 | 2473.294 | 2473.284 | ±0.010 | ||||
| 238–259 | 2636.351 | 2636.348 | ±0.003 | ||||
Values represent total range between five treatments.
Indicated peak present in very low quantity.
Kinetic digestion analyses of reovirus outer capsid proteins σ3 and μ1c
Major advantages of the MALDI-Qq-TOFMS include the capacity to rapidly analyze complex mixtures of peptides in physiologic salt solutions without the need for additional purification methodologies which might lead to sample loss. In addition, whereas gel analyses required visualization of nanogram quantities of peptide, the approximately 100-fold greater sensitivity of the MALDI-Qq-TOFMS instrument might reveal early rare events undetectable by SDS–PAGE strategies. Thus, to perform more complete analyses of the cascade of proteolytic events that take place in multiple viral capsid proteins during digestion with various proteases at different pH values, we treated purified reovirus particles with proteases used above and analyzed released peptide fragments directly by MALDI-Qq-TOFMS at a variety of time intervals. We initially chose trypsin to study early proteolysis of surface-exposed epitopes at neutral pH because of the relatively large number of arginine and lysine residues in most reovirus capsid proteins. For these studies it also was important to maintain viral structural integrity. Preliminary MS experiments tested various buffer solutions. Reovirus virion particles were unstable in ammonium bicarbonate solution (normally suitable for MALDI analysis; data not shown), but virion structure was retained in Tris–HCl buffer with physiologic concentrations of salts (normally too high for MS analyses). To simplify MS analyses, controlled experiments examined the amount of signal noise normally caused by salts in the mass spectra of virus digests by comparing spectra generated from virus alone, protease alone, and virus plus protease in buffers of various ionic strength. In addition, true peptide fragments appeared with increasing intensities during longer digestion times, and individual peaks were subsequently identified by MS/MS measurements. Initial analyses of a complete tryptic digest of reovirus serotype 1 Lang (T1L) virions allowed subsequent identification of the major outer capsid proteins σ3 and μ1, and the core proteins λ1, λ2, and σ2 (data not shown). Identities of all peaks resolved in this initial tryptic digest spectrum were corroborated by tandem MS and used as reference for amino acid assignments in this study.
Representative spectra, which resulted from digestion of 5 mg/ml T1L virus with 5 μg/ml trypsin at pH 7.4 for short periods of time, are shown in Fig. 3. NCBI and SwissPro database searches of peak masses and subsequent MS/MS analyses of selected peaks against all available viral and nonviral proteins led to the identification of indicated σ3 and μ1 peptides. Results are summarized in Table 2. Examination of peptide fragments released during shorter digestion periods predicted that the first peptide released from σ3, at 90 s, with an m/z value of 2684.226, corresponded to residues Ser214-Arg236 (predicted m/z value of 2684.230) (Table 2A). The low-energy MS/MS spectrum of this ion revealed a set of b and y ions shown in Fig. 4A. The b and y ion “ladder” corresponds to the predicted sequence of the Ser214-Arg236 fragment. With increased digestion times, additional peptides that corresponded to regions immediately N-terminal of, and C-terminal of the Ser214-Arg236 peptide, were identified (Fig. 5A and Table 2A) and confirmed by MS/MS (data not shown). Peptides corresponding to virtually the entire σ3 protein sequence were identified within 10 min of digestion (Fig. 5A and Table 2A), further attesting to the rapid removal of this protein from virions during proteolytic digestion. A peptide corresponding to the N-terminus of protein σ3 was not initially identified by a direct database search with MS-Tag, but a major unidentified peak at m/z 2511.2 was observed.
Fig. 3.
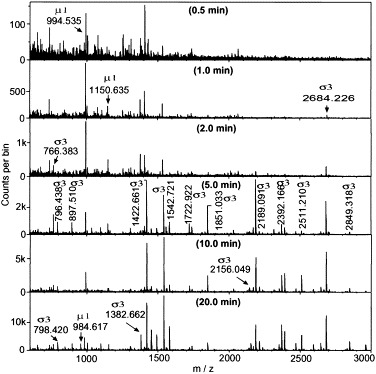
Peptide mapping of tryptic T1L virion digests. 5 mg/ml purified T1L virions were digested with 5 μg/ml trypsin at 37°C. At various time intervals, aliquots were collected and analyzed by MALDI-Qq-TOFMS. Each peak was then selected and subjected to MS/MS analysis (see Fig. 4) to identify each peptide fragment (compiled in Table 2A). Each peak is labeled in the time frame at which it is first detected.
Table 2.
Peptide fragments generated from a time-course digestion of T1L virions
| Time (min) | σ3 | m/z (Obs.) | m/z (Calc.) | μl | m/z (Obs.) | m/z (Calc.) |
|---|---|---|---|---|---|---|
| A: Tryptic fragments (pH 7.4)a | ||||||
| 0.5 | — | — | — | 695–703 | 994.535 | 994.532 |
| 1.0 | — | — | — | 695–704 | 1150.635 | 1150.633 |
| 1.5 | 214–236 | 2684.226 | 2684.230 | — | — | — |
| 2.0 | 203–208 | 766.383 | 766.385 | — | — | — |
| 2.5 | — | — | — | — | — | — |
| 3.0 | 209–213 | 625.290 | 625.295 | — | — | — |
| 248–259 | 1422.661 | 1422.655 | — | — | — | |
| 241–259 | 2189.091 | 2189.089 | — | — | — | |
| 5.0 | 1–22b | 2511.210 | 2469.202 | — | — | — |
| 67–72 | 796.438 | 796.433 | — | — | — | |
| 79–90 | 1492.692 | 1492.682 | — | — | — | |
| 91–97 | 897.510 | 897.506 | — | — | — | |
| 79–97 | 2371.167 | 2371.170 | — | — | — | |
| 73–97 | 3113.515 | 3113.524 | — | — | — | |
| 98–122 | 2849.318 | 2849.321 | — | — | — | |
| 123–143 | 2392.166 | 2392.161 | — | — | — | |
| 187–196 | 1099.538 | 1099.528 | — | — | — | |
| 187–202 | 1740.846 | 1740.842 | — | — | — | |
| 209–236 | 3290.496 | 3290.506 | — | — | — | |
| 240–259 | 2317.191 | 2317.184 | — | — | — | |
| 241–259 | 2189.091 | 2189.089 | — | — | — | |
| 248–259 | 1422.661 | 1422.655 | — | — | — | |
| 268–281 | 1455.686 | 1455.680 | — | — | — | |
| 297–310 | 1581.841 | 1581.839 | — | — | — | |
| 297–312 | 1851.033 | 1851.024 | — | — | — | |
| 298–312 | 1722.922 | 1722.929 | — | — | — | |
| 313–326 | 1542.721 | 1542.716 | — | — | — | |
| 10.0 | 23–63 | 4326.029 | 4326.031 | — | — | — |
| 35–63 | 2962.389 | 2962.390 | — | — | — | |
| 98–120 | 2594.166 | 2594.151 | — | — | — | |
| 144–162 | 2156.049 | 2156.051 | — | — | — | |
| 327–365 | 4199.064 | 4199.083 | — | — | — | |
| 20.0 | 282–287 | 798.420 | 798.422 | 235–243 | 984.617 | 984.621 |
| 23–34 | 1382.662 | 1382.659 | — | — | — | |
| 214–234 | 2471.119 | 2471.108 | — | — | — | |
| 25.0 | 163–186 | 2873.360 | 2873.368 | — | — | — |
| B: Glu-C digested fragments (pH 7.4)a | ||||||
| 0.5 | — | — | — | — | — | — |
| 1.0 | — | — | — | — | — | — |
| 1.5 | — | — | — | — | — | — |
| 2.0 | — | — | — | — | — | — |
| 2.5 | — | — | — | 513–525 | 1374.728 | 1374.716 |
| 3.0 | — | — | — | — | — | — |
| 5.0 | 199–217 | 2188.044 | 2188.038 | — | — | — |
| 10.0 | — | — | — | — | — | — |
| 20.0 | 228–241 | 1685.878 | 1685.872 | — | — | — |
| 230–241 | 1443.750 | 1443.746 | — | — | — | |
| 30.0 | 21–30 | 1109.565 | 1109.559 | 137–153 | 1923.929 | 1923.916 |
| 50.0 | 3–20 | 1995.994 | 1995.996 | — | — | — |
| Time (min) | Glu-C (pH 4.5) | Pepsin (pH 3.0)a | ||||
| σ3 | m/z (Obs.) | m/z (Calc.) | σ3 | m/z (Obs.) | m/z (Calc.) | |
| C: Glu-C and pepsin digested fragments (pH 4.5 and 3.0) | ||||||
| 0.5 | — | — | — | — | — | — |
| 1.0 | — | — | — | — | — | — |
| 1.5 | — | — | — | 111–128 | 1958.942 | 1958.942 |
| 2.0 | — | — | — | 195–206 | 1419.741 | 1419.734 |
| 2.5 | — | — | — | 142–154 | 1573.778 | 1573.776 |
| 142–159 | 2115.057 | 2115.051 | ||||
| 3.0 | — | — | — | 27–42 | 1763.804 | 1763.791 |
| — | — | — | 245–265 | 2343.204 | 2343.200 | |
| — | — | — | 295–309 | 1708.903 | 1708.913 | |
| — | — | — | 343–357 | 1735.783 | 1735.789 | |
| 5.0 | 199–217 | 2188.036 | 2188.038 | Too many | ||
| 10.0 | — | — | — | |||
| 20.0 | 228–241 | 1685.873 | 1685.872 | |||
| 230–241 | 1443.740 | 1443.746 | ||||
| 30.0 | 21–30 | 1109.550 | 1109.559 | |||
| 50.0 | 3–20 | 1995.994 | 1995.996 | |||
| 60.0 | — | — | — | |||
| 120.0 | 176–198 | 2619.241 | 2619.245 | |||
| 301–309 | 998.464 | 998.470 | ||||
Assignments of all peaks corroborated by tandem MS.
Acetylation at the N-terminus.
Fig. 4.
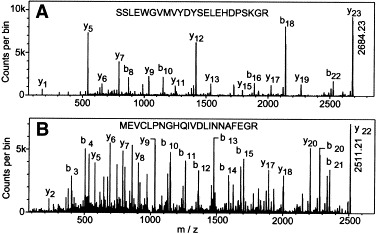
MS/MS spectra of selected tryptic ions. (A) The mass spectrum of the first tryptic ion detected, at m/z 2684.23, was acquired at a laser repetition rate of 7 Hz. The ion was dissociated using argon as the collision gas. The collision energy was set to 140 eV and then slightly adjusted to obtain optimum fragmentation of the parent ion. Spectra data acquisition was performed using software developed in-house (Tofma, University of Manitoba, MB). Sequence analysis indicates the ion corresponds to σ3 peptide 214–236. (B) The mass spectrum of the ion at m/z 2511.21 was acquired and dissociated as above. Sequence analysis indicates the N-terminal acetylation of σ3 peptide 1–22.
Fig. 5.
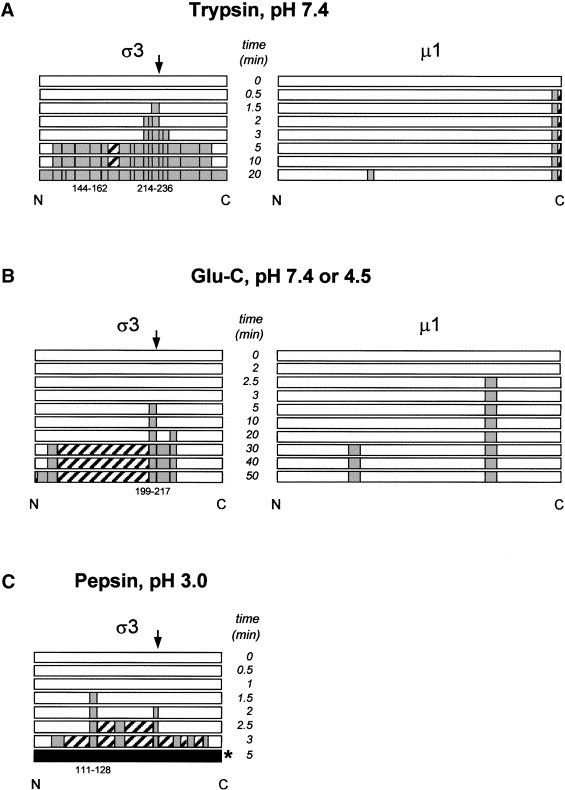
Diagrammatic representation of time-course enzymatic digests of σ3 and μ1 outer capsid proteins. (A) Time-course digestion of T1L σ3 and μ1 by trypsin at pH 7.4. (B) Time-course digestion of T1L σ3 and μ1 by Glu-C at pH 7.4 or 4.5 (results identical at both pH values). (C) Time-course digestion of T1L σ3 by pepsin at pH 3.0. White bar: undigested protein; gray bar: peptides identified by MS or MS/MS; hatched bar: nonidentified peptides; black bar: too many fragments to identify. Initial peptides cleaved are indicated with numbers below bars, with the exception of 144–162 in A (see Discussion).
The predicted N-terminal tryptic peptide of σ3 consisting of amino acid residues 1–22 has a calculated m/z value of 2469.202 that was absent in the mass spectrum (Fig. 3). This could indicate that the N-terminal portion of σ3 remains attached to particles or that this peptide may be modified in such a way that its mass is different from that predicted. The low-energy MS/MS spectrum of the ion at 2511.21 revealed a set of b and y ions shown in Table 3A, corresponding to the N-terminal peptide 1–22 of σ3. The masses of all b′n fragment ions and the parent ion (y′22) are 42.010 Da more than the calculated values, indicating the N-terminal methionine residue of σ3 was modified by acetylation.
Table 3.
Comparison of MS/MS fragmentation of selected ions with calculated mass values
| b ion | m/z (Obs.) | MH+ (Calc.) | Δ (Da) | y ion | m/z (Obs.) | MH+ (Calc.) | Δ (Da) |
|---|---|---|---|---|---|---|---|
| A: MS/MS comparison of tryptic ion at m/z 2511.21 with mass values calculated assuming an acetylated N-terminus indicates residues 1–22: MEVCLPNGHQIVDLINNAFEGR | |||||||
| b′1 | — | 174.059 | — | y1 | 175.116 | 175.120 | −0.004 |
| b′2 | 303.098 | 303.101 | −0.003 | y2 | 232.140 | 232.141 | −0.001 |
| b′3 | 402.170 | 402.170 | 0.000 | y3 | 361.180 | 361.184 | −0.004 |
| b′4 | 505.179 | 505.179 | 0.000 | y4 | — | 508.252 | — |
| b′5 | 618.272 | 618.263 | +0.009 | y5 | 579.293 | 579.289 | +0.004 |
| b′6 | — | 715.316 | — | y6 | 693.332 | 693.332 | 0.000 |
| b′7 | — | 829.359 | — | y7 | 807.371 | 807.375 | −0.004 |
| b′8 | 886.387 | 886.380 | +0.007 | y8 | 920.458 | 920.459 | −0.001 |
| b′9 | 1023.439 | 1023.439 | 0.000 | y9 | 1033.541 | 1033.543 | −0.002 |
| b′10 | 1151.488 | 1151.498 | −0.010 | y10 | 1148.565 | 1148.570 | −0.005 |
| b′11 | 1264.581 | 1264.582 | −0.001 | y11 | 1247.636 | 1247.638 | −0.002 |
| b′12 | 1363.661 | 1363.650 | +0.011 | y12 | 1360.724 | 1360.723 | +0.001 |
| b′13 | 1478.672 | 1478.677 | −0.005 | y13 | 1488.775 | 1488.781 | −0.006 |
| b′14 | 1591.769 | 1591.761 | +0.008 | y14 | 1625.828 | 1625.840 | −0.012 |
| b′15 | 1704.854 | 1704.845 | +0.009 | y15 | 1682.871 | 1682.862 | +0.009 |
| b′16 | 1818.902 | 1818.888 | +0.014 | y16 | — | 1796.905 | — |
| b′17 | 1932.936 | 1932.931 | +0.005 | y17 | 1893.946 | 1893.957 | −0.011 |
| b′18 | 2003.974 | 2003.969 | +0.005 | y18 | 2007.027 | 2007.041 | −0.014 |
| b′19 | 2151.048 | 2151.037 | +0.011 | y19 | 2110.040 | 2110.051 | −0.011 |
| b′20 | 2280.074 | 2280.079 | −0.005 | y20 | 2209.119 | 2209.119 | 0.000 |
| b′21 | 2337.108 | 2337.101 | +0.007 | y21 | — | 2338.161 | — |
| b′22 | 2493.205 | 2493.202 | +0.003 | y′22 | 2511.210 | 2511.212 | −0.002 |
| B: MS/MS comparison of pepsin ion at m/z 1419.74 indicates residues 195–206: VRLEGDARQTQF | |||||||
| b1 | — | 100.076 | — | y1 | — | 166.087 | — |
| b2 | 256.178 | 256.177 | 0.001 | y2 | — | 294.145 | — |
| b3 | 369.257 | 369.261 | −0.004 | y3 | — | 395.193 | — |
| b4 | 498.301 | 498.304 | −0.003 | y4 | — | 523.252 | — |
| b5 | — | 555.326 | — | y5 | 679.354 | 679.353 | 0.001 |
| b6 | 670.351 | 670.352 | −0.001 | y6 | 750.393 | 750.390 | 0.003 |
| b7 | — | 741.390 | — | y7 | — | 865.417 | — |
| b8 | 897.495 | 897.491 | 0.004 | y8 | 922.425 | 922.438 | −0.013 |
| b9 | 1025.556 | 1025.549 | 0.007 | y9 | — | 1051.481 | — |
| b10 | 1126.591 | 1126.597 | −0.006 | y10 | 1164.561 | 1164.565 | −0.004 |
| b11 | 1254.649 | 1254.656 | −0.007 | y11 | — | 1320.666 | — |
| b12 | 1401.716 | 1401.724 | −0.008 | y12 | 1419.738 | 1419.734 | 0.004 |
Inspection of additional trypsinization time points indicated that the C-terminal peptide of the μ1/μ1C protein at m/z 994.535, corresponding to amino acid residues 695–703 (and confirmed by MS/MS), was released within 30 s of digestion, 60 s before the detection of the first σ3 peptide (Fig. 3, Fig. 5). Other μ1/μ1C peptides were not detected until 20 min after trypsinization, 10 min after σ3 had been nearly completely digested and removed from particles (Fig. 3, Fig. 5, and Table 2).
Similar experiments also were performed on purified T1L virions with another protease at neutral pH, and the released peptide fragments identified by MALDI-Qq-TOFMS (Table 2 and Fig. 5). Treatment of virions at pH 7.4 with Glu-C, which preferentially cleaves after glutamate residues, resulted in initial liberation of a σ3 peptide corresponding to Gly199-Asp217, followed by subsequent release of peptides N-terminal and C-terminal to that peptide. Similar to results obtained with trypsin, treatment of purified reovirus virions with Glu-C resulted in digestion of μ1 before digestion of σ3. However, Glu-C digestion initially generated a peptide fragment at m/z 1374.716, which corresponds to residues 513–525 within μ1 (Table 2 and Fig. 5B). This, as well as all indicated Glu-C peptide fragment assignments (Table 2), were confirmed by MS/MS.
Digestion of σ3 under acidic conditions
As indicated earlier, there were subtle differences in the identities of some detected tryptic peptides after Glu-C digestion was performed at either pH 7.4 or 4.5 (Table 1, compare columns 4 and 5). Entry of reovirus is thought to involve conformational changes associated with acidic treatment prior to proteolysis. Therefore, we also examined proteolysis of purified virions at low pH. Samples of purified T1L virions were adjusted to pH 3.0 or 4.5 and then digested with pepsin or Glu-C, respectively, at 37°C. Equivalent aliquots were removed at various time points ranging from 30 s to 24 h. Digestions were inhibited with the immediate addition of 10 mM Tris pH 7.4 to pepsin-digested samples (confirmed to raise the pH sufficiently to irreversibly inhibit the enzyme), or by the addition of 0.1% trifluoroacetic acid (TFA) to Glu-C-digested samples. Digestion products were analyzed by MALDI-Qq-TOFMS. All Glu-C peptides were identified by peptide mapping and high-accuracy mass measurements to allow direct comparison to corresponding peaks previously identified by peptide mapping and MS/MS measurements of the pH7.4 Glu-C-treated samples (above), whereas all identified pepsin fragments were sequenced with MS/MS analysis because of pepsin’s nonspecific cleavage. For example, the low-energy MS/MS spectrum of the second ion detected after pepsin digestion (at m/z 1419.741) revealed a set of b and y ions shown in Table 3B, corresponding to amino acids 195–206. Results of both acidic digestions are summarized in Table 2C. The first peak identified after digestion of intact virions with Glu-C at pH 4.5 corresponds to σ3 amino acids Gly199-Asp217, the same peptide initially released by this protease at pH 7.4. However, the first peptide identified after pepsin digestion of virions at pH 3.0 corresponded to amino acids Asn111-Leu128 in σ3. This pepsin-digested fragment is about 100 residues closer to the N-terminus than where trypsin and Glu-C originally cleaved at pH values of 4.5 and 7.4, suggesting a conformational change in σ3 had taken place as a result of the more acidic treatment (Table 2 and Fig. 5).
To determine whether the different peptides released by proteolysis at pH 3.0 were a result of virus dissociation at low pH, purified virions were adjusted to pH 3.0, maintained at that pH for various periods of time up to 1 h, and examined by electron microscopy. Reovirus virions maintained at pH 3.0 for as much as 60 min appeared fully intact (data not shown), in agreement with previous data showing no change in morphology and no loss of infectivity after exposure of virions to pH 2.0 Stanley 1967, Fields and Eagle 1973. This suggests that release of a different initial peptide after proteolysis at pH 3.0 as compared to proteolysis at higher pH values is not the result of acid-induced global viral capsid disassociation.
Structural localization of σ3 peptides in virions
The available X-ray crystallographic structures of the σ3 dimer (Olland et al., 2001) and σ3/μ1 heterohexamer (Liemann et al., 2002) were analyzed and manipulated with the computer-based programs RasMol 2.7.1. (Bernstein and Sons, Belport, NY), PyMOL (DeLano, 2002), and Molscript (Kraulis, 1991) to determine where each of the tested proteases initially cut σ3 within the virus and where each initially released peptide is located. The initial α-chymotrypsin cleavage site (Tyr238), trypsin cleavage site (Arg236), and pepsin cleavage sites (Ala237) are located most distally in the σ3 protein (Fig. 6A, C, and D) at the top of the σ3/μ1 heterohexamer (Fig. 7). In addition, pepsin fragment Asn111-Leu128 is located at the top of the molecule but constitutes a separate group of amino acids (Fig. 6, Fig. 7). Glu-C fragment Gly199-Asp217 is located on a different surface of the protein and the initial site cut by Glu-C (Asp217) is located well down the side of the σ3 molecule (Fig. 6, Fig. 7).
Fig. 6.
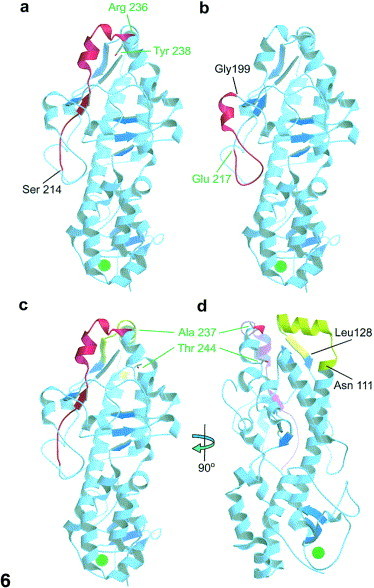
X-ray crystallographic structure of the σ3 monomer. The orientation of the σ3 monomer (adapted and modified from Olland et al., 2001 was examined with Molscript (Kraulis, 1991) and rendered with Raster3D (Merritt and Bacon, 1997). With the exception of selected regions shown in red (A–D) or olive (C–D), helices and turns are in light blue and β-sheets are in dark blue. (A) The selected red region corresponds to residues Ser214-Arg236, the initial tryptic fragment at pH 7.4. (B) The selected red region corresponds to residues Gly199-Glu217, the initial Glu-C protease fragment at pH 7.4. (C) and (D) The red region corresponds to residues Ser214-Arg236 from trypsin digestion at pH 7.4 and the olive region corresponds to residues Asn111-Leu128 from pepsin digestion at pH 3.0. In (D) the σ3 monomer is rotated 90° clockwise about the y-axis. The large green dot near the bottom of each image corresponds to the previously determined zinc ion (Olland et al., 2001).
Fig. 7.
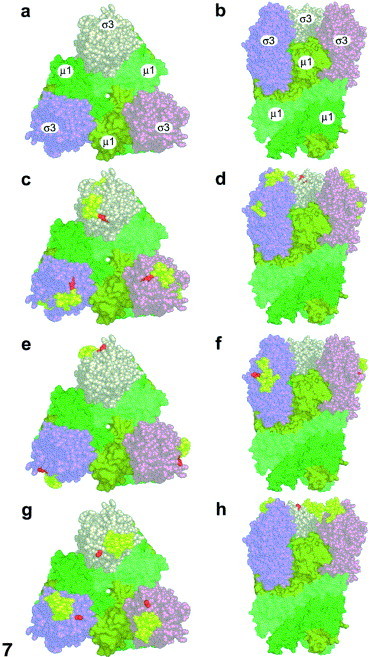
X-ray crystallographic structure of the σ3/μ1 heterohexamer. The orientation of the σ3/μ1 heterohexamer (adapted and modified from Liemann et al., 2002) using PyMol (DeLano, 2002) is shown in space-filling mode. Panels (A), (C), (E), and (G) show top views and panels (B), (D), (F), and (H) show side views of the structure. Individual proteins are identified in (A) and (B); μ1 are depicted in forest, olive, and lime; σ3 are depicted in wheat, pink, and salmon. Initial cleavage sites (red residues) and entire peptide fragments initially released from σ3 during time-course digestions (denoted in yellow) are indicated for trypsin (C, D), Glu-C (E, F), and pepsin (G, H).
Discussion
Characterization of virus proteins by MALDI-Qq-TOFMS
The recent development of orthogonal-injection MALDI-TOF provides a powerful tool for the structural characterization of virus proteins. Compared to electrospray ionization mass spectrometry, the tolerance to impurities permits the sample to be analyzed without any further separation or purification by methods similar to liquid chromatography. This alleviates sample losses associated with additional separation, which was particularly important for observation of the first peptides released during time-course digestion studies, which appeared after a few seconds at relatively low concentration compared to the salts. The technique is also fast, even with a low repetition-rate laser, allowing a large number of samples to be acquired in time-course studies. This is essential to distinguish changes in the spectrum to discriminate against noise. The high mass accuracy (average mass errors are 0.01 Da or less (Table 1, Table 2, Table 3)) in both single MS and MS/MS mode gives high success rate in protein identification by database searches. The high accuracy in MS/MS measurements is also particularly useful for de novo peptide sequencing or for identification of posttranslational modifications.
Previous work has indicated that virtually all reovirus proteins are blocked at their N-termini (Pett et al., 1973). Outer capsid protein μ1 contains a myristoyl group at its N-terminus (Nibert et al., 1991). Very recent reports also have identified an acetyl group at the N-terminus of σ3 (Jane-Valbuena et al., 2002), as confirmed in this study (Table 3A), and at the amino-terminus of minor reovirus core protein μ2 (Swanson et al., 2002). The function of an acetyl group at the N-terminus of σ3 is unknown, but, based on roles of other acetylated molecules, may serve to provide structural stability Cumberlidge and Isono 1979, Nguyen et al 2000 and/or promote protein complex assembly Berger et al 1981, Tercero and Wickner 1992. Another possibility is that the acetylation of its N-terminus may be required to differentiate the role(s) σ3 plays during the virus life cycle. Protein σ3 binds dsRNA (Huismans and Joklik, 1976), which may occur only when the protein dimerizes (Olland et al., 2001), σ3 is thought to counteract the reovirus induced host antiviral defence mechanism (Yue and Shatkin, 1997), and σ3 may play a role in the assortment complex during particle assembly (Antczak and Joklik, 1992). Previous studies also have shown that the efficiency of cellular translation is determined by the cytoplasmic level of σ3 that is not complexed with μ1 (Schmechel et al., 1997). Thus, some level of regulation must dictate which of the numerous roles σ3 functions in. One possible means of control is through μ1 binding, which would effectively remove freely available σ3 protein. Another regulatory role has been postulated to occur upon σ3 dimerization (Olland et al., 2001). A third possibility, currently under investigation, is that acetylation of σ3 may influence its regulatory roles, as suggested for a number of other acetylated proteins (reviewed in Polevoda and Sherman, 2000).
Morphology and orientation of reovirus outer capsid proteins
To date, there has been only limited evidence as to the exact placement of viral proteins within the bilayered capsids of reovirus. The high-resolution crystal structure of the innermost capsid core is known (Reinisch et al., 2000). In addition, the high-resolution crystal structure of outer capsid protein σ3 dimers (Olland et al., 2001) and μ1/σ3 heterohexamers (Liemann et al., 2002) have been determined and fitted, along with the core crystal structure, into cryo-EM models of the entire virion (Liemann et al., 2002). A large number of dramatic conformational changes, thought to be important in different stages of reovirus disassembly, have been described. These include changes during cell attachment (Fernandes et al., 1994), uncoating (Dryden et al., 1993), and transcription (Yeager et al., 1996). However, the entire virion has, to date, resisted crystallization and environmentally induced conformational alterations in the complex, that may result from exposure to acidic pH and pepsin (such as when this enteric virus passes through the stomach where the pH can be as low as 0.8; Vander et al., 1994), are poorly understood. The present analyses of purified virions by limited proteolysis and mass spectrometry has furthered this understanding and has provided evidence about the nature of viral outer capsid proteins in terms of structure, orientation, and conformational alterations.
Digestion of reovirus virions generally resulted in sequential digestion of outer capsid protein σ3, followed by sequential digestion of μ1. When virions were digested with α-chymotrypsin, pepsin, trypsin, and Glu-C protease, σ3 digestion initiated within a protease hypersensitive region (Fig. 2), which indicates this region is located on the external surface of the virion. Other studies that examine σ3 digestion have recently determined that this hypersensitive region is also initially cut by other proteases, including alkaline proteases such as trypsin (Jane-Valbuena et al., 2002) and acidic proteases, such as cathepsins Ebert et al 2002, Jane-Valbuena et al 2002. Our strategy of directly measuring peptides released from protease-treated intact particles by MALDI-Qq-TOFMS also allowed us to determine subsequent proteolytic events during the cascade of σ3 and μ1 digestion. These time-course studies showed that protein σ3 digestion proceeded bidirectionally toward both the N-terminus and the C-terminus, except that tryptic peptide fragment Ser144-Lys162 did not appear until after the remainder of the protein had been completely digested, which suggests this peptide may have been particle bound, and/or it may be this region of σ3 that interacts with underlying μ1, as suggested in the μ1/σ3 heterohexamer structure (Liemann et al., 2002). This result was not observed when virions were digested with Glu-C protease, which may be attributable to the fact that there are far fewer Glu-C cleavage sites that could result in the lack of detection of such a fragment.
Despite the belief that σ3 digestion appears to precede μ1 digestion (Fig. 1; see also, for example, Nibert et al., 1995), digestion of intact virions with trypsin initially released a short fragment of eight amino acid residues which corresponds to the extreme C-terminus of μ1, before any σ3 peptides were released. The appearance of this μ1 fragment suggests that the C-terminus of μ1 is accessible to trypsin and hence may be exposed on the surface of the virion, consistent with a recent hypothesis that this unresolved portion of μ1 in the μ1/σ3 crystal structure constitutes an exposed blob within the virus (Liemann et al., 2002). Furthermore, immunologic assays, using monoclonal antibodies directed against μ1, react with intact virions, which suggest a portion of μ1 is exposed on the virion surface Hayes et al 1981, Virgin et al 1994, as also suggested by other structural studies Dryden et al 1993, Liemann et al 2002. Initial digestion of μ1 by such proteases may be a prerequisite for reovirus uncoating and membrane penetration, a possibility that is currently under study.
Possible pH-induced conformation changes within the outer viral capsid
Viruses, such as reovirus, maintain high structural stability during the extracellular portions of their replicative cycles, yet are significantly dynamic during other stages in their life cycle, namely during cell attachment (Fernandes et al., 1994), uncoating (Dryden et al., 1993), and transcription (Yeager et al., 1996). Mass spectrometry has been used in the past to provide evidence of conformational changes in other viruses such as in flock house virus (Bothner et al., 1998), human rhinovirus (Lewis et al., 1998), and in Sindbis virus (Phinney et al., 2000). Flock house virus capsids underwent a change in conformation when treated with different solvents (Bothner et al., 1998). Binding of antiviral agents to human rhinovirus caused localized conformational changes that stabilized the viral capsid (Lewis et al., 1998). Low pH exposure caused conformational changes in the membrane glycoproteins of Sindbis virus (Phinney et al., 2000).
The present MALDI-Qq-TOFMS analyses of purified reovirus virions identified different initially released peptides when T1L was digested with different proteases under different pH conditions. This may provide evidence that T1L σ3 molecules undergo a conformational change when exposed to acidic pH. However, we acknowledge difficulty in interpreting data from using two different enzymes with different amino acid cleavage specificities under these significantly different pH conditions. Unfortunately, we are not aware of any single enzyme that operates efficiently under both pH conditions. Thus, it also is possible the different initially released peptides result from different enzyme specificities. To attempt to alleviate the difficulty in interpretation of experiments carried out with different enzymes under different pH conditions, we also performed experiments with Glu-C, which, unlike trypsin and pepsin, can operate under widely different pH conditions (pH 7.4 and 4.5). Tryptic digests of σ3 proteins that had been cut only once with Glu-C (Fig. 2 and Table 1, columns 4 and 5) revealed minor differences, while kinetic studies of the cascade of proteolytic events in whole particles (Fig. 5, and compare Table 2B to 2C) revealed no differences. Part of the difficulty with using Glu-C for such comparative studies is the lower frequency of appropriate cleavage sites in σ3 and their uneven distribution, which results in some sequence-predicted peptides that would lie outside the normal operating m/z range (500–5000) of the MALDI-Qq-TOFMS used. Other apparent paradoxes are that the initial Glu-C cleavage site (Glu217) and initial fragment released by Glu-C digestion (Gly199-Glu217) appear, predicted from fitting the σ3/μ1 heterohexamer crystal structure into whole particle cryo-EM reconstructions (Liemann et al., 2002), to reside in regions of the σ3 protein that abut other σ3 proteins located in adjacent σ3/μ1 heterohexamers. Resolution of this apparent conflict, which may result from the different methodologies of comparing static crystal structures to virions digested in solution, the latter of which may be capable of “breathing,” as well as additional studies to better examine possible pH-induced conformational alterations, are underway. Interestingly, despite these differences, σ3 is completely cleaved rapidly under each of these conditions to generate a subviral particle, which suggests the virus has evolved to successfully uncoat itself under a variety of conditions likely to be encountered during infection.
In conclusion, our results pinpoint those regions of the reovirus outer capsid protein σ3 that are initially cut by a variety of proteases, and thus presumably exposed in virions at a variety of pH values, confirm the presence of an acetyl group at the amino-terminus of this protein in virions, and delineate the cascade of σ3 cleavages as the virion is converted into an ISVP.
Materials and methods
Cells and viruses
T1L was plaque purified and grown in mouse L929 cell monolayers in Joklik-modified minimal essential medium (GIBCO, Grand Island, NY) supplemented to contain 2.5% fetal calf serum (Gibco-BRL Life Technologies, Burlington, Ontario), 2.5% VSP neonate bovine serum (Biocell, Carson, CA), 2 mM glutamine, 100 U penicillin per milliliter, 100 μg streptomycin sulfate per milliliter, and 1 μg amphotericin-B per milliliter, as previously described (Coombs et al., 1994). Large amounts of virus were grown in spinner culture, extracted with Vertrel-XF, and purified in cesium chloride gradients as described (Mendez et al., 2000). Virus bands were harvested, dialyzed extensively against dialysis buffer (D buffer: 150 mM NaCl, 15 mM MgCl2, 10 mM Tris, pH 7.4), and stored at 4°C until used. Protease digestion analyses were conducted multiple times on virions that had been prepared and purified on three separate occasions.
Proteolysis
Endoproteases Glu-C (Staphylococcus aureus V8) and pepsin (Boehringer Mannheim GmbH) were resuspended as stock solutions (0.1 mg/ml) in appropriate buffers and stored at −20°C. Chymotrypsin and sequencing-grade trypsin (Sigma Chemical Co.) solutions were freshly prepared in D buffer (pH 7.4). Enzyme activities were verified with standard protein BSA (Sigma). Aliquots of virus were digested with proteases within 14 days of having been dialyzed. Purified virions were usually diluted to final concentrations of 3–5 mg/ml into buffers precalibrated to produce final pH values of 3.0, 4.5, or 7.4, and then the diluted virions were incubated at 37°C with various concentrations of Glu-C, chymotrypsin, trypsin, or pepsin at a final protein-to-enzyme ratio of 10:1 to 1000:1. Under conditions of high viral particle concentration, extended proteolysis of virions was confirmed to generate core particles (data not shown). Aliquots from the digestion reactions were collected at various time intervals. For peptides subsequently resolved in polyacrylamide gels, further digestion of viral proteins was inhibited by addition of phenylmethylsulfonyl fluoride to chymotrypsin digestions to a final concentration of 5 mM, by addition of soybean trypsin inhibitor to a final concentration of 125 μg/ml to trypsin digestions, by addition of 1/25th volume of 1 M Tris pH 8.8 to pepsin reactions, and by chilling Glu-C reactions. One-quarter volume of 5× electrophoresis sample buffer was added to each reaction and immediately boiled for gel analysis (below). Further digestion of peptides to be directly measured by MS was inhibited by addition of an equal volume of 0.1% trifluoroacetic acid to samples digested with chymotrypsin, trypsin, or Glu-C, or by addition of an equal volume of 10 mM Tris pH 7.4 to samples digested with pepsin. For direct MS analyses, nascent digests were immediately placed on ice to arrest proteolysis and diluted to 1 mg/ml with dH2O. A 1:1 ratio of diluted sample and 2,5-dihydroxybenzoic acid (DHB) matrix solution was prepared and 0.5 μl was placed onto a MALDI sample plate and dried for MALDI-Qq-TOFMS analysis. Capacity of the respective treatments to arrest specific proteases was confirmed in time-course digestions or with standard BSA.
Sodium dodecyl sulfate–polyacrylamide gel electrophoresis (SDS–PAGE)
Proteolytically digested samples were resuspended in electrophoresis sample buffer (240 mM Tris–HCl, pH 6.8, 1.5% dithiothreitol, 1% SDS), heated to 95°C for 5 min, and resolved in various gradient SDS–PAGE gels, using the discontinuous Tris/glycine buffer system (Laemmli, 1970). Gels were fixed and stained with Coomassie brilliant blue R-250.
In-gel digestion and extraction of peptides
The following steps were modified from previously published procedures Rosenfeld et al 1992, Hellman et al 1995, Shevchenko et al 1996, Wilm et al 1996. The excised gel bands (from SDS–PAGE gels above) were fragmented and destained by repeated washings with alternating 100 mM NH4HCO3 and a 1:1 (v/v) mixture of CH3CN:100 mM NH4HCO3 solutions. After washes, gel pieces were dried in a SpeedVac and reswollen with 20 μl of 25 mM NH4HCO3 that contained 30 ng trypsin (Sigma, sequencing grade) for 45 min at 4°C. An additional 200 μl of the buffer was added to cover the gel pieces, which were then incubated at 37°C overnight. The digestion mixture was deactivated with 10 μl 2% TFA and the resultant peptide fragments were eluted by 30 min of sonication in the presence of three successive changes in 150 μl 0.1% TFA, 150 μl 1:1 mixture of acetonitrile:0.1% TFA (v/v), and 150 μl 100% acetonitrile. The whole extraction procedure was repeated three additional times and the collected solutions that contained extracted peptides were pooled and dried.
Mass spectrometry and data analyses
Mass spectra of proteolytic peptides, and tandem mass spectra (MS/MS) of their daughter ions, were obtained on a prototype tandem quadrupole/TOF mass spectrometer (QqTOF) (Shevchenko et al., 1997) coupled to a MALDI source (Chernushevich et al., 1999). Samples were irradiated with a nitrogen laser (Laser Science Inc., model 337ND) operating at a repetition rate of 7 Hz for single MS and 15 Hz for tandem MS. Single MS spectra were acquired in approximately 1 min; tandem mass spectra were accumulated for several minutes. For tandem mass spectrometry, selected ions were fragmented in a collision cell that contained argon. The collision energy was adjusted manually between 30 and 170 eV to obtain optimum fragmentation of the parent ions.
Mass spectra were recorded and analyzed using software (Tofma) developed in-house. Two-point, external calibration was performed using a mixture of dalargin and melittin. The peptides and proteins were identified by searching on-line databases against monoisotopic masses using MS-Tag and MS-Fit (http://prospector.ucsf.edu/; http://prowl.rockefeller.edu/cgi-bin/ProFound). For comparison, fragment masses from either enzymatic digestions or collision-induced dissociation (CID) were calculated using ProMac (Sciex, Concord, ON).
Protein structure analyses
The dimeric σ3 X-ray crystallographic structure (Accession No. PDB ID 1FN9, originally determined by Olland et al., 2001) and (σ3μ1)3 heterohexameric X-ray crystallographic structure (Accession No. PDB ID 1JMU, originally determined by Liemann et al., 2002) were manipulated and modified with the graphics visualization computer programs RasMol 2.7.1. (Bernstein and Sons, Belport, NY), PyMol (DeLano, 2002), and Molscript (Kraulis, 1991).
Acknowledgements
The authors thank Drs. Terry Dermody and Max Nibert for critical reviews of this work and for sharing data prior to publication. The authors also thank Dr. Paul Hazelton for electron microscopy; Dr. Oleg Krokhin for help with mass spectra renditions; Brian Mark for helping generate Fig. 6, Fig. 7; Dr. Ken Standing for helpful discussion; and Megan Patrick, Magdalena Swanson, Laura Hermann, and Tammy Stuart for helpful discussion. This research was supported by a grant from the University of Manitoba Research Council, by grants from the Natural Sciences and Engineering Research Council of Canada, by Grants MT-11630 and GSP-48371 from the Canadian Institutes of Health Research, and by Grant GM59240 from the National Institutes of Health. I.I.M. was the recipient of a Manitoba Health Research Council Studentship.
References
- Antczak J.B., Joklik W.K. Reovirus genome segment assortment into progeny genomes studied by the use of monoclonal antibodies directed against reovirus proteins. Virology. 1992;187:760–776. doi: 10.1016/0042-6822(92)90478-8. [DOI] [PubMed] [Google Scholar]
- Baer G.S., Dermody T.S. Mutations in reovirus outer-capsid protein sigma3 selected during persistent infections of L cells confer resistance to protease inhibitor E64. J. Virol. 1997;71:4921–4928. doi: 10.1128/jvi.71.7.4921-4928.1997. [DOI] [PMC free article] [PubMed] [Google Scholar]
- Berger E.M., Cox G., Weber L., Kenney J.S. Actin acetylation in Drosophila tissue culture cells. Biochem. Genet. 1981;19:321–331. doi: 10.1007/BF00504277. [DOI] [PubMed] [Google Scholar]
- Bodkin D.K., Nibert M.L., Fields B.N. Proteolytic digestion of reovirus in the intestinal lumens of neonatal mice. J. Virol. 1989;63:4676–4681. doi: 10.1128/jvi.63.11.4676-4681.1989. [DOI] [PMC free article] [PubMed] [Google Scholar]
- Borsa J., Morash B.D., Sargent M.D., Copps T.P., Lievaart P.A., Szekely J.G. Two modes of entry of reovirus particles into L cells. J. Gen. Virol. 1979;45:161–170. doi: 10.1099/0022-1317-45-1-161. [DOI] [PubMed] [Google Scholar]
- Bothner B., Dong X.F., Bibbs L., Johnson J.E., Siuzdak G. Evidence of viral capsid dynamics using limited proteolysis and mass spectrometry. J. Biol. Chem. 1998;273:673–676. doi: 10.1074/jbc.273.2.673. [DOI] [PubMed] [Google Scholar]
- Chernushevich I.V., Ens W., Standing K.G. Orthogonal-injection TOFMS for analyzing biomolecules. Anal. Chem. 1999;71:452A–461A. doi: 10.1021/ac990524l. [DOI] [PubMed] [Google Scholar]
- Coombs K.M. Stoichiometry of reovirus structural proteins in virus, ISVP, and core particles. Virology. 1998;243:218–228. doi: 10.1006/viro.1998.9061. [DOI] [PubMed] [Google Scholar]
- Coombs K.M., Mak S.C., Petrycky-Cox L.D. Studies of the major reovirus core protein sigma 2: reversion of the assembly-defective mutant tsC447 is an intragenic process and involves back mutation of Asp-383 to Asn. J. Virol. 1994;68:177–186. doi: 10.1128/jvi.68.1.177-186.1994. [DOI] [PMC free article] [PubMed] [Google Scholar]
- Cumberlidge A.G., Isono K. Ribosomal protein modification in Escherichia coli. I. A mutant lacking the N-terminal acetylation of protein S5 exhibits thermosensitivity. Proc. Natl. Acad. Sci. USA. 1979;131:169–189. doi: 10.1016/0022-2836(79)90072-x. [DOI] [PubMed] [Google Scholar]
- DeLano, W.L. 2002. The PyMOL molecular graphics system. http://www.pymol.org
- Dryden K.A., Wang G., Yeager M., Nibert M.L., Coombs K.M., Furlong D.B., Fields B.N., Baker T.S. Early steps in reovirus infection are associated with dramatic changes in supramolecular structure and protein conformation: analysis of virions and subviral particles by cryoelectron microscopy and image reconstruction. J. Cell Biol. 1993;122:1023–1041. doi: 10.1083/jcb.122.5.1023. [DOI] [PMC free article] [PubMed] [Google Scholar]
- Ebert D.H., Deussing J., Peters C., Dermody T.S. Cathepsin L and cathepsin B mediate reovirus disassembly in murine fibroblast cells. J. Biol. Chem. 2002;277:24609–24617. doi: 10.1074/jbc.M201107200. [DOI] [PubMed] [Google Scholar]
- Fernandes J., Tang D., Leone G., Lee P.W. Binding of reovirus to receptor leads to conformational changes in viral capsid proteins that are reversible upon virus detachment. J. Biol. Chem. 1994;269:17043–17047. [PubMed] [Google Scholar]
- Fields B.N., Eagle H. The pH-dependence of reovirus synthesis. Virology. 1973;52:581–583. doi: 10.1016/0042-6822(73)90355-3. [DOI] [PubMed] [Google Scholar]
- Georgi A., Mottola-Hartshorn C., Warner A., Fields B., Chen L.B. Detection of individual fluorescently labeled reovirions in living cells. Proc. Natl. Acad. Sci. USA. 1990;87:6579–6583. doi: 10.1073/pnas.87.17.6579. [DOI] [PMC free article] [PubMed] [Google Scholar]
- Hayes E.C., Lee P.W.K., Miller S.E., Joklik W.K. The interaction of a series of hybridoma IgGs with reovirus particles: demonstration that the core protein lambda 2 is exposed on the particle surface. Virology. 1981;108:147–155. doi: 10.1016/0042-6822(81)90534-1. [DOI] [PubMed] [Google Scholar]
- Hellman U., Wernstedt C., Gonez J., Heldin C.-H. Improvement of an “in gel” digestion procedure for the micropreparation of internal protein fragments for amino acid sequencing. Anal. Biochem. 1995;224:451–455. doi: 10.1006/abio.1995.1070. [DOI] [PubMed] [Google Scholar]
- Huismans H., Joklik W.K. Reovirus-coded polypeptides in infected cells: isolation of two native monomeric polypeptides with high affinity for single-stranded and double-stranded RNA, respectively. Virology. 1976;70:411–424. doi: 10.1016/0042-6822(76)90282-8. [DOI] [PubMed] [Google Scholar]
- Jane-Valbuena J., Breun L.A., Schiff L.A., Nibert M.L. Sites and determinaants of early cleavages in the proteolytic processing pathway of reovirus surface protein sigma3. J. Virol. 2002;76:5184–5197. doi: 10.1128/JVI.76.10.5184-5197.2002. [DOI] [PMC free article] [PubMed] [Google Scholar]
- Joklik W.K. Studies on the effect of chymotrypsin on reovirions. Virology. 1972;49:700–701. doi: 10.1016/0042-6822(72)90527-2. [DOI] [PubMed] [Google Scholar]
- Kraulis P.J. Molscript: a program to produce both detailed and schematic plots of protein structures. J. Appl. Crystallogr. 1991;24:946–950. [Google Scholar]
- Laemmli U.K. Cleavage of structural proteins during the assembly of the head of bacteriophage T4. Nature (Lond.) 1970;227:680–685. doi: 10.1038/227680a0. [DOI] [PubMed] [Google Scholar]
- Larson S.M., Antczak J.B., Joklik W.K. Reovirus exists in the form of 13 particle species that differ in their content of protein sigma 1. Virology. 1994;201:303–311. doi: 10.1006/viro.1994.1295. [DOI] [PubMed] [Google Scholar]
- Lee P.W.K., Hayes E.C., Joklik W.K. Protein σ1 is the reovirus cell attachment protein. Virology. 1981;108:156–163. doi: 10.1016/0042-6822(81)90535-3. [DOI] [PubMed] [Google Scholar]
- Lewis J.K., Bothner B., Smith T.J., Siuzdak G. Antiviral agent blocks breathing of the common cold virus. Proc. Natl. Acad. Sci. USA. 1998;95:6774–6778. doi: 10.1073/pnas.95.12.6774. [DOI] [PMC free article] [PubMed] [Google Scholar]
- Liemann S., Chandran K., Baker T.S., Nibert M.L., Harrison S.C. Structure of the reovirus membrane-penetration protein, mul, in a complex with its protector protein, sigma3. Cell. 2002;108:283–295. doi: 10.1016/s0092-8674(02)00612-8. [DOI] [PMC free article] [PubMed] [Google Scholar]
- Mendez I.I., Hermann L.L., Hazelton P.R., Coombs K.M. A comparative analysis of Freon substitutes in the purification of reovirus and calicivirus. J. Virol. Methods. 2000;90:59–67. doi: 10.1016/s0166-0934(00)00217-2. [DOI] [PubMed] [Google Scholar]
- Merritt E.A., Bacon D.J. Raster3D: Photorealistic molecular graphics. Methods Enzymol. 1997;277:505–524. doi: 10.1016/s0076-6879(97)77028-9. [DOI] [PubMed] [Google Scholar]
- Metcalf P., Cyrklaff M., Adrian M. The three-dimensional structure of reovirus obtained by cryo-electron microscopy. EMBO J. 1991;10:3129–3136. doi: 10.1002/j.1460-2075.1991.tb04874.x. [DOI] [PMC free article] [PubMed] [Google Scholar]
- Nguyen B.D., Xia Z., Cutruzzola F., Allocatelli C.T., Brunori M., La Mar G.N. Solution 1-H NMR study of the influence of distal hydrogen bonding and N terminus acetylation on the active site electronic and molecular structure of Aplysia limacina cyanomet myoblobin. J. Biol. Chem. 2000;275:742–761. doi: 10.1074/jbc.275.2.742. [DOI] [PubMed] [Google Scholar]
- Nibert M.L., Chappell J.D., Dermody T.S. Infectious subvirion particles of reovirus type 3 Dearing exhibit a loss in infectivity and contain a cleaved sigma 1 protein. J. Virol. 1995;69:5057–5067. doi: 10.1128/jvi.69.8.5057-5067.1995. [DOI] [PMC free article] [PubMed] [Google Scholar]
- Nibert M.L., Fields B.N. A carboxy-terminal fragment of protein mu 1/mu 1C is present in infectious subvirion particles of mammalian reoviruses and is proposed to have a role in penetration. J. Virol. 1992;66:6408–6418. doi: 10.1128/jvi.66.11.6408-6418.1992. [DOI] [PMC free article] [PubMed] [Google Scholar]
- Nibert M.L., Schiff L.A. Reoviruses and their replication. In: Knipe D.M., Howley P.M., editors. 4th ed. Vol. 2. Lippincott Williams, & Wilkins; Philadelphia: 2001. pp. 1679–1728. (Fields Virology). [Google Scholar]
- Nibert M.L., Schiff L.A., Fields B.N. Mammalian reoviruses contain a myristoylated structural protein. J. Virol. 1991;65:1960–1967. doi: 10.1128/jvi.65.4.1960-1967.1991. [DOI] [PMC free article] [PubMed] [Google Scholar]
- Olland A.M., Jane-Valbuena J., Schiff L.A., Nibert M.L., Harrison S.C. Structure of the reovirus outer capsid and dsRNA-binding protein sigma3 at 1.8A resolution. EMBO J. 2001;20:979–989. doi: 10.1093/emboj/20.5.979. [DOI] [PMC free article] [PubMed] [Google Scholar]
- Pett D.M., Vanaman T.C., Joklik W.K. Studies on the amino and carboxyl-terminal amino acid sequences of reovirus capsid polypeptides. Virology. 1973;52:174–186. doi: 10.1016/0042-6822(73)90407-8. [DOI] [PubMed] [Google Scholar]
- Phinney B.S., Blackburn K., Brown D.T. The surface conformation of Sindbis virus glycoproteins E1 and E2 at neutral and low pH, as determined by mass spectrometry-based mapping. J. Virol. 2000;74:5667–5678. doi: 10.1128/jvi.74.12.5667-5678.2000. [DOI] [PMC free article] [PubMed] [Google Scholar]
- Polevoda B., Sherman F. N-terminal acetylation of eukaryotic proteins. J. Biol. Chem. 2000;275:36479–36482. doi: 10.1074/jbc.R000023200. [DOI] [PubMed] [Google Scholar]
- Ralph S.J., Harvey J.D., Bellamy A.R. Subunit structure of the reovirus spike. J. Virol. 1980;36:894–896. doi: 10.1128/jvi.36.3.894-896.1980. [DOI] [PMC free article] [PubMed] [Google Scholar]
- Reinisch K.M., Nibert M.L., Harrison S.C. Structure of the reovirus core at 3.6 A resolution. Nature. 2000;404:960–967. doi: 10.1038/35010041. [DOI] [PubMed] [Google Scholar]
- Rosenfeld J., Capdevielle J., Guillemot J.C., Ferrara P. In-gel digestion of proteins for internal sequence-analysis after 1-dimensional or 2-dimensional gel-electrophoresis. Anal. Biochem. 1992;203:173–179. doi: 10.1016/0003-2697(92)90061-b. [DOI] [PubMed] [Google Scholar]
- Rubin D.H., Weiner D.B., Dworkin C., Greene M.I., Maul G.G., Williams W.V. Receptor utilization by reovirus type 3: distinct binding sites on thymoma and fibroblast cell lines result in differential compartmentalization of virions. Microb. Pathog. 1992;12:351–365. doi: 10.1016/0882-4010(92)90098-9. [DOI] [PubMed] [Google Scholar]
- Schmechel S., Chute M., Skinner P., Anderson R., Schiff L. Preferential translation of reovirus mRNA by a sigma3-dependent mechanism. Virology. 1997;232:62–73. doi: 10.1006/viro.1997.8531. [DOI] [PubMed] [Google Scholar]
- Sherry B., Baty C.J., Blum M.A. Reovirus-induced acute myocarditis in mice correlates with viral RNA synthesis rather than generation of infectious virus in cardiac myocytes. J. Virol. 1996;70:6709–6715. doi: 10.1128/jvi.70.10.6709-6715.1996. [DOI] [PMC free article] [PubMed] [Google Scholar]
- Shevchenko A., Chernushevich I., Ens W., Standing K.G., Thomson B., Wilm M., Mann M. Rapid “de novo” peptide sequencing by a combination of nanoelectrospray, isotopic labeling and a quadrupole/time-of-flight mass spectrometer. Rapid Commun. Mass Spectrom. 1997;11:1015–1024. doi: 10.1002/(SICI)1097-0231(19970615)11:9<1015::AID-RCM958>3.0.CO;2-H. [DOI] [PubMed] [Google Scholar]
- Shevchenko A., Wilm M., Vorm O., Mann M. Mass spectrometric sequencing of proteins from silver-stained polyacrylamide gels. Anal. Chem. 1996;68:850–858. doi: 10.1021/ac950914h. [DOI] [PubMed] [Google Scholar]
- Stanley N.F. Reoviruses. Br. Med. Bull. 1967;23:150–154. doi: 10.1093/oxfordjournals.bmb.a070536. [DOI] [PubMed] [Google Scholar]
- Sturzenbecker L.J., Nibert M., Furlong D., Fields B.N. Intracellular digestion of reovirus particles requires a low pH and is an essential step in the viral infectious cycle. J. Virol. 1987;61:2351–2361. doi: 10.1128/jvi.61.8.2351-2361.1987. [DOI] [PMC free article] [PubMed] [Google Scholar]
- Swanson, M.I., She, Y.-M., Brown, E.G., Ens, W., Coombs, K. 2002. Mammalian reovirus core protein μ2 initiates at the first start codon and is acetylated. Rapid Commun. Mass Spectrom. 16, 2317–2324 [DOI] [PubMed]
- Tercero J.C., Wickner R.B. MAK3 encodes an N-acetyltransferase whose modification of the L-A gag NH2 terminus is necessary for virus particle assembly. J. Biol. Chem. 1992;267:20277–20281. [PubMed] [Google Scholar]
- Vander A.J., Sherman J.H., Luciano D.S. Human Physiology: The Mechanism of Body Function. 6th ed. McGraw-Hill; New York: 1994. [Google Scholar]
- Virgin H.W., 4th., Mann M.A., Tyler K.L. Protective antibodies inhibit reovirus internalization and uncoating by intracellular proteases. J. Virol. 1994;68:6719–6729. doi: 10.1128/jvi.68.10.6719-6729.1994. [DOI] [PMC free article] [PubMed] [Google Scholar]
- White D.O., Fenner F.J. Medical Virology. 4th ed. Academic Press; San Diego: 1994. [Google Scholar]
- Wilm M., Shevchenko A., Houthaeve T., Breit S., Schweigerer L., Fotsis T., Mann M. Femtomole sequencing of proteins from polyacrylamide gels by nano-electrospray mass spectrometry. Nature. 1996;379:466–469. doi: 10.1038/379466a0. [DOI] [PubMed] [Google Scholar]
- Yeager M., Weiner S.C., Coombs K.M. Transcriptionally active reovirus core particles visualized by electron cryo-microscopy and image reconstruction. Biophys. J. 1996;70:A116. [Google Scholar]
- Young J.A.T. Virus entry and uncoating. In: Knipe D.M., Howley P.M., Griffin D.E., Lamb R.A., Martin M.A., Roizman B., Straus S.E., editors. 4th ed. Vol. 1. Lippincott, Williams, & Wilkins; Philadelphia: 2001. pp. 87–103. (Fields Virology). [Google Scholar]
- Yue Z., Shatkin A.J. Double-stranded RNA-dependent protein kinase (PKR) is regulated by reovirus structural proteins. Virology. 1997;234:364–371. doi: 10.1006/viro.1997.8664. [DOI] [PubMed] [Google Scholar]