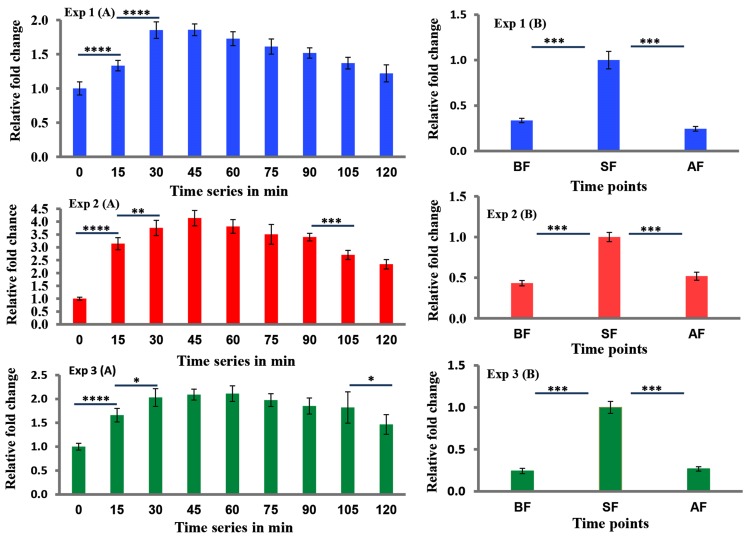
Fig 1. Expression changes of the IEG kakusei during daily foraging of bees.
Data are shown as fold changes of kakusei expression level at different time points with respect to t0 (mean value was set to 1 at this time point). The blue, red and green bar graphs represent three independent experiments (experiment 1, experiment 2 and experiment 3 respectively) with each bar representing the kakusei expression level at each time point. Graphs at the left (Experiment series A) represent kakusei level from t0 (14.00 hrs) to t120 (16.00 hrs). Graphs at the right represent kakusei level at the start of foraging (SF/t0: 14.00 hrs) and before-foraging (BF: 09.00 hrs) or after foraging (AF: 18.00 hrs). Each time point has sample size of n = 5. For statistics one-way ANOVA with Turkey- Kramer post-hog multiple comparison test were performed and number of asterisk symbol represents * P < 0.05, ** P < 0.01, *** P < 0.001, and **** P < 0.0001.

