

Abstract
DHX15, a DEAH box containing RNA helicase, is a splicing factor required for the last step of splicing. Recent studies identified a recurrent mutational hotspot, R222G, in DHX15 in ∼ 6% of acute myeloid leukemia (AML) patients that carry the fusion protein RUNX1-RUNX1T1 produced by t (8;21) (q22;q22). Studies using yeast mutants showed that substitution of G for the residue equivalent to R222 leads to loss of its helicase function, suggesting that it is a loss-of-function mutation. To elucidate the role of DHX15 during development, we established the first vertebrate knockout model with CRISPR/Cas9 in zebrafish. Our data showed that dhx15 expression is enriched in the brain, eyes, pectoral fin primordia, liver and intestinal bulb during embryonic development. Dhx15 deficiency leads to pleiotropic morphological phenotypes in homozygous mutant embryos starting at 3 days post fertilization (dpf) that result in lethality by 7 dpf, revealing an essential role during embryonic development. RNA-seq analysis suggested important roles of Dhx15 in chromatin and nucleosome assembly and regulation of the Mdm2-p53 pathway. Interestingly, exons corresponding to the alternate transcriptional start sites for tp53 and mdm2 were preferentially expressed in the mutant embryos, leading to significant upregulation of their alternate isoforms, Δ113p53 (orthologous to Δ133p53 isoform in human) and mdm2-P2 (isoform using distal promoter P2), respectively. We speculate that these alterations in the Mdm2-p53 pathway contribute to the development of AML in patients with t(8;21) and somatically mutated DHX15.
Introduction
Recently, we and others have identified DHX15, encoding for a DEAH box RNA helicase, as a novel driver gene in acute myeloid leukemia (AML) (1–6). Interestingly, the recurrent somatic mutation in DHX15 occurs exclusively at the arginine 222 residue, changing it to glycine (R222G), indicating a mutational hotspot and/or functional selection for this specific amino acid substitution. Furthermore, the majority of the reported AML patients with the R222G mutations in DHX15 also share the cytogenetic abnormality t(8;21) (q22;q22) that generates the fusion protein, RUNX1-RUNX1T1, which is the primary cause of their AML. Overall, ∼ 6% of t(8;21) AML patients carry the somatic mutation, R222G, in DHX15 (5, 6). These findings suggest a specific role for DHX15 in the development of leukemia in the presence of the fusion protein, RUNX1-RUNX1T1. Furthermore, altered DHX15 expression has been reported in many cancers, including acute lymphocytic leukemia, breast cancer, clear cell renal cell carcinoma, glioma, hepatocellular carcinoma, lung adenocarcinoma, lymphoma, prostate cancer and uterine cancer (4, 7–10). Thus, it is important to understand the function of DHX15 in both normal development and cancer.
DHX15 is a splicing factor that functions in the last step of splicing by facilitating the disassembly of spliceosome and release of lariat introns (11, 12). Interestingly, both germline and somatic mutations in multiple components of the splicing machinery, such as DDX41, SF1, SF3B1, SFPQ, SRSF2, U2AF1, U2AF65 and ZRSR2, have been reported in patients with AML, chronic lymphocytic leukemia and myelodysplastic syndrome (13–17). Recently, Seiler and colleagues (18) reported that somatic mutations in splicing factor genes are common in many cancers. Their analysis utilized the Cancer Genome Atlas data from 33 tumor types and identified mutations in 119 splicing factor genes among these tumors. Thus, DHX15 adds to the growing list of splicing factors mutated in cancer and highlights the importance of a properly functioning splicing machinery in preventing tumorigenesis. Similar to DHX15, specific mutational hotspots are observed in DDX41, SF3B1, SRSF2 and U2AF1 whereas mutations are distributed throughout the genes in SF1, U2AF65 and ZRSR2, suggesting there are different mechanisms of action of these splicing factors in tumor development (13–16). Therefore, characterization of the function of DHX15 in a vertebrate model would provide insights into the underlying mechanisms of tumorigenesis in patients with defective splicing machinery.
To date, functional studies of DHX15 have utilized in vitro assays and yeast to identify its roles in splicing and ribosome biogenesis (11, 12, 19). Recently, elucidation of crystal structures of both human DHX15 and its fungal ortholog Prp43 has provided further insights into its mechanism of action during splicing (20–24). These studies revealed a conserved protein structure with six functional domains: the N terminal domain, RecA1 and RecA2 domains, a winged-helix (WH) domain, a ratchet (HB) domain and a C-terminal domain with an oligonucleotide/oligosaccharide-binding (OB) fold (20–24). Elucidation of the Prp43 structure in the presence of ATP and RNA suggested that a channel-like structure for binding to RNA is formed by an interaction of the two RecA domains with WH and ratchet domains and the OB fold (23, 25). The R222 residue, mutated in t(8;21) AML patients, is a highly conserved feature of the RecA1 domain and protrudes into the predicted RNA-binding pocket, suggesting an important role of the R222 residue in RNA binding (24). Mutations of the residue equivalent to R222 (R177A in Saccharomyces cerevisiae, R180G in Chaetomium thermophilum) reveal that it is necessary for both ribosome biogenesis and spliceosome disassembly (23, 25). C. thermophilum mutants where R180 and F181 were substituted with glycine exhibited reduced helicase activity suggesting that the changes in hydrogen bonding when arginine is replaced with glycine lead to its loss of function (25). Based on these studies, DHX15 R222G mutation in t(8;21) AML patients seems to be a loss-of-function mutation. However, the presence of a mutational hotspot in AML patients suggests that the R222G mutation acts as a gain-of-function mutation.
Here, we report the first animal model for loss of DHX15 function and describe its role in vertebrate development using zebrafish. We used CRISPR/Cas9 technology to target the RecA1 domain in DHX15 and generated two zebrafish dhx15 knockout lines. The dhx15−/− embryos displayed pleiotropic phenotypes during embryonic development and died by 7 dpf. Analysis of RNA-seq data from dhx15−/− embryos revealed that Dhx15 is important for the regulation of the Mdm2-p53 pathway.
Results
Expression of dhx15 is enriched in the anterior region of embryos
Zebrafish carry a single copy of dhx15 gene (GenBank Accession number NM_001115141.1) on chromosome 7. The encoded protein is 769 amino acids in length and shows 88% identity and 94% similarity with the human DHX15 protein (Supplementary Material, Fig S1A). Majority of the differences between human and zebrafish Dhx15 proteins are in the N-terminal region, while all the functional domains are highly conserved (Supplementary Material, Fig. S1A). To understand the role of dhx15 in normal development and AML, we sought to determine its expression in the hematopoietic and other tissues by RT-PCR and whole-mount in situ hybridization (WISH) in wild-type (WT) embryos collected from a series of developmental stages (Fig. 1, Supplementary Material, Fig. S1B). Our data showed that dhx15 is expressed throughout embryonic development, starting from the one-cell stage to 5 dpf (Supplementary Material, Fig. S1B). Its expression in the fertilized egg and at 3 h post fertilization (hpf) indicates maternal contribution of dhx15 mRNA before the zygotic transcription begins (Fig. 1A and B, Supplementary Material, Fig. S1B). For the first 16 h of development, dhx15 is ubiquitously expressed throughout the developing embryo (Fig. 1A–C). At subsequent stages, dhx15 expression is enriched in the anterior region of the embryo, specifically in the eyes, brain and pectoral fin primordia (Fig. 1D–I). At 5 dpf, dhx15 is also expressed in the liver and intestinal bulb (Fig. 1I). However, we did not detect dhx15 expression in the hematopoietic tissues. Lack of expression in the hematopoietic tissues might be based on the low-level expression below the detection limits of our staining regiment. These data suggest that certain tissues in the anterior region of embryos have higher requirements for Dhx15 during development.
Figure 1.
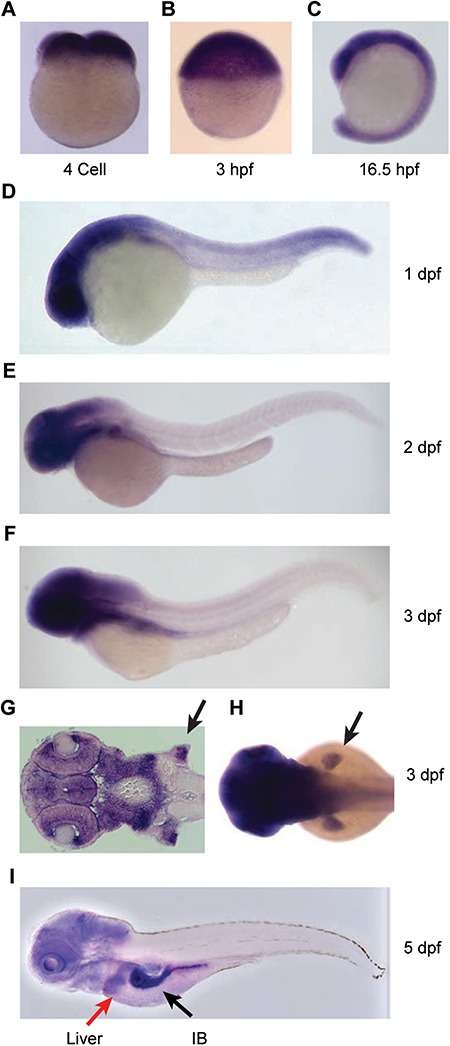
Expression of dhx15 during zebrafish embryonic development. (A–I) WISH for antisense dhx15 probe in WT embryos from various developmental stages. (A, B) dhx15 mRNA is detected at four-cell and 3 hpf stages indicating that it is maternally supplied before the onset of zygotic transcription. (C, I) Strong dhx15 expression is detected in the anterior part of the embryo starting at 1 dpf. (G) Coronal section of an embryo at 3 dpf showing strong dhx15 expression in the eyes, brain and pectoral fin primordia (black arrow). (H) Dorsal view of a 3 dpf embryo showing strong dhx15 expression in pectoral fin primordia (black arrow). (I) At 5 dpf, dhx15 expression is also detected in the liver (red arrow) and intestinal bulb (black arrow). (A–F and I) Lateral views with embryo head pointing to the left.
Generation of dhx15−/− zebrafish mutants
The main objective of our study was to explore in vivo functions of dhx15 during zebrafish development. Therefore, we applied CRISPR/Cas9 technology to generate dhx15 knockout fish by targeting the RecA1 domain that contains the conserved amino acid R196 (equivalent to recurrently mutated R222 in t(8;21) AML patients). We selected two independent indel mutations: a 4 bp deletion in exon 2 (c.338delTCTG; p.Val113Glyfs*11) and an 8 bp deletion in exon 3 (c.566delAGGAGGTC; p.Gln189Argfs*10) for our study (Fig. 2A and B). RT-PCR and sequencing from WT and homozygous mutant embryos confirmed that both mutant alleles are expressed as predicted without any aberrant effects on splicing (Fig. 2C–E). Since we targeted early exons (2 and 3), there is a chance that partially functional protein can be made from a translational initiation site downstream of the frameshift mutation. Therefore, we performed functional fluorescent reporter assay in which lack of GFP expression in injected embryos indicates there is no downstream translation initiation site (26). Both mutant alleles failed to drive GFP expression while robust RFP expression was detected, confirming that the selected mutant alleles are true nulls (Supplementary Material, Fig. S2). In subsequent sections, dhx15 mutant alleles, p.Val113Glyfs*11 and p.Gln189Argfs*10, are described by their Zebrafish International Resource Center designations (http://zfin.org/action/feature/line-designations) as dhx15hg92 and dhx15hg93, respectively (Fig. 2A and B).
Figure 2.
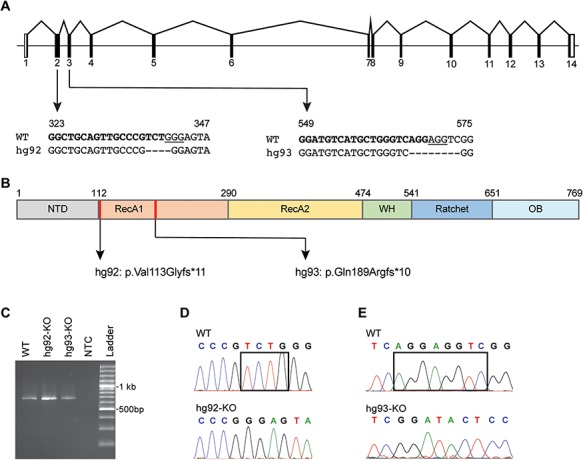
Description of dhx15 knockout mutants. (A) A schematic showing the genomic organization of dhx15 with sequences of CRISPR target sites and mutant alleles shown underneath. For each target site, the sgRNA sequence is shown in bold, PAM sequence is underlined and the deleted nucleotides in hg92 and hg93 alleles are marked by dashes. The numbers above each sequence denote the location of sequence in the open reading frame (GenBank Accession number: NM_001115141). (B) A schematic of the Dhx15 protein showing its functional domain organization, location of mutations (red lines) and predicted mutant proteins for hg92 and hg93 alleles. (C–E) Expression and sequence confirmation of both mutant alleles by RT-PCR. (C) Gel image of RT-PCR products from embryos homozygous for both mutant alleles as marked above each lane, WT indicates wild-type control embryos, NTC indicates no template control. (D–E) Sequence chromatograms showing the WT alleles in top panel and mutant alleles in bottom panel for hg92 (D) and hg93 (E). The black rectangles mark the nucleotides that are deleted in the mutant fish.
Loss of Dhx15 leads to pleiotropic embryonic phenotypes and lethality
To determine the effect of dhx15 deficiency on development, we performed daily microscopic observations on the progeny from pairwise crosses of heterozygous fish for each mutant allele. Homozygous mutant embryos for both alleles exhibited morphologically similar phenotypes and are from here on out described collectively as ‘dhx15−/−’. The dhx15−/− embryos were morphologically indistinguishable from their WT and heterozygous clutch-mates for the first 2 days of development, most likely based on the maternal supply of dhx15 mRNA. At 3 dpf, the dhx15−/− embryos began to display an upward tail curvature which continued to get worse over time (Fig. 3, Supplementary Material, Fig. S3A). At 4 dpf, the dhx15−/− embryos started to exhibit defects predominantly in the anterior tissues which also showed higher level of dhx15 expression. The morphological defects included microcephaly, pericardial edema and defective pectoral fin and jaw development (Fig. 3, Supplementary Material, Fig. S3A). All mutant embryos died by 7 dpf (Supplementary Material, Fig. S3B). Thus, our data demonstrated an essential role of dhx15 during zebrafish embryonic development.
Figure 3.
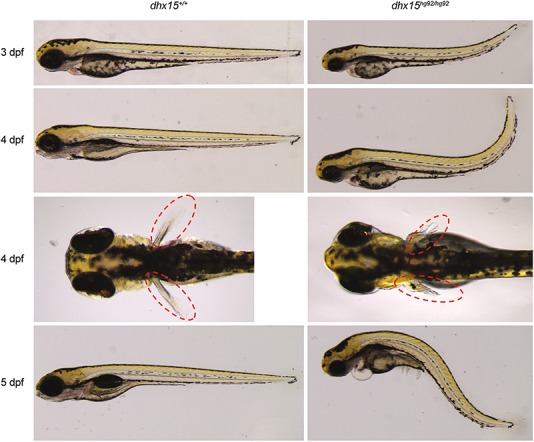
Morphological phenotype of dhx15 knockout embryos. Phenotype of dhx15hg92/hg92 embryos from 3 to 5 dpf is shown in the right panel with their corresponding WT siblings in the left panel. Lateral views of embryos are shown at each stage to illustrate the worsening tail curvature and appearance of pericardial edema. Dorsal views of 4 dpf embryos are shown to illustrate the deformed pectoral fins (red ovals) in mutant embryos.
To understand the role of DHX15 in AML, we examined the development of primitive and definitive hematopoiesis in dhx15−/− embryos using WISH with markers of hematopoietic lineages. The dhx15−/− embryos displayed similar sites and levels of expression for erythroid (gata1 and hbae1) and myeloid (lcp1) markers at 22 to 24 hpf and hematopoietic stem cell (HSC) marker runx1 at 36 hpf, indicating normal onset of primitive and definitive hematopoiesis (Supplementary Material, Fig. S4). This might be based on the compensation by the maternal supply of dhx15 mRNA. At 3 dpf, runx1 expression was still detectable in the aorta–gonad–mesonephros (AGM) region of dhx15−/− embryos while cmyb expression in the caudal hematopoietic tissue (CHT) was reduced, indicating delayed HSC migration from AGM to CHT (Supplementary Material, Fig. S4). As the embryos also begin to display pleiotropic morphological defects at 3 dpf, the altered expression of HSC markers maybe based on the developmental delay caused by general phenotypes. O-dianisidine staining revealed normal levels of red blood cells in dhx15−/− embryos at 2 and 4 dpf, ruling out the lack of circulating blood cells as the reason for their lethality (Supplementary Material, Fig. S4). To avoid the confounding secondary effects of morphological phenotypes on the expression of hematopoietic markers in dhx15−/− embryos, we did not evaluate hematopoiesis past 3 dpf. Thus, we were unable to reach a conclusion on the role of Dhx15 in hematopoietic differentiation based on the presence of maternally supplied dhx15 mRNA at earlier stages and morphological phenotypes at later stages of embryonic development.
Biological processes affected by Dhx15 deficiency
To gain further insights into the role of Dhx15 in biological processes, we analyzed transcriptome-wide effects of its loss of function by RNA-seq. We used RNA from 4 dpf embryos since the mutant embryos can be easily identified by their phenotype at this stage from the WT and heterozygous clutch-mates. RNA-seq was performed on triplicate samples from the following four groups of embryos: (1) hg92-KO: dhx15hg92/hg92, (2) hg93-KO: dhx15hg93/hg93, (3) hg92-WT (dhx15+/+ for hg92 allele) and (4) hg93-WT (dhx15+/+ for hg93 allele). RNA-seq reads were aligned using the alignment program STAR (27) (Supplementary Material, Table SS1). Hierarchical clustering and three-dimensional principal component analysis of aligned reads using the DESeq2 pipeline (28) showed that the triplicates for each group clustered together and there is some intrinsic variation between the two WT groups and two mutant groups (Fig. 4A and B). To account for this variation and identify genes affected by the Dhx15 deficiency, we analyzed the RNA-seq reads using another alignment program TopHat2 (29) (Supplementary Material, Table SS2). Using the cutoffs of log fold change > 2.0, padj < 0.005, we compared the differentially expressed gene lists from both programs for each mutant group with its respective WT control and also compared the two WT sets with each other (Supplementary Material, Table SS3, Fig. S5). The resulting gene lists were parsed to identify genes that were detected in both mutant comparisons but not in the hg92-WT to hg93-WT comparison, thus removing the genes dysregulated based on the intrinsic variations between different lines. These analyses led to the identification of 782 differentially expressed genes between dhx15−/− and dhx15+/+ embryos (Fig. 4C, Supplementary Material, Table SS4). Of these, 498 genes were downregulated and 284 genes were upregulated in the mutant embryos (Fig. 4D). Gene set enrichment analysis (GSEA) of the differentially expressed genes using the gene ontology (GO) term biological processes revealed that the processes for nucleosome assembly, chromatin assembly, DNA packaging and nucleosome organization are downregulated and the processes for regulation of cell communication and cell growth and response to stress and stimulus are upregulated in dhx15 knockout embryos (Fig. 4E). Thus, our data suggest that Dhx15 is important for chromatin and/or nucleosome assembly and regulation of cell growth.
Figure 4.
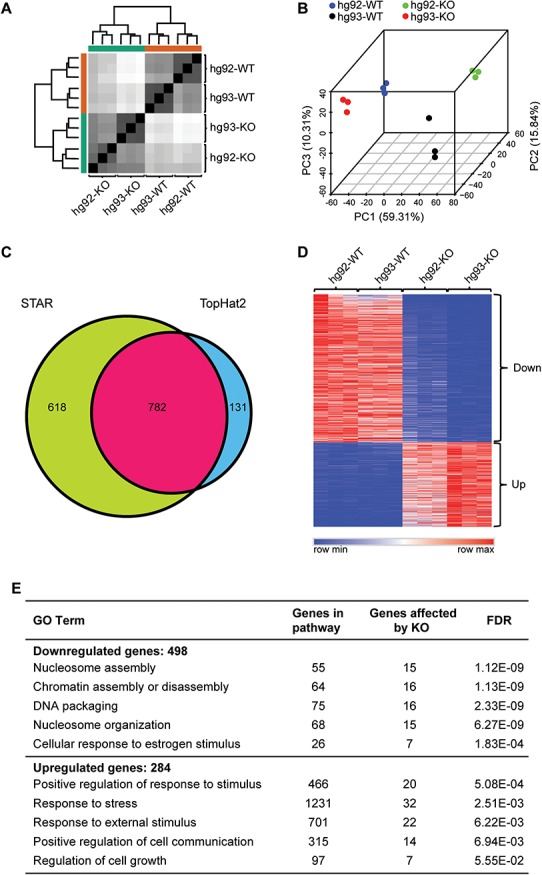
Transcriptome-wide effects of dhx15 knockout. (A–E) RNA-seq was performed in triplicates on 15 pooled embryos collected at 4 dpf from the following four genotype groups: dhx15hg92/hg92 (hg92-KO), dhx15hg93/hg93 (hg93-KO), hg92-WT and hg93-WT. (A) Hierarchical clustering showing separation of samples by their dhx15 genotype. (B) Three-dimensional principal component analysis plot showing clustering of triplicates for each sample and separations between the four groups. (C) Venn diagram showing the overlap between number of differentially expressed genes detected by the STAR and TopHat2 alignments. (D) Heatmap representation of 782 differentially expressed genes detected by both alignment programs in mutant embryos in contrast to their WT controls (fold change ≥2, P < 0.005). The color key is shown at the bottom. Genes downregulated in the mutants are marked as ‘Down’ and upregulated in the mutants are marked as ‘Up’. (E) Gene ontology terms affected by the loss of Dhx15 function.
Dhx15 is important for regulation of the MDM2-p53 pathway
Since Dhx15 is a splicing factor, we hypothesized that its loss of function may lead to global splicing defects. Therefore, we analyzed our STAR-aligned reads with multiple splicing analysis programs (rMATS (30), JunctionSeq (31) and MAJIQ (32)) to identify splicing defects in the dhx15−/− embryos. Using stringent criteria of detection by at least two programs, we identified alternate and or aberrant splicing events in 123 genes in dhx15−/− embryos (Supplementary Material, Table SS5). Closer inspection of the 123 alternately spliced genes and 782 differentially expressed genes revealed that 10 genes (a2ml, cfhl4, cyp27c1, myhb, zgc:112265, spink4, top2a, vmp1, mdm2, tp53) showed both splicing and expression changes in dhx15−/− embryos (Supplementary Material, Tables SS4 and SS5). Of these, mdm2 and tp53 caught our attention based on their roles as an oncogene and tumor suppressor, respectively (33, 34). The MDM2-p53 pathway is important for determining the cell-fate decisions in response to stress and other stimuli and is regulated by the complex interactions between different isoforms of both genes (33–35). Therefore, we examined the RNA-seq reads mapping to the mdm2 and tp53 transcripts to identify the specific isoforms expressed in dhx15−/− embryos.
In the mdm2 transcript, the dhx15−/− embryos exhibited increased expression of an exon within intron 1 (termed here as alternate exon 1) indicating alternate promoter usage and reduced retention of exon 3 indicating alternate splicing (Fig. 5A, Supplementary Material, Fig. S6). Both of these alternate splicing and promoter usage events were validated by regular or quantitative RT-PCR (qRT-PCR) (Fig. 5B and C). An additional less frequent aberrant splicing event that led to the retention of intron 2 in dhx15−/− embryos was also detected by RT-PCR (Fig. 5C, Supplementary Material. Fig. S7). Skipping of exon 3 causes an in-frame deletion of 25 amino acids and the retention of intron 2 causes premature truncation (Supplementary Material, Fig. S7), both affecting the p53-binding domain of the Mdm2 protein. The alternate first exon used in dhx15−/− embryos corresponds to the 5′ untranslated region (UTR) transcribed from the distal promoter P2, which is known to be triggered by activated p53 (33, 36). It has been shown that although the use of distal promoter P2 does not change the translation start site or the protein sequence of MDM2, it regulates its expression in response to activated p53 by the use of alternate 5′ UTR (36). Thus, our data suggest that the increased tp53 levels in dhx15−/− embryos caused an upregulation of mdm2 via the use of p53-dependent promoter P2. To test whether the alternate 5′ UTR impacts mdm2 expression in zebrafish, we fused the normal and alternate 5′ UTRs with an EGFP reporter, delivered the respective mRNAs into zebrafish embryos and evaluated the level of EGFP expression. With the same dose of mRNAs, we detected a robust and stronger EGFP expression driven by the alternate 5′ UTR in contrast to the UTR encoded by the normal first exon (Fig. 5D), indicating that this regulatory mechanism for mdm2 expression is evolutionarily conserved across species.
Figure 5.
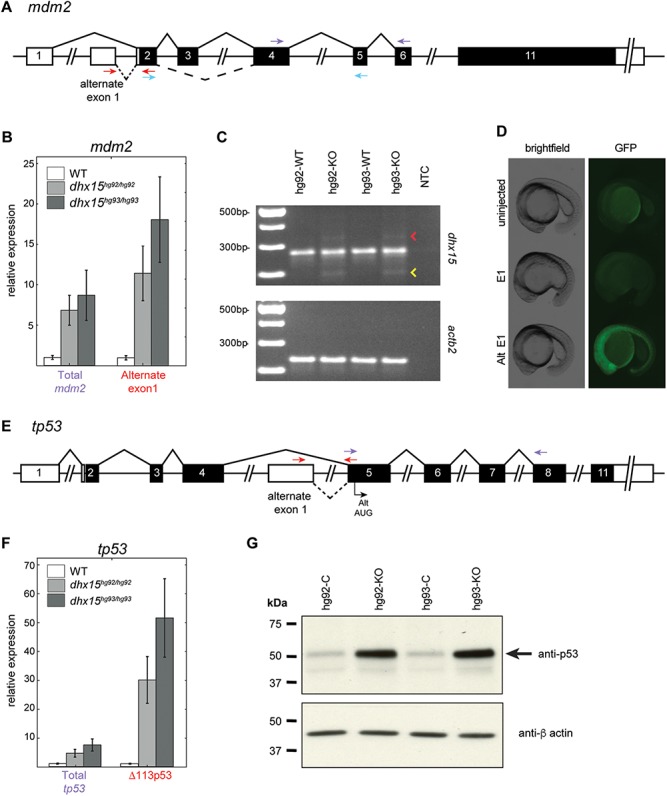
Effect of dhx15 knockout on tp53 and mdm2 expression and splicing. (A–C) Alternate splicing and upregulation of mdm2. (A) A schematic of the mdm2 genomic organization with alternate splicing events (dashed lines), qRT-PCR primers for ‘total mdm2’ (purple arrows), ‘alternate exon 1’ (red arrows) and RT-PCR primers (blue arrows) marked as described. (B) qRT-PCR showing the increased expression of mdm2 (Total mdm2) and its specific isoform resulting from the use of alternate exon 1. (C) Agarose gel images of RT-PCR products showing skipping of exon 3 (yellow arrowhead) and retention of intron 2 (red arrowhead) in mdm2. The lower panel shows RT-PCR with primers for actb2 as control for RNA quality. (D) Images of representative embryos showing the difference in EGFP expression driven by the mdm2 5′ UTR (E1) and alternate 5′ UTR (Alt E1). (E–G) Alternate splicing and upregulation of tp53. (E) A schematic of tp53 genomic organization showing the alternate exon 1, transcription start site of the isoform △113p53 (Alt AUG), qRT-PCR primers for ‘total tp53’ (blue arrows), ‘△113p53’ (red arrows) marked as described. (F) qRT-PCR showing the increased expression of tp53 (total tp53) and the specific △113p53 isoform. (G) Western blots showing the increased p53 protein levels in dhx15−/− embryos. hg92-KO and hg93-KO denote dhx15−/− embryos for each allele, and hg92-C and hg93-C denote control embryos for each allele, which were a mix of dhx15+/− and dhx15+/+ siblings. The lower panel shows immunoblot with anti β-actin antibody for loading control.
In the tp53 transcript, the dhx15−/− embryos exhibited a reduced expression of exons 1 to 4 that correspond to the full-length tp53 isoform and an increased expression of an alternate exon within intron 4 (termed here as alternate exon 1) that corresponds to the 5′ UTR of an alternate isoform Δ113p53 (Fig. 5E, Supplementary Material, Fig. S8). The zebrafish isoform Δ113p53 is orthologous to a well-characterized human isoform Δ133p53 (35). It lacks the first 113 amino acids (133 in human) from the N-terminal region of the protein comprising of the transactivation, MDM2-binding and part of DNA-binding domains and acts as a p53-response gene (35). qRT-PCR using primers specific to the isoform Δ113p53 or in part of the transcript shared by all isoforms confirmed the upregulation of total tp53 and the isoform Δ113p53 in dhx15−/− mutants (Fig. 5F, Supplementary Material, Table SS6). Availability of an antibody that recognizes the zebrafish full-length p53 protein (37) further allowed us to validate its upregulation at the protein level in mutant embryos (Fig. 5G). Taken together, our RNA-seq data has demonstrated that loss of Dhx15 affects the expression of tp53 isoforms through alternate promoter usage and mdm2 isoforms through both alternate splicing and promoter usage.
To determine the effect of increased p53 levels in the dhx15−/− mutants, we checked our list of 782 differentially expressed genes for any changes in known p53-responsive genes, such as cdkn1a (P21), bbc3 (PUMA), casp8, baxa (BAX), bcl2l1 (BCL-XL) and pmaip1 (NOXA). Of these, two genes involved in apoptosis, bbc3 and casp8, were among the upregulated genes in dhx15−/− embryos (Supplementary Material, Table SS4). Furthermore, TUNEL (terminal deoxynucleotidyl transferase dUTP nick end labeling) staining revealed an increased number of apoptotic cells, specifically in the head region of mutant embryos at 3 dpf in contrast to their WT and heterozygous siblings (Fig. 6A). Based on these observations, we hypothesized that the loss of tp53 may rescue the apoptosis caused by the loss of Dhx15. Therefore, we crossed dhx15+/− fish with our recently described tp53 knockout fish (tp53hg91: c.368_374delCCGTGGT; p.Ser123Phefs*38), where an exon common of all known tp53 isoforms was mutated (38) to generate double mutant fish. TUNEL staining showed that dhx15−/−; tp53−/− embryos exhibited the same apoptotic phenotype as dhx15−/− embryos (Fig. 6B). These findings demonstrated that despite the upregulation of tp53 in the absence of Dhx15 function, loss of tp53 alone does not rescue the phenotype in dhx15−/− embryos. Furthermore, mdm2 is significantly upregulated in tp53 knockout as well as double-knockout (dhx15−/−; tp53−/−) embryos (Supplementary Material, Fig. S9). Thus, the apoptotic phenotype is independent of p53 and Mdm2 and may involve other biological processes.
Figure 6.
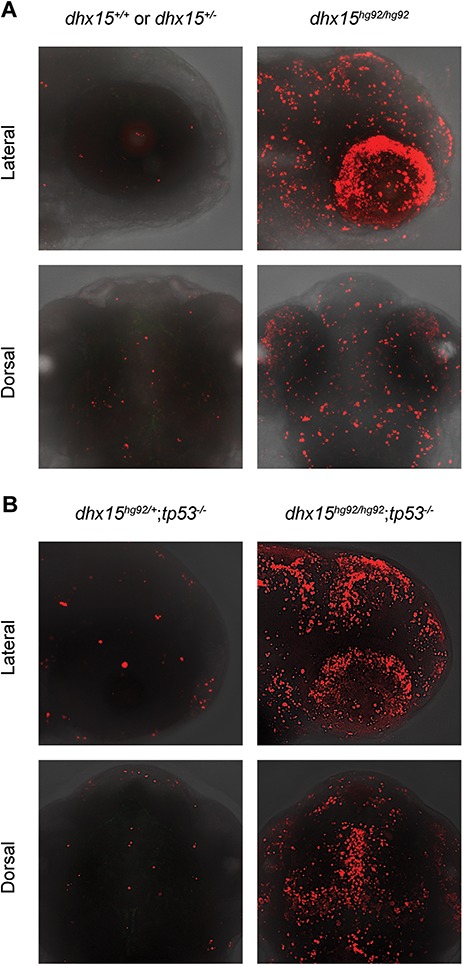
TUNEL staining of 3 dpf dhx15−/− embryos showing increased apoptosis. (A, B) Confocal images of the head region of TUNEL-stained 3 dpf embryos shown as lateral (upper panels) and dorsal views (lower panels). (A) Increased apoptosis (red fluorescence) is observed in dhx15−/− embryos (right panel) in contrast to their WT or heterozygous siblings. (B) tp53 knockout does not rescue the apoptotic defect as demonstrated by similar levels of staining in the dhx15−/−;tp53−/− (right panel) embryos.
Discussion
DHX15 is a member of the DEAH box containing RNA helicases that perform diverse biological functions (39). Functional studies of its yeast ortholog, Prp43, have demonstrated essential roles of DHX15 in splicing and ribosome biogenesis (11, 12, 19). Recent studies have reported a mutational hotspot in DHX15 in ∼ 6% of patients with t(8;21) AML as well as expression level changes in multiple cancers (3–10). Thus, it is imperative to define the in vivo roles of DHX15 during vertebrate development.
In this study, we describe the first vertebrate animal model of dhx15 knockout developed by the use of CRISPR/Cas9 technology in zebrafish. We generated two independent zebrafish lines with indels in dhx15, hg92 (p.Val113Glyfs*11) and hg93 (p.Gln189Argfs*10), and validated that they are true dhx15 knockout mutants by the fluorescent reporter assay (Supplementary Material, Fig. S2). Homozygous mutant embryos for both alleles exhibited similar pleiotropic morphological phenotypes and embryonic lethality. The overlap between the regions showing stronger dhx15 expression and deformed in its absence suggests that Dhx15 is important for the development of the brain, eyes and pectoral fins during embryogenesis. The mutant embryos seem to die based on severe morphological phenotypes and apoptosis in the head region. To date, mutagenesis screens in zebrafish have revealed that knockouts in ∼ 6% of genes exhibit embryonic phenotypes and lethality indicating their essential roles in development (40). Our study has added dhx15 to this list of genes that are essential during embryonic development in zebrafish.
Pan and colleagues (4) suggested that DHX15 plays a role in regulation of myeloid differentiation based on its expression levels in adult hematopoietic cells at different stages of differentiation. However, we detected neither dhx15 expression in hematopoietic-specific regions of the embryo by WISH nor any defects in the onset of primitive or definitive hematopoiesis in dhx15 mutants. It is possible that the dhx15−/− embryos develop normal hematopoiesis based on compensation by the maternally supplied dhx15 mRNA. The delayed differentiation of HSCs in dhx15 mutants is likely secondary to the morphological phenotypes. The embryonic lethality of our mutants precludes us from analysis of its role in adult hematopoiesis.
In order to gain insights into the function of Dhx15 in specific biological processes, we investigated transcriptome-wide effects of its deficiency by RNA-seq from 4 dpf dhx15−/− embryos. Genes involved in the biological processes of nucleosome assembly, chromatin assembly or disassembly, DNA packaging and nucleosome organization are downregulated in dhx15−/− mutants. These biological processes are critical for the maintenance of normal gene expression patterns by determining the open and closed states of chromatin and are often altered in cancer (41). Although DHX15 is a splicing factor, we did not observe a global effect of its deficiency on splicing. It is possible that the loss of Dhx15 causes tissue-specific splicing defects which are masked in our study based on the use of whole embryos for our RNA-seq analysis.
Among the few global splicing changes observed in the absence of Dhx15, upregulation of specific isoforms of mdm2 and tp53 via the use of alternate splicing and promoters is of interest. MDM2 and p53 make an autoregulatory negative feedback loop which is important for proper cell fate decisions, such as cell cycle arrest, senescence, apoptosis and cell survival (33, 35). The alternate promoters of tp53 and mdm2 preferentially used in the dhx15−/− mutants have been characterized as p53-dependent promoters (36, 42). Thus, we speculate that in the absence of Dhx15, tp53 expression is increased which in turn triggers the alternate distal promoters of mdm2 and tp53, leading to the expression of specific isoforms, mdm2-P2 and Δ113p53. These perturbations to the negative feedback loop between MDM2 and p53 may lead to the changes in the expression of p53 target genes involved in various cell fate decisions. We identified casp8 and bbc3 (p53 target genes involved in apoptosis) among the significantly upregulated genes in dhx15−/− embryos. As expected, increased apoptosis was observed in the mutant embryos. However, lack of rescue of apoptosis in double mutants (dhx15−/−; tp53−/−) suggests that p53 activation alone is not the cause of apoptotic phenotype in dhx15−/− embryos. MDM2 is known to have p53-independent activities that are also important for cell fate decisions (36). It is possible that the activation of p53-independent activities of Mdm2 via expression of its isoforms with disruptions to the p53-binding domain (Δ Exon 3, + intron 2) leads to apoptosis in dhx15−/− embryos. Our finding that the 5′ UTR encoded by the alternate first exon that is preferentially expressed in dhx15−/− embryos drives stronger EGFP expression than the normal 5′ UTR suggests elevated levels of Mdm2 protein in the mutants. Thus, our data suggest that increased apoptosis in the absence of Dhx15 is based on the complex interplay between the levels of various tp53 and mdm2 isoforms and other biological processes affected by its loss of function.
Intriguingly, upregulation of p53 has been reported as a common mechanism of action for many components of the splicing machinery by studies using zebrafish as well as cell lines (43–45). Furthermore, Danilova and colleagues (46) investigated p53 upregulation in several zebrafish mutants and concluded that it is a universal response to the loss of cell-essential genes, which may function in diverse biological processes including splicing. The upregulation of its specific isoform, Δ113p53, was also observed in another splicing factor, rnpc3 knockout zebrafish (47). Similarly, increased expression of MDM2 isoforms lacking most of the p53-binding domain was observed in response to the knockdown of splicing factor SF3B1 (44). As more studies are now employing RNA-seq-based global approaches to study splicing factor knockdown and knockout in cell lines and model organisms, we may see similar regulation of the MDM2-p53 pathway as a common mechanism of action for other splicing factors.
In conclusion, our study has characterized the in vivo roles of DHX15. We identified its roles in regulation of gene expression by participation in the nucleosome and chromatin dynamics and regulation of the MDM2-p53 pathway. Krejci and colleagues (48) reported that the p53 pathway is activated in cells expressing the RUNX1-RUNX1T1 fusion protein. One of the possible mechanisms for the p53 activation in patients with RUNX1-RUNX1T1 fusion protein is the loss of DHX15 function through the R222G somatic mutation. The logical next step in further understanding of the cooperation between DHX15-R222G and RUNX1-RUNX1T1 is to generate zebrafish models with Dhx15-R196G (equivalent to R222G) and RUNX1-RUNX1-T1 fusion protein using targeted knock-in approaches.
Materials and Methods
Zebrafish husbandry and ethics statement
All zebrafish experiments were performed in compliance with the National Institutes of Health guidelines for animal handling and research using an Animal Care and Use Committee (ACUC) approved protocol G-05-5 assigned to RS. WT zebrafish strain TAB5 was used for all experiments. Zebrafish husbandry and embryo staging were performed as described previously (49).
Generation of dhx15 mutants and genotyping
Single guide RNAs (sgRNAs) to target exons 2 (GGCTGCAGTTGCCCGTCT) and 3 (GGATGTCATGCTGGGTCAGG) of dhx15 (GenBank Accession number: NM_001115141) were designed using the ‘ZebrafishGenomics’ track on the UCSC Genome Browser. Synthesis of target-specific oligonucleotides (Integrated DNA Technologies), preparation of mRNA, microinjections and mutant generation were carried out as described previously (50). The following primer sets with M13F (on forward primers) and PIGtail (on reverse primers) were used for genotyping by fluorescent PCR: Exon2-F (5′-AGAGACAGCAAGTCGTCGAG); Exon2-R (5′-AGCACAAAGCTCTGATGGC), Exon3-F (5′-TGTGTTGACATGGTCAGG); and Exon3-R (5′-GCAATGACTTACTTTAGTATGG) as described previously (50).
Fluorescent reporter assay to confirm frameshift mutations
This assay was performed as described (26) using dhx15 reporter assay primers listed in Supplementary Material, Table SS6. RT-PCR was performed using the RNA extracted from heterozygous embryos, SuperScript III One-Step RT-PCR System (Thermo Fisher Scientific) and the following conditions: 50°C for 30 min, 94°C for 2 min; 40 cycles of 94°C for 15 s, 57°C for 30 s, 72°C for 2 min; 72°C for 10 min. RT-PCR products were cloned into the GFP reporter vector and sequenced to identify WT and mutant clones. The RFP reporter plasmid, pCS2-TagRFPT.zf1 (51), was used for positive control. mRNAs from the GFP and RFP reporter plasmids were synthesized using T3 and SP6 mMessage mMachine Kits (Thermo Fisher Scientific), respectively. For each mutant allele, a mix of mRNA for the WT-GFP or mutant-GFP reporter (200 pg) and the control RFP reporter (100 pg) was injected into one-cell embryos. The injected embryos were imaged for RFP and GFP fluorescence at 1 dpf on a Leica MZ16F microscope with an AxioCam HRc camera using ZEN lit 2012 (Blue edition).
Generation of dhx15 probe, whole-mount in situ hybridization and o-dianisidine staining
To generate a probe for the analysis of dhx15 expression by WISH, we performed RT-PCR using primers in exons 9 and 14 (Supplementary Material, Table SS6) and RNA from 3 dpf WT embryos. The RT-PCR product was cloned in the pCR II-TOPO vector, sequence verified and used to synthesize antisense probe with the T7 DIG RNA labeling kit after HindIII digestion (Roche). Antisense probes for the following hematopoietic markers, gata1, hbae1, mpx, lcp, runx1 and c-myb, were also generated using a DIG labeling kit (Roche). Zebrafish embryos from in-crosses of dhx15hg92/+, dhx15hg93/+ or dhx15+/+ fish were collected at a series of developmental stages, euthanized and fixed overnight in 4% PFA at 4°C. WISH was carried out as previously described (52, 53).
RNA extraction and sequencing
Pairwise in-crosses of dhx15+/− fish were set up for both alleles, and mutant embryos were identified by their morphological phenotype at 4 dpf. Fifteen embryos of each genotype, dhx15hg92/hg92 and dhx15hg93/hg93, were pooled for RNA extraction. For their corresponding WT controls, embryos were collected from pairwise crosses of dhx15+/+ siblings of dhx15hg92/+ and dhx15hg93/+ fish. Embryos were euthanized and dissociated into cells as described (54). ZR-Duet DNA/RNA MiniPrep Kit (Zymo Research) was used to extract DNA and RNA following the manufacturer’s instructions. DNA was used to confirm genotypes of all groups by PCR and sequencing. RNA was evaluated for quality and concentration using a bioanalyzer and used for sequencing (RNA-seq) at the NIH Intramural Sequencing Center. Ribo-Zero Gold rRNA Removal Kit (Illumina) was used to remove ribosomal RNA. Sequencing libraries were prepared with the TruSeq RNA Library Prep Kit (Illumina) and run on a HiSeq 2500 instrument (Illumina). All samples were sequenced to the depth of 50 million paired-end 126 bp reads.
Bioinformatics
We processed the RNA-seq data using two pipelines and multiple sample-to-sample comparisons (dhx15hg92/hg92 vs hg92-WT; dhx15hg93/hg93 vs hg93-WT; hg92-WT vs hg93-WT) in order to identify the differentially expressed genes (DEGs) that are definitely based on the loss of Dhx15 activity. In the first pipeline, FastQC 0.11.5 (http://www.bioinformatics.babraham.ac.uk/projects/fastqc) was used for quality control of fastq files. Read filtering and read trimming were performed using Trimmomatic V0.36 (55). Reads were then aligned to the zebrafish genome (GRCz10) using STAR aligner V2.5.3 (27). Reads were quantified with RSEM V1.3.0 (56) by calculating transcripts per million mapped reads (TPM). Differential gene expression analysis was performed using DESeq2 (28). In the second pipeline, reads were aligned with TopHat2 V2.0.12 (29) and quantified with HTSeq V0.6.1 (57) using fragments per kilobase per million (FPKM). Differential gene expression analysis was performed using DESeq V1.18.0 (58).
Alternate splicing analysis was performed on the files from STAR alignment using rMATS V3.2.5 (30), JunctionSeq V1.8.0 (31) and MAJIQ V1.0.5 (32). All three programs were used to detect both annotated (Ensembl GRCz10 release 88) and novel splicing events. rMATS did not require any further processing of the STAR aligned files. For JunctionSeq analysis, the first a.gff file with potential novel splice junctions was created with QoRTs V1.3.0 (59). Splicing analysis was then performed in R using the JunctionSeq program. MAJIQ analysis was performed by using the MAJIQ builder to quantify local splice variations across all samples and then the MAJIQ dPSI tool to calculate differential expression of splice variants. Fold change and FDR of alternately spliced junctions was calculated by all three programs.
RT-PCR and qRT-PCR
All primers used for RT-PCR and qRT-PCR are listed in Supplementary Table SS6. The qRT-PCR primers used to determine the expression of total tp53 were as described (60). Five hundred nanograms of RNA was used to synthesize cDNA using the SuperScript III First-Strand Synthesis Kit (Invitrogen). RT-PCR reactions were performed with 2 μl of cDNA (∼30 ng/μl) and Platinum Taq (Invitrogen) with the following conditions: 94°C for 2 min; 37 cycles (dhx15) or 30 cycles (actb2) of 94°C for 30 s, 57°C for 30 s, 72°C for 1 min. Products were analyzed on a 2% agarose gel. qRT-PCR was performed on an ABI PRISM 7000 or QuantStudio 3 systems using the SYBR Green PCR Master Mix (Thermo Fisher Scientific) with the following PCR conditions: 50°C for 2 min, 95°C for 10 min; 40 cycles of 95°C for 15 s, 60°C for 1 min. Data were analyzed using ABI Prism 7000 software with a minimum detection threshold of 0.4.
Mdm2 5′ UTR-EGFP constructs and expression analysis
Two 5′ UTR sequences of mdm2 corresponding to exon 1 and alternate exon 1 (Fig. 5A) were analyzed to evaluate their effect on Mdm2 expression using EGFP as a fluorescent reporter. Two gene blocks were created as follows: each gene block started with a T3 RNA polymerase binding sequence, followed by 5′ UTR as transcribed from exon 1 and EGFP coding sequence or alternate 5′ UTR as transcribed from the alternate exon 1 and EGFP coding sequence, and ending with a poly-A sequence (Supplementary Material, Fig. S10). These gene blocks were used for in vitro mRNA synthesis using mMessage mMachine T3 Transcription Kit (Thermo Fisher Scientific. Cat#: A1348). mRNAs were injected into the cytoplasm of one-cell stage zebrafish embryos. EGFP expression was examined and imaged under a fluorescent microscope.
Western blot analysis
Embryos collected at 4 dpf from crosses between dhx15+/− fish for both alleles were deyolked and homogenized using TissueRuptor (Qiagen) in cell lysis buffer (Cell Signaling Technology) containing protease inhibitor cocktail (Thermo Fisher Scientific). The homogenates were centrifuged to remove the cellular debris, and the supernatant was used to prepare loading samples in Laemmli sample buffer (Bio-Rad). The samples were resolved on a 4–15% TGX gel (Bio-Rad) and transferred onto 0.45 micron PVDF membranes (Invitrogen). The blots were probed using anti-p53 antibody (Abcam; ab77813) and anti β-actin antibody (Abcam; ab6276) at 1:400 and 1:500 dilutions, respectively.
Whole-mount TUNEL staining
Embryos from in-crosses of dhx15hg92/+, dhx15hg93/+ or dhx15+/−; tp53+/− were collected at 3 dpf, euthanized and fixed overnight in 4% PFA at 4°C. Fixed embryos were dehydrated through washes in serial dilution of methanol/1× PBS and stored in 100% methanol at −20°C for a minimum of 12 h. The embryos were then rehydrated through washes in methanol/1× PBST (with 0.1% Tween) and permeabilized with Proteinase K treatment for 10 min. TUNEL staining was performed using the In Situ Cell Death Detection Kit, TMR red (Roche) following the manufacturer’s instructions. The labeled embryos were evaluated with RFP fluorescence and confocal microscopy, imaged and genotyped.
Imaging
To record morphological phenotypes during development, embryos were imaged using a Leica M125 microscope equipped with a MC170HD camera and the Leica Application Suite (LAS) V4.4 software. For WISH-stained embryos, images were taken on a Leica MZ16F microscope equipped with an AxioCam HRc camera using ZEN lite 2012 (Blue edition). For TUNEL-stained embryos, confocal images were acquired with a Zeiss LSM 880 with Airyscan and the ZEN Black software.
Supplementary Material
Acknowledgements
We are thankful for the excellent animal care provided by the Charles River staff of our zebrafish facility. We thank Ms Beatrice Sun for generating the probe for dhx15 WISH during her summer internship in our laboratory. We thank Dr Alberto Rissone and Ms Lisha Xu for help with qRT-PCR, Dr Erica Bresciani for reviewing the hematopoietic WISH data and Ms Julia Fekecs for assistance with the figures. We thank Drs Gretchen Gibney and Andy Baxevanis for their help in computational analysis of the effect of R222G mutation on DHX15 function. This work utilized the computational resources of the NIH HPC Biowulf cluster (http://hpc.nih.gov). .
Funding
This research was supported by the Intramural Research Program of the National Human Genome Research Institute, National Institutes of Health (ZIC HG200351)
Conflict of Interest statement. None declared.
References
- 1. Faber Z.J., Chen X., Gedman A.L., Boggs K., Cheng J., Ma J., Radtke I., Chao J.R., Walsh M.P., Song G. et al. (2016) The genomic landscape of core-binding factor acute myeloid leukemias. Nat. Genet., 48, 1551–1556. [DOI] [PMC free article] [PubMed] [Google Scholar]
- 2. Farrar J.E., Schuback H.L., Ries R.E., Wai D., Hampton O.A., Trevino L.R., Alonzo T.A., Guidry Auvil J.M., Davidsen T.M., Gesuwan P. et al. (2016) Genomic profiling of pediatric acute myeloid leukemia reveals a changing mutational landscape from disease diagnosis to relapse. Cancer Res., 76, 2197–2205. [DOI] [PMC free article] [PubMed] [Google Scholar]
- 3. Sood R., Hansen N.F., Donovan F.X., Carrington B., Bucci D., Maskeri B., Young A., Trivedi N.S., Kohlschmidt J., Stone R.M. et al. (2016) Somatic mutational landscape of AML with inv(16) or t(8,21) identifies patterns of clonal evolution in relapse leukemia. Leukemia, 30, 501–504. [DOI] [PMC free article] [PubMed] [Google Scholar]
- 4. Pan L., Li Y., Zhang H.Y., Zheng Y., Liu X.L., Hu Z., Wang Y., Wang J., Cai Y.H., Liu Q. et al. (2017) DHX15 is associated with poor prognosis in acute myeloid leukemia (AML) and regulates cell apoptosis via the NF-kB signaling pathway. Oncotarget, 8, 89643–89654. [DOI] [PMC free article] [PubMed] [Google Scholar]
- 5. Madan V., Han L., Hattori N., Teoh W.W., Mayakonda A., Sun Q.Y., Ding L.W., Nordin H.B.M., Lim S.L., Shyamsunder P. et al. (2018) ASXL2 regulates hematopoiesis in mice and its deficiency promotes myeloid expansion. Haematologica, 103, 1980–1990. [DOI] [PMC free article] [PubMed] [Google Scholar]
- 6. Christen F., Hoyer K., Yoshida K., Hou H.A., Waldhueter N., Heuser M., Hills R.K., Chan W., Hablesreiter R., Blau O. et al. (2019) Genomic landscape and clonal evolution of acute myeloid leukemia with t(8,21): an international study on 331 patients. Blood, 133, 1140–1151. [DOI] [PubMed] [Google Scholar]
- 7. Sveen A., Kilpinen S., Ruusulehto A., Lothe R.A. and Skotheim R.I. (2016) Aberrant RNA splicing in cancer; expression changes and driver mutations of splicing factor genes. Oncogene, 35, 2413–2427. [DOI] [PubMed] [Google Scholar]
- 8. Ito S., Koso H., Sakamoto K. and Watanabe S. (2017) RNA helicase DHX15 acts as a tumour suppressor in glioma. Br. J. Cancer, 117, 1349–1359. [DOI] [PMC free article] [PubMed] [Google Scholar]
- 9. Jing Y., Nguyen M.M., Wang D., Pascal L.E., Guo W., Xu Y., Ai J., Deng F.M., Masoodi K.Z., Yu X. et al. (2018) DHX15 promotes prostate cancer progression by stimulating Siah2-mediated ubiquitination of androgen receptor. Oncogene, 37, 638–650. [DOI] [PMC free article] [PubMed] [Google Scholar]
- 10. Xie C., Liao H., Zhang C. and Zhang S. (2019) Overexpression and clinical relevance of the RNA helicase DHX15 in hepatocellular carcinoma. Hum. Pathol., 84, 213–220. [DOI] [PubMed] [Google Scholar]
- 11. Arenas J.E. and Abelson J.N. (1997) Prp43: an RNA helicase-like factor involved in spliceosome disassembly. Proc. Natl. Acad. Sci U S A, 94, 11798–11802. [DOI] [PMC free article] [PubMed] [Google Scholar]
- 12. Martin A., Schneider S. and Schwer B. (2002) Prp43 is an essential RNA-dependent ATPase required for release of lariat-intron from the spliceosome. J. Biol. Chem., 277, 17743–17750. [DOI] [PubMed] [Google Scholar]
- 13. Yoshida K., Sanada M., Shiraishi Y., Nowak D., Nagata Y., Yamamoto R., Sato Y., Sato-Otsubo A., Kon A., Nagasaki M. et al. (2011) Frequent pathway mutations of splicing machinery in myelodysplasia. Nature, 478, 64–69. [DOI] [PubMed] [Google Scholar]
- 14. Dolnik A., Engelmann J.C., Scharfenberger-Schmeer M., Mauch J., Kelkenberg-Schade S., Haldemann B., Fries T., Kronke J., Kuhn M.W., Paschka P. et al. (2012) Commonly altered genomic regions in acute myeloid leukemia are enriched for somatic mutations involved in chromatin remodeling and splicing. Blood, 120, e83–e92. [DOI] [PubMed] [Google Scholar]
- 15. Polprasert C., Schulze I., Sekeres M.A., Makishima H., Przychodzen B., Hosono N., Singh J., Padgett R.A., Gu X., Phillips J.G. et al. (2015) Inherited and somatic defects in DDX41 in myeloid neoplasms. Cancer Cell, 27, 658–670. [DOI] [PMC free article] [PubMed] [Google Scholar]
- 16. Pellagatti A. and Boultwood J. (2017) Splicing factor gene mutations in the myelodysplastic syndromes: impact on disease phenotype and therapeutic applications. Adv. Biol. Regul., 63, 59–70. [DOI] [PubMed] [Google Scholar]
- 17. Maleki Y., Alahbakhshi Z., Heidari Z., Moradi M.T., Rahimi Z., Yari K., Rahimi Z., Aznab M., Ahmadi-Khajevand M. and Bahremand F. (2019) NOTCH1, SF3B1, MDM2 and MYD88 mutations in patients with chronic lymphocytic leukemia. Oncol. Lett., 17, 4016–4023. [DOI] [PMC free article] [PubMed] [Google Scholar]
- 18. Seiler M., Peng S., Agrawal A.A., Palacino J., Teng T., Zhu P., Smith P.G., Cancer Genome Atlas Research N., Buonamici S. and Yu L. (2018) Somatic mutational landscape of splicing factor genes and their functional consequences across 33 cancer types. Cell Rep., 23, 282, e284–296. [DOI] [PMC free article] [PubMed] [Google Scholar]
- 19. Combs D.J., Nagel R.J., Ares M., J. and Stevens S.W. (2006) Prp43p is a DEAH-box spliceosome disassembly factor essential for ribosome biogenesis. Mol. Cell Biol., 26, 523–534. [DOI] [PMC free article] [PubMed] [Google Scholar]
- 20. He Y., Andersen G.R. and Nielsen K.H. (2010) Structural basis for the function of DEAH helicases. EMBO Rep., 11, 180–186. [DOI] [PMC free article] [PubMed] [Google Scholar]
- 21. Walbott H., Mouffok S., Capeyrou R., Lebaron S., Humbert O., van Tilbeurgh H., Henry Y. and Leulliot N. (2010) Prp43p contains a processive helicase structural architecture with a specific regulatory domain. EMBO J., 29, 2194–2204. [DOI] [PMC free article] [PubMed] [Google Scholar]
- 22. Tauchert M.J., Fourmann J.B., Christian H., Luhrmann R. and Ficner R. (2016) Structural and functional analysis of the RNA helicase Prp43 from the thermophilic eukaryote Chaetomium thermophilum. Acta Crystallogr. F Struct. Biol. Commun., 72, 112–120. [DOI] [PMC free article] [PubMed] [Google Scholar]
- 23. He Y., Staley J.P., Andersen G.R. and Nielsen K.H. (2017) Structure of the DEAH/RHA ATPase Prp43p bound to RNA implicates a pair of hairpins and motif Va in translocation along RNA. RNA (New York N.Y.), 23, 1110–1124. [DOI] [PMC free article] [PubMed] [Google Scholar]
- 24. Murakami K., Nakano K., Shimizu T. and Ohto U. (2017) The crystal structure of human DEAH-box RNA helicase 15 reveals a domain organization of the mammalian DEAH/RHA family. Acta Crystallogr. F Struct. Biol. Commun., 73, 347–355. [DOI] [PMC free article] [PubMed] [Google Scholar]
- 25. Tauchert M.J., Fourmann J.B., Luhrmann R. and Ficner R. (2017) Structural insights into the mechanism of the DEAH-box RNA helicase Prp43. Elife, 6. [DOI] [PMC free article] [PubMed] [Google Scholar]
- 26. Prykhozhij S.V., Steele S.L., Razaghi B. and Berman J.N. (2017) A rapid and effective method for screening, sequencing and reporter verification of engineered frameshift mutations in zebrafish. Dis. Model Mech., 10, 811–822. [DOI] [PMC free article] [PubMed] [Google Scholar]
- 27. Dobin A., Davis C.A., Schlesinger F., Drenkow J., Zaleski C., Jha S., Batut P., Chaisson M. and Gingeras T.R. (2013) STAR: ultrafast universal RNA-seq aligner. Bioinformatics, 29, 15–21. [DOI] [PMC free article] [PubMed] [Google Scholar]
- 28. Love M.I., Huber W. and Anders S. (2014) Moderated estimation of fold change and dispersion for RNA-seq data with DESeq2. Genome Biol., 15, 550. [DOI] [PMC free article] [PubMed] [Google Scholar]
- 29. Kim D., Pertea G., Trapnell C., Pimentel H., Kelley R. and Salzberg S.L. (2013) TopHat2: accurate alignment of transcriptomes in the presence of insertions, deletions and gene fusions. Genome Biol., 14, R36. [DOI] [PMC free article] [PubMed] [Google Scholar]
- 30. Shen S., Park J.W., Lu Z.X., Lin L., Henry M.D., Wu Y.N., Zhou Q. and Xing Y. (2014) rMATS: robust and flexible detection of differential alternative splicing from replicate RNA-Seq data. Proc. Natl. Acad. Sci U S A, 111, E5593–E5601. [DOI] [PMC free article] [PubMed] [Google Scholar]
- 31. Hartley S.W. and Mullikin J.C. (2016) Detection and visualization of differential splicing in RNA-Seq data with JunctionSeq. Nucleic Acids Res., 44, e127. [DOI] [PMC free article] [PubMed] [Google Scholar]
- 32. Vaquero-Garcia J., Barrera A., Gazzara M.R., Gonzalez-Vallinas J., Lahens N.F., Hogenesch J.B., Lynch K.W. and Barash Y. (2016) A new view of transcriptome complexity and regulation through the lens of local splicing variations. Elife, 5, e11752. [DOI] [PMC free article] [PubMed] [Google Scholar]
- 33. Nag S., Qin J., Srivenugopal K.S., Wang M. and Zhang R. (2013) The MDM2-p53 pathway revisited. J. Biomed Res., 27, 254–271. [DOI] [PMC free article] [PubMed] [Google Scholar]
- 34. Aubrey B.J., Kelly G.L., Janic A., Herold M.J. and Strasser A. (2018) How does p53 induce apoptosis and how does this relate to p53-mediated tumour suppression? Cell Death Differ., 25, 104–113. [DOI] [PMC free article] [PubMed] [Google Scholar]
- 35. Joruiz S.M. and Bourdon J.C. (2016) p53 isoforms: key regulators of the cell fate decision. Cold Spring Harb Perspect. Med., 6. [DOI] [PMC free article] [PubMed] [Google Scholar]
- 36. Manfredi J.J. (2010) The Mdm2-p53 relationship evolves: Mdm2 swings both ways as an oncogene and a tumor suppressor. Genes Dev., 24, 1580–1589. [DOI] [PMC free article] [PubMed] [Google Scholar]
- 37. Shi H., Tao T., Huang D., Ou Z., Chen J. and Peng J. (2015) A naturally occurring 4-bp deletion in the intron 4 of p53 creates a spectrum of novel p53 isoforms with anti-apoptosis function. Nucleic Acids Res., 43, 1035–1043. [DOI] [PMC free article] [PubMed] [Google Scholar]
- 38. Ramanagoudr-Bhojappa R., Carrington B., Ramaswami M., Bishop K., Robbins G.M., Jones M., Harper U., Frederickson S.C., Kimble D.C., Sood R. et al. (2018) Multiplexed CRISPR/Cas9-mediated knockout of 19 Fanconi anemia pathway genes in zebrafish revealed their roles in growth, sexual development and fertility. PLoS Genet., 14, e1007821. [DOI] [PMC free article] [PubMed] [Google Scholar]
- 39. Bleichert F. and Baserga S.J. (2007) The long unwinding road of RNA helicases. Mol. Cell, 27, 339–352. [DOI] [PubMed] [Google Scholar]
- 40. Kettleborough R.N., Busch-Nentwich E.M., Harvey S.A., Dooley C.M., de Bruijn E., van Eeden F., Sealy I., White R.J., Herd C., Nijman I.J. et al. (2013) A systematic genome-wide analysis of zebrafish protein-coding gene function. Nature, 496, 494–497. [DOI] [PMC free article] [PubMed] [Google Scholar]
- 41. Nebbioso A., Tambaro F.P., Dell'Aversana C. and Altucci L. (2018) Cancer epigenetics: moving forward. PLoS Genet., 14, e1007362. [DOI] [PMC free article] [PubMed] [Google Scholar]
- 42. Chen J., Ng S.M., Chang C., Zhang Z., Bourdon J.C., Lane D.P. and Peng J. (2009) p53 isoform delta113p53 is a p53 target gene that antagonizes p53 apoptotic activity via BclxL activation in zebrafish. Genes Dev., 23, 278–290. [DOI] [PMC free article] [PubMed] [Google Scholar]
- 43. English M.A., Lei L., Blake T., Wincovitch S.M. Sr., Sood R., Azuma M., Hickstein D. and Liu P.P. (2012) Incomplete splicing, cell division defects, and hematopoietic blockage in dhx8 mutant zebrafish. Dev. Dyn., 241, 879–889. [DOI] [PMC free article] [PubMed] [Google Scholar]
- 44. Allende-Vega N., Dayal S., Agarwala U., Sparks A., Bourdon J.C. and Saville M.K. (2013) p53 is activated in response to disruption of the pre-mRNA splicing machinery. Oncogene, 32, 1–14. [DOI] [PubMed] [Google Scholar]
- 45. Lei L., Yan S.Y., Yang R., Chen J.Y., Li Y., Bu Y., Chang N., Zhou Q., Zhu X., Li C.Y. et al. (2017) Spliceosomal protein eftud2 mutation leads to p53-dependent apoptosis in zebrafish neural progenitors. Nucleic Acids Res., 45, 3422–3436. [DOI] [PMC free article] [PubMed] [Google Scholar]
- 46. Danilova N., Kumagai A. and Lin J. (2010) p53 upregulation is a frequent response to deficiency of cell-essential genes. PLoS One, 5, e15938. [DOI] [PMC free article] [PubMed] [Google Scholar]
- 47. Markmiller S., Cloonan N., Lardelli R.M., Doggett K., Keightley M.C., Boglev Y., Trotter A.J., Ng A.Y., Wilkins S.J., Verkade H. et al. (2014) Minor class splicing shapes the zebrafish transcriptome during development. Proc. Natl. Acad. Sci. U S A, 111, 3062–3067. [DOI] [PMC free article] [PubMed] [Google Scholar]
- 48. Krejci O., Wunderlich M., Geiger H., Chou F.S., Schleimer D., Jansen M., Andreassen P.R. and Mulloy J.C. (2008) p53 signaling in response to increased DNA damage sensitizes AML1-ETO cells to stress-induced death. Blood, 111, 2190–2199. [DOI] [PMC free article] [PubMed] [Google Scholar]
- 49. Westerfield M. (2007) The zebrafish book In A Guide for the Laboratory Use of Zebrafish (Danio rerio), 5th edn. M. Westerfield, Eugene, OR. [Google Scholar]
- 50. Varshney G.K., Carrington B., Pei W., Bishop K., Chen Z., Fan C., Xu L., Jones M., LaFave M.C., Ledin J. et al. (2016) A high-throughput functional genomics workflow based on CRISPR/Cas9-mediated targeted mutagenesis in zebrafish. Nat. Protoc., 11, 2357–2375. [DOI] [PMC free article] [PubMed] [Google Scholar]
- 51. Horstick E.J., Jordan D.C., Bergeron S.A., Tabor K.M., Serpe M., Feldman B. and Burgess H.A. (2015) Increased functional protein expression using nucleotide sequence features enriched in highly expressed genes in zebrafish. Nucleic Acids Res., 43, e48. [DOI] [PMC free article] [PubMed] [Google Scholar]
- 52. Thisse C. and Thisse B. (2008) High-resolution in situ hybridization to whole-mount zebrafish embryos. Nat. Protoc., 3, 59–69. [DOI] [PubMed] [Google Scholar]
- 53. Detrich H.W.,. 3rd, Kieran M.W., Chan F.Y., Barone L.M., Yee K., Rundstadler J.A., Pratt S., Ransom D. and Zon L.I. (1995) Intraembryonic hematopoietic cell migration during vertebrate development. Proc. Natl. Acad. Sci. U S A, 92, 10713–10717. [DOI] [PMC free article] [PubMed] [Google Scholar]
- 54. Bresciani E., Broadbridge E. and Liu P.P. (2018) An efficient dissociation protocol for generation of single cell suspension from zebrafish embryos and larvae. MethodsX, 5, 1287–1290. [DOI] [PMC free article] [PubMed] [Google Scholar]
- 55. Bolger A.M., Lohse M. and Usadel B. (2014) Trimmomatic: a flexible trimmer for Illumina sequence data. Bioinformatics, 30, 2114–2120. [DOI] [PMC free article] [PubMed] [Google Scholar]
- 56. Li B. and Dewey C.N. (2011) RSEM: accurate transcript quantification from RNA-Seq data with or without a reference genome. BMC Bioinformatics, 12, 323. [DOI] [PMC free article] [PubMed] [Google Scholar]
- 57. Anders S., Pyl P.T. and Huber W. (2015) HTSeq-a Python framework to work with high-throughput sequencing data. Bioinformatics, 31, 166–169. [DOI] [PMC free article] [PubMed] [Google Scholar]
- 58. Anders S. and Huber W. (2010) Differential expression analysis for sequence count data. Genome Biol., 11, R106. [DOI] [PMC free article] [PubMed] [Google Scholar]
- 59. Hartley S.W. and Mullikin J.C. (2015) QoRTs: a comprehensive toolset for quality control and data processing of RNA-Seq experiments. BMC Bioinformatics, 16, 224. [DOI] [PMC free article] [PubMed] [Google Scholar]
- 60. Chen J., Ruan H., Ng S.M., Gao C., Soo H.M., Wu W., Zhang Z., Wen Z., Lane D.P. and Peng J. (2005) Loss of function of def selectively up-regulates Delta113p53 expression to arrest expansion growth of digestive organs in zebrafish. Genes Dev., 19, 2900–2911. [DOI] [PMC free article] [PubMed] [Google Scholar]
Associated Data
This section collects any data citations, data availability statements, or supplementary materials included in this article.