

A large quantity of soil organic carbon frozen in permafrost on the Tibetan Plateau will be at risk under future climate warming.
Abstract
Soil organic carbon (SOC) stored in permafrost across the high-latitude/altitude Northern Hemisphere represents an important potential carbon source under future warming. Here, we provide a comprehensive investigation on the spatiotemporal dynamics of SOC over the high-altitude Tibetan Plateau (TP), which has received less attention compared with the circum-Arctic region. The permafrost region covers ~42% of the entire TP and contains ~37.21 Pg perennially frozen SOC at the baseline period (2006–2015). With continuous warming, the active layer is projected to further deepen, resulting in ~1.86 ± 0.49 Pg and ~3.80 ± 0.76 Pg permafrost carbon thawing by 2100 under moderate and high representative concentration pathways (RCP4.5 and RCP8.5), respectively. This could largely offset the regional carbon sink and even potentially turn the region into a net carbon source. Our findings also highlight the importance of deep permafrost thawing that is generally ignored in current Earth system models.
INTRODUCTION
Permafrost is defined as the subsurface material at or below 0°C for at least two consecutive years, which underlies about one-quarter of the land area in the Northern Hemisphere (1, 2). Recent observations reveal widespread permafrost degradation in the Northern Hemisphere, including rising ground temperature at the global scale (3) and thickening active layer in circum-Arctic and alpine permafrost regions (4). It has been estimated that the circum-Arctic permafrost regions contain 1460 to 1600 Pg soil organic carbon (SOC), about twice as much carbon as there is in the atmosphere, with ~800 Pg SOC currently frozen in permafrost (5, 6). With climate warming, substantial increases in carbon emission from permafrost regions, in the form of either CO2 or CH4, have been observed over the past decades due to permafrost thawing (7). A large amount of SOC stored in permafrost also represents an important potential carbon source in a warming climate and can trigger a strong permafrost carbon–climate feedback (8–15). Model estimates of permafrost thawing–induced carbon emission lie in the range of 6 to 33 Pg and 23 to 174 Pg by 2100 under representative concentration pathway 4.5 (RCP4.5) and RCP8.5, respectively (8, 16), potentially offsetting the global land carbon sink (~160 Pg by 2100) (17) and even reversing the circum-Arctic permafrost region from a net carbon sink (~35 Pg by 2100) (18) to a net carbon source under future climate scenarios (9–11).
Existing studies on permafrost carbon release, however, are typically restricted to shallow soil profiles down to ~3 m deep (9, 12–14), although some recent studies emphasize the importance of deep permafrost carbon release due to abrupt thawing (16, 19). This might reasonably depict gradual permafrost carbon thawing for the circum-Arctic region where the active layer thickness (ALT) is generally shallower than 3 m (20) but could considerably underestimate permafrost carbon release in other regions with deeper active layers, such as the Tibetan Plateau (TP). The TP, also known as the third pole of Earth, contains the largest area of alpine permafrost in the world. The third pole region has been subjected to serious permafrost degradation according to the observations due to drastic climate warming over the past decades (21), including active layer deepening at a rate faster than that in the circum-Arctic regions (4), an upward move of the lower altitudinal limit of permafrost (22), and a continuous decrease in the area occupied by cold permafrost types (23). Recent observations also indicate that the ALT in TP is generally deeper than that in the circum-Arctic region and can be greater than 3 m where a high carbon quality is presented (4, 24, 25). Unfortunately, permafrost carbon storage/release has not been comprehensively quantified across the entire TP and has rarely been included in current global scale permafrost carbon inventories (5). Consequently, the magnitude of permafrost carbon response to future climate warming, especially permafrost carbon thawing from deep soil layers, remains largely unknown over TP.
Here, we attempt to fill this knowledge gap based on extensive in situ observations and data-driven approaches. We collected permafrost data including 143 observations of mean annual ground temperature (MAGT) at or near the zero annual amplitude depth (i.e., the maximum depth affected by the annual temperature variations) and 93 observations of ALT from boreholes obtained from sources listed in table S1, as well as SOC observations at different depths from more than 100 sites measured after 2006 in the TP permafrost region from literatures (24, 26, 27) to estimate permafrost, ALT, and SOC distributions over the TP. Three data-driven methods, including support vector machine (SVM), random forest (RF), and gradient boosting decision tree (GBDT), were adopted to upscale site observations to the entire region (Materials and Methods). The most recent decade (i.e., 2006–2015) was selected as the baseline period to represent the current climate scenario. Then, we estimated the future warming-induced ALT deepening and assessed the potential permafrost carbon release risk over TP using the Stefan equation and future temperature projections from 18 Coupled Model Intercomparison Project Phase 5 (CMIP5) models under RCP4.5 and RCP8.5 scenarios (Materials and Methods).
RESULTS
Permafrost and ALT distribution
Adopting the 143 MAGT and 93 ALT observations across TP (table S1 and fig. S1), the three data-driven approaches (i.e., SVM, RF, and GBDT) were found to exhibit similar performance (fig. S2). Therefore, the ensemble mean estimates of the three algorithms were adopted for further analysis. As shown in Fig. 1A, the permafrost region on the TP covers ~1.30 × 10⁶ km2 (~42% of the entire TP), and the estimated average ALT in the baseline period (2006–2015) is 2.34 m over the permafrost region with an SD of 0.70 m. The ALT shallower than 2 m (~34% of the TP permafrost region) during the baseline period generally occurs in the northwestern TP, where the mean annual air temperature (MAAT) is lower than −8°C and the mean annual precipitation (MAP) is less than 200 mm, as well as in the eastern and southern TP, where the MAP is larger than 500 mm despite the relatively higher air temperature. Deeper ALTs (i.e., >3 m, covers ~15% of the TP permafrost region) generally concentrate in the central TP, with the MAAT higher than −5°C and the MAP less than 500 mm (fig. S3).
Fig. 1. Spatial and temporal patterns of ALT in the TP.
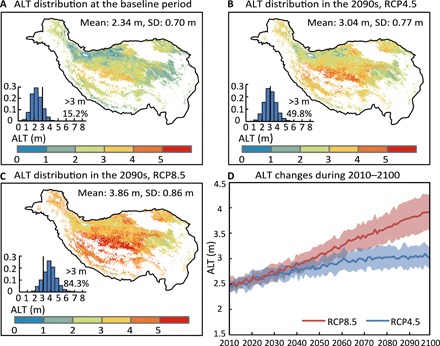
(A to C) Spatial distribution of ALT over the TP permafrost region at the baseline period (2006–2015) and in the 2090s projected by the ensemble mean of 18 CMIP5 models under RCP4.5 and RCP8.5 scenarios. The frequency histogram, mean value, and SD across the TP permafrost region for each map are also shown. (D) Time series of averaged ALT over the TP permafrost region during 2010–2100 under RCP4.5 and RCP8.5 scenarios. The solid curves are the ensemble mean of 18 CMIP5 models, and the shading represents ±1 SD among models.
SOC distribution
To estimate permafrost carbon storage, SOC observations measured after 2006 in the TP permafrost region were collected (fig. S4) (24, 26, 27) and extrapolated to the entire TP. In this modeling exercise, RF outperforms the other two algorithms in estimating SOC so that only the results derived from RF is adopted for SOC analysis (fig. S5). The estimated amount of SOC stored in the TP permafrost region is 15.33 Pg within 0- to 3-m soil depth, ~17% of which (2.26 Pg) is currently frozen in permafrost. The 0- to 3-m thawed SOC shows a mean value of 6.14 kg/m2 with a large spatial variability (Fig. 2A). Larger SOC stocks (>20 kg/m2) are generally found in alpine swamp meadows in the eastern mountainous regions, where growing season leaf area index (LAI) is larger than 0.35 and MAP is higher than 400 mm (Fig. 2A and fig. S6). Larger growing season LAI indicates a higher carbon assimilation capacity, and higher precipitation amount further ensures a more favorable moisture condition for vegetation growth (28). In comparison, lower 0- to 3-m SOC (<10 kg/m2) is mostly distributed in the alpine steppe and desert in the central and western TP with growing season LAI smaller than 0.3 and MAP less than 450 mm (Fig. 2A and fig. S6). In addition, the SOC stored within 3- to 6-m soil depth is estimated to be 6.25 Pg (uncertainty range, 4.86 to 7.82 Pg), with ~97% currently frozen in permafrost, indicating a low baseline period 3- to 6-m thawed SOC distribution (mean value of 0.12 kg/m2; Fig. 2D). There are still 28.85 Pg (uncertainty range, 15.59 to 45.86 Pg) SOC stored in 6- to 25-m soil layers in the permafrost region of TP, which is potentially a large carbon source in the future if the warming persisted. In total, we estimate a SOC storage of 50.43 Pg (uncertainty range, 35.78 to 69.02 Pg) over the TP permafrost region, with 13.22 Pg (uncertainty range, 13.19 to 13.26 Pg) seasonally thawed within the active layer and the remaining 37.21 Pg (uncertainty range, 22.59 to 55.75 Pg) frozen in permafrost for the baseline period.
Fig. 2. Spatial distribution of thawed SOC.
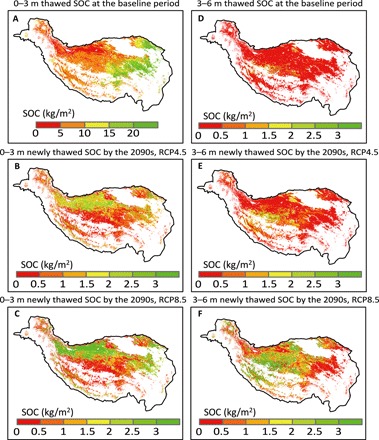
(A) Spatial distribution of the 0- to 3-m SOC stock over the TP permafrost region, which is seasonally thawed within the active layer at the baseline period (2006–2015). (B and C) Spatial distribution of the newly thawed 0- to 3-m SOC stock from the baseline period to the 2090s projected by the ensemble mean of 18 CMIP5 models under RCP4.5 and RCP8.5 scenarios. (D to F) Same as (A) to (C), but for the 3- to 6-m soil layer. The SOC profile deeper than 3 m shown here is determined by the median of the observed SOC profiles from the 11 deep boreholes.
Future changes in ALT
The projected increase in air temperature averaged over the TP permafrost region ranges from 0.24 ± 0.08°C/10a (RCP4.5) and 0.63 ± 0.15°C/10a (RCP8.5) (multimodel mean ± SD) during 2016–2100 according to the 18 CMIP5 models (fig. S7A). With these warming trends, the averaged ALT over the TP permafrost region is projected to increase by 0.71 ± 0.19 m (RCP4.5) and 1.53 ± 0.34 m (RCP8.5) in the 2090s or at a rate of 7.24 ± 2.21 cm/10a (RCP4.5) and 18.28 ± 4.20 cm/10a (RCP8.5) during 2016–2100 (Fig. 1D). The area with ALT larger than 3 m rises from 15.2% in the baseline period to 49.8 and 84.3% in the 2090s under RCP4.5 and RCP8.5 scenarios (Fig. 1), respectively, which is very different from the circum-Arctic regions where ALT is generally shallower than 3 m under future climate (20). It is worth noting that the area with ALT larger than 6 m over the TP only occupies 0.2% (RCP4.5) and 3.4% (RCP8.5) of the entire permafrost region in the 2090s (Fig. 1), suggesting that the gradual permafrost carbon loss from soil layers deeper than 6 m is generally negligible in the coming century.
Permafrost carbon dynamics under future climate
The persistent deepening of the active layer causes the thawing of the SOC that is currently frozen in permafrost, and these newly thawed SOC will perform as an additional carbon source and participate in the terrestrial carbon cycle under future climate. The amount of thawed permafrost SOC from the baseline period to the 2090s is projected to be 1.86 ± 0.49 Pg (RCP4.5) and 3.80 ± 0.76 Pg (RCP8.5) (Fig. 3), indicating that 22.2 ± 5.9% (RCP4.5) and 45.4 ± 9.1% (RCP8.5) of the SOC currently frozen in permafrost at 0- to 6-m depth over TP are projected to thaw by the end of the century. The 0- to 3-m thawed permafrost SOC generally concentrates in the northern and eastern TP where the baseline ALT is shallower, while the 3- to 6-m additionally thawed SOC is larger in the central and southwestern TP (Fig. 2). It is interesting to observe that the 0- to 3-m thawed SOC starts to level off after ~2060, in contrast to a rapid increase in 3- to 6-m thawed SOC and a steady increase in 0- to 6-m thawed SOC under RCP 8.5 (Fig. 3B). This indicates that the contribution of permafrost carbon loss from deeper layers is projected to increase with time. Under RCP8.5, ALT at 59.4 ± 11.2% of the TP permafrost region is projected to exceed 3 m; 69.1 ± 10.7% of the 0- to 3-m SOC, which was frozen in permafrost at the baseline period, is projected to thaw by 2060. As a result, among the total 1.44 ± 0.39 Pg SOC projected to thaw during 2061–2100, only 31.2 ± 10.4% come from the 0- to 3-m layer, while the remaining 67.9 ± 9.5% come from the 3- to 6-m layer. In summary, the newly thawed permafrost carbon from the baseline period to the 2090s projected to occur at soil layers deeper than 3 m constitutes 29.6 ± 3.8% (RCP4.5) and 46.2 ± 6.5% (RCP8.5) of the total permafrost carbon loss, respectively.
Fig. 3. Changes in thawed SOC.
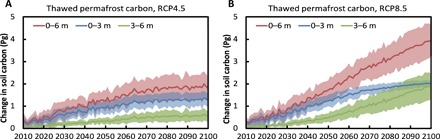
(A and B) Cumulative thawed permafrost carbon, which used to be perennially frozen in the baseline period (2006–2015) during 2010–2100 over the TP permafrost region projected by 18 CMIP5 models under (A) RCP4.5 and (B) RCP8.5 scenarios. The newly thawed carbon from layers at 0- to 3-m, 3- to 6-m, and 0- to 6-m depths is shown. The solid curves are the ensemble mean of 18 CMIP5 models, and the shading represents ±1 SD among models.
DISCUSSION
Our quantification of permafrost changes and associated carbon dynamics has important implications for understanding the global and regional carbon balance in a warming climate. Although the TP permafrost area (~1.30 × 10⁶ km2) only occupies ~5.7% of the total permafrost region area across the Northern Hemisphere [22.79 × 10⁶ km2 by (2)], the amount of thawed permafrost SOC over TP (1.07 to 2.60 Pg for RCP4.5 and 2.87 to 5.30 Pg for RCP8.5) is projected to be as large as 3 to 43% and 2 to 23% of the number in the circum-Arctic regions [6 to 33 Pg for RCP4.5 and 23 to 174 Pg for RCP8.5 (8, 16)] under RCP4.5 and RCP8.5 scenarios by the end of this century, which has been rarely considered in previous global-scale permafrost carbon estimations. The cumulative net biome production (NBP) projected by the CMIP5 models indicates a net land carbon sink of 2.62 ± 1.93 Pg (RCP4.5) and 3.10 ± 2.90 Pg (RCP8.5) during 2016–2100 (fig. S7B). This suggests that the amount of additional thawed permafrost carbon is about to offset ~70% of the net land carbon sink by 2100 under RCP4.5 and even potentially reverse the TP permafrost region from a net carbon sink to a net carbon source under RCP8.5. In particular, the amount of thawed permafrost carbon from layers deeper than 3 m is also about to compensate ~22 and ~58% of the net land carbon sink by 2100 under RCP4.5 and RCP8.5 scenarios, respectively. It should be noted that all of the thawed permafrost carbon will not be decomposed immediately; the rate of carbon release depends on carbon quality, soil microbial abundance, and many other site-specific factors (12). According to recent warming experiments on TP, ~45.4% of the thawed permafrost carbon will be eventually released into the atmosphere in the form of CO2 by the end of the century (25). If we adopted this 45.4% ratio, the released deep permafrost carbon could still offset ~10 and ~26% of the net land carbon sink by 2100 under RCP4.5 and RCP8.5 scenarios, respectively, highlighting the importance of deep permafrost thawing on future permafrost carbon release. In addition to the permafrost carbon release caused by gradual active layer deepening, the large amount of deep permafrost carbon estimated here (~35.10 Pg at 3- to 25-m depth, with the uncertainty range of 20.45 to 53.69 Pg) would also be released into the atmosphere in the form of CH4 by thermokarst caused by abrupt thaw slump activities (8, 12, 16), which have recently been observed in the TP region (29). This would increase the risk of the TP permafrost region being turned into a net carbon source under future climate.
Besides, our results also provide an important observational benchmark for process-based models. Although recent developments of land surface models (LSMs) have incorporated permafrost carbon dynamics, they perform quite differently in simulating permafrost carbon dynamics due to uncertainties and differences in model structures and parameterizations (14). For example, the soil carbon pool over the TP permafrost region from the ensemble CMIP5 models is 13.35 ± 6.00 Pg, which is almost identical to the amount of the baseline period thawed SOC estimated here (~13.22 Pg). A smaller soil carbon pool would result in a lower soil carbon release and thus overestimate NBP in the region. This is likely caused by a single-layer representation of the SOC pool while ignoring the vertical variations in SOC turnover times in CMIP5 models (30). In addition, LSMs usually assume a uniform lower boundary of SOC pool, e.g., 2 m in ORCHIDEE (31), 3 m in SiBCASA (9), 3.35 m in UVic (15), and 3.8 m in CLM4.5 (32), which might be too shallow for the TP permafrost region. New schemes should be incorporated in LSMs, which can make the best use of the observation-based SOC patterns and represent the vertically resolved soil carbon dynamics down to deeper layers, thereby achieving a more realistic estimation of permafrost carbon dynamics and thus global and regional carbon budgets.
In conclusion, on the basis of the extensive up-to-date MAGT, ALT, and SOC observations across TP, this study updated the permafrost distribution and evaluated the permafrost carbon storage over TP (~50.43 Pg SOC down to 25-m depth, with ~37.21 Pg currently frozen in permafrost). This is an important supplement to the existing global permafrost carbon inventory, which has been only focusing on the circum-Arctic region (5). On the basis of the Stefan equation and climate projections from CMIP5 models, our study assessed potential permafrost carbon release over TP under different climate change mitigation pathways and found that the amount of potentially thawed permafrost carbon could largely offset the regional carbon sink and even turn the region into a net carbon source. Our results demonstrate that the permafrost carbon thawing from deep layers (>3 m) could constitute a large proportion (29.6 to 46.2%) of the total permafrost carbon loss in a warmer future over TP, highlighting the importance of deep permafrost thawing in future carbon budget over the third pole region.
MATERIALS AND METHODS
MAGT, ALT, and SOC observations
We collected 143 MAGT at or near (the closest to) the depth of zero annual amplitude and 93 ALT observations from boreholes drilled after 2006 (table S1 and fig. S1). We also collected 314 observations of 0- to 1-m SOC stock, 314 observations of 1- to 2-m SOC stock, and 114 observations of 2- to 3-m SOC stock (kg/m2) from 314 sites [114 sites from Ding et al. (27) with 0- to 1-m, 1- to 2-m, and 2- to 3-m SOC stock observations and 200 sites from Zhao et al. (26) with only 0- to 1-m and 1- to 2-m SOC stock observations] in the TP permafrost region. In addition to 0- to 3-m SOC, observations of SOC stock from 11 deep boreholes down to 25-m depth were collected to estimate permafrost carbon storage in deep layers (24). The spatial distribution of all the SOC observation sites was shown in fig. S4. We calculated the SOC stock (kg/m2) at different depths with 1-m increment from the original observed SOC content (g/kg) and soil bulk density (g/cm3) data provided by Mu et al. (24) and obtained the SOC stock profile at 0 to 25 m at the 11 sites. Observed values of SOC stock show gradual attenuation along depth and can be as high as 11 kg/m2 (KL150) and 20 kg/m2 (KL300) even at 19- to 20-m depth (fig. S8A), indicating the large quantity of deep permafrost carbon over TP.
Geospatial distributed data
Climate, vegetation, and soil variables were used in the data-driven mapping of permafrost and soil carbon variables. Monthly air temperature during the baseline period (2006–2015) was obtained from the two datasets: (i) the China Meteorological Forcing Dataset (CMFD) (https://data.tpdc.ac.cn/en/data/8028b944-daaa-4511-8769-965612652c49/) with 0.1° resolution for regions within China and (ii) the Climatic Research Unit (CRU) TS 4.01 (https://crudata.uea.ac.uk/cru/data/hrg/cru_ts_4.01/) with 0.5° resolution for regions outside China. The original coarse resolution air temperature was resampled to a 1-km spatial resolution with an elevation adjustment (33)
| (1) |
where ELEV1km is the elevation from the Shuttle Radar Topography Mission (SRTM) version 4 global 90-m product (http://srtm.csi.cgiar.org/srtmdata/) resampled to 1-km resolution, ELEVcoarse is the elevation at the coarse resolution of 0.1° (CMFD) or 0.5° (CRU), and TLR is the air temperature lapse rate of a certain month (°C km−1). The values of TLR for different months were calculated by a linear regression method based on the observations at the meteorological stations across TP (33) with the mean annual TLR of −4.2°C km−1. Freezing index (FI) and thawing index (TI) (°C days) were then calculated as the cumulative sum of the monthly air temperature below and above 0°C multiplied by the number of days in the corresponding month.
The baseline period monthly precipitation was also obtained from two sources: (i) the China Gauge-Based Daily Precipitation Analysis (34) for regions within China and (ii) the Global Precipitation Climatology Centre version 8 (https://opendata.dwd.de/climate_environment/GPCC/html/fulldata-monthly_v2018_doi_download.html) for regions outside China. Annual rainfall (Prain) and annual snowfall (Psnow) were calculated as the sum of monthly precipitation for months with air temperature above and below 0°C, which could indirectly reflect the soil moisture and snow cover conditions (35). The Moderate Resolution Imaging Spectroradiometer (MODIS) LAI product with 8-day and 500-m resolution (MOD15A2H version 6) (https://lpdaac.usgs.gov/products/mod15a2hv006/) was adopted, and we further calculated the mean LAI during the growing season from May to September. Soil properties, including soil bulk density, gravel content, silt content, and clay content, were obtained from the SoilGrids database (36). All the data layers were resampled to a 1-km spatial resolution.
Future climate projections
To assess permafrost carbon change under future climates, we collected monthly air temperature for the period of 2006–2100 from 18 CMIP5 models under scenarios of moderate emission pathway (RCP4.5) and “business as usual” (RCP8.5) (37) (see table S2). The delta approach was used to bias-correct future temperature projection (33), given by
| (2) |
which could thereafter be used for calculating future TI and ALT distribution.
In addition, outputs of monthly NBP from the same 18 CMIP5 models under RCP4.5 and RCP8.5 scenarios for 2016–2100 were also collected. NBP is a commonly adopted indicator of the land carbon source/sink. Here, we calculated the cumulative NBP since 2016 to indicate the land carbon sink from the baseline period to the end of the 21st century in the TP permafrost region (fig. S7B). It is worth noting that none of the CMIP5 models explicitly consider permafrost carbon, as they use a single-layer representation of soil carbon and ignored the vertical variations in soil carbon turnover times (30). We also downloaded the SOC stock (cSoil) from the CMIP5 models without a specified lower boundary for soil carbon representation. We find that the soil carbon pool over the TP permafrost region from the CMIP5 models (13.35 ± 6.00 Pg) is comparable to the amount of the baseline period thawed SOC (13.22 Pg) estimated here. Therefore, the NBP from the CMIP5 models approximately reflects the land carbon–climate response without additional thawed permafrost carbon, and the actual future NBP will be lower if considering the carbon release from thawing permafrost. It is worth noting that the new version of the CMIP model outputs (i.e., CMIP6) has recently been released (https://esgf-node.llnl.gov/projects/cmip6/). However, we use CMIP5, instead of CMIP6, here mainly due to two reasons: (i) There are only 7 CMIP6 models that have provided the NBP projection compared to 18 CMIP5 models, and (ii) temperature change in the available 18 CMIP6 models shows a larger cross-model difference in the TP permafrost region compared with the 18 CMIP5 models used in this study, suggesting an even larger uncertainty in temperature projection in CMIP6 models.
Data-driven mapping of MAGT and ALT
Most boreholes were drilled in regions where MAGT is close to 0°C, and our 143 MAGT observations range from −3.38° to 3.80°C. The difference between MAAT and MAGT was used to train the data-driven models. This is because if MAGT was directly used, it would be difficult for the data-driven models to get the MAGT value beyond the observed range.
ALT can be estimated by the simplified Stefan equation (20), given as
| (3) |
where TI is the thawing index (°C day) and E is a catchall scaling parameter (E-factor) influenced by local characters including vegetation, snow cover, and local soil texture. We calculated the E-factor on the basis of observations at the 93 sites by the following equation
| (4) |
Three different algorithms including SVM (38), RF (39), and GBDT (40) were selected for data-driven mapping of MAGT and ALT. These three algorithms were selected because they belong to different subdomains of supervised machine learning techniques: nonparametric kernel methods and ensemble methods (bagging and boosting). The applicability of these algorithms was compared and evaluated to select an algorithm with the best performance. If the performances of different algorithms are similar, we use the ensemble mean results from the different algorithms to reduce uncertainty. Nine variables including TI, FI, Prain, Psnow, growing season LAI, soil bulk density, gravel content, silt content, and clay content were selected as local environmental predictors. We used the 143 observed MAGT-MAAT and 93 calculated E-factor values as the labels to train the models. The predicted MAGT-MAAT was then added to MAAT to get the estimated MAGT, and the predicted E-factor was multiplied by the square root of TI to get the ALT estimates.
To evaluate the models, we randomly split the site-level observations into calibration (90% of the observations) and evaluation (10%) datasets for 100 times. At each time, we fitted the models with the calibration dataset and tested the calibrated model using the remaining 10% evaluation data (35). Model performance was assessed with the root mean square error and correlation coefficient (r). The three data-driven approaches showed similar performance in predicting MAGT and ALT (figs. S1 and S2) so the ensemble mean estimates from the three algorithms were used in our analysis.
MAGT is defined as the mean annual ground temperature at or near (the closest to) the depth of zero annual amplitude usually ranging from 10 to 15 m over TP (41). Because permafrost in TP is warmer than that in Arctic regions, this study uses MAGT <1°C as the criterion for the presence of permafrost and to obtain the extent of permafrost region (fig. S9A). The area of permafrost region in TP was estimated to be 1.30 × 10⁶ km2 in the baseline period, more reasonable than the permafrost maps derived from the MAGT threshold of 0° or 2°C compared with recently published permafrost maps over TP (fig. S9). The scope of the permafrost region over TP in the baseline period was adopted for permafrost carbon analysis, and this analysis scope was assumed to be unchanged in the future. As for the future ALT, the E-factor values were assumed constant over time following a previous study (20). The future ALT was then estimated by the simplified Stefan equation (Eq. 1) using the baseline period E-factor distribution and the future TI distribution derived from the bias-corrected air temperature from CMIP5 models. The procedures of estimating MAGT and ALT distribution are shown in fig. S10.
Data-driven mapping of SOC
The distribution of 0- to 1-m SOC was estimated using the 314 available 0- to 1-m SOC observations as labels and seven variables including MAAT, MAP, growing season LAI, soil bulk density, gravel content, silt content, and clay content as the local environmental predictors to train the data-driven models. The same random split method as we applied for evaluating MAGT and ALT estimates was used to evaluate the SOC estimates. Among the three machine learning approaches, the RF outperformed the other two algorithms in estimating SOC; thus, only the results derived from RF were adopted for soil carbon analysis (fig. S5). Then, we used the RF model trained by all the available observations to predict the 0- to 1-m SOC distribution over the TP permafrost region.
We estimated the 1- to 2-m SOC distribution using the 314 available 1- to 2-m SOC observations as labels and selected eight variables including the seven variables used in estimating the 0- to 1-m SOC and the 0- to 1-m SOC stock as the local environmental predictors to train the model. Similarly, we estimated the 2- to 3-m SOC distribution using the 114 available 2- to 3-m SOC observations as labels and used five variables including MAAT, MAP, growing season LAI, and 0- to 1-m and 1- to 2-m SOC stock as the local environmental predictors for training the model. The four soil properties (i.e., soil bulk density, gravel content, silt content, and clay content) were not used, as there is no soil property information for deep soil layers. For 1- to 2-m and 2- to 3-m SOC predictions, only the RF algorithm was adopted, and the model evaluation results were shown in fig. S5. Then, we used the RF model trained by all the available observations to predict the 1- to 2-m and 2- to 3-m SOC distribution over the TP permafrost region. The procedures for estimating SOC distribution at 0- to 1-m, 1- to 2-m, and 2- to 3-m depths were depicted in fig. S11.
Because of the high variance in SOC along depth in the range of 0 to 2 m, for each of the 11 boreholes, we calculated the deep-layer SOC stock (>3 m) as percentage of 2- to 3-m SOC, with 2- to 3-m SOC set to be 100% as the baseline (i.e., SOC stocks below 3 m at 1-m depth interval divided by 2- to 3-m SOC stock at each borehole), and derived the median, 25th percentile, and 75th percentile values of different borehole percentages at each 1-m depth interval down to 25 m (fig. S8B). Then, the spatial distribution of SOC stock deeper than 3 m was determined by multiplying the gridded 2- to 3-m SOC with these percentages. However, not all regions have the soil carbon extending to 25 m. Therefore, we obtained the depth to bedrock (DTB) data from Global Depth to Bedrock Dataset for Earth System Modeling (http://globalchange.bnu.edu.cn/research/dtb.jsp) (42) and only considered the soil carbon in permafrost regions down to the lesser of 25 m and DTB. In the main text, we expressed the permafrost carbon stock estimates deeper than 3 m derived from the median relative SOC profile according to the 11 borehole observations followed by the results derived from 25th percentile and 75th percentile SOC profile as the uncertainty range. For future projections, the carbon thawed from permafrost over a period was determined by summing up the SOC mass contained in the depths of layers where it used to be permafrost in the baseline period but is projected to degrade into part of the active layer (the layers where ALT increases occur) in the future period. The amount of cumulative thawed permafrost carbon derived from the mean, 25th percentile, and 75th percentile SOC profile according to the 11 borehole observations in the coming century was compared in fig. S12. It shows that the difference induced by varying deep SOC profiles is relatively small compared with that induced by different CMIP5 models. Therefore, in the main text, we only expressed the amount of additionally thawed permafrost carbon derived from the median SOC profile according to the 11 borehole observations followed by the uncertainty range caused by the 18 CMIP5 models, indicated by multimodel mean ± SD.
Supplementary Material
Acknowledgments
Funding: This research was supported by the National Natural Science Foundation of China (grant no. 41630856), the Strategic Priority Research Program of Chinese Academy of Sciences (grant no. XDA20100103), and the National Natural Science Foundation of China (grant nos. 91225302 and 91425303). Y.Y. acknowledges the support from the Department of Science and Technology, Qinghai, China (grant no. 2019-SF-A4). S.P. acknowledges the support from the Second Tibetan Plateau Scientific Expedition and Research Program (grant no. 2019QZKK0208). Author contributions: T.W. and D.Y. conceived the idea and designed the study. T.W. and Y.Y. performed the analyses. T.W., Y.Y., and D.Y. drafted the manuscript. S.P., X.L., G.C., and B.F. provided advice, ideas, and discussion throughout the process. All authors contributed to writing the manuscript. Competing interests: The authors declare that they have no competing interests. Data and materials availability: The datasets analyzed during the current study are available online (CMIP5 model outputs: https://esgf-node.llnl.gov/projects/cmip5/). MAGT and ALT observations can be obtained from the links in table S1. SOC observations can be obtained from Mu et al. (24), Ding et al. (27), and Zhao et al. (26). The datasets generated by the study including the permafrost map and permafrost carbon map over the TP are available at https://github.com/wangtaihua12/Permafrost-Carbon-Dataset-Tibetan-Plateau. Any further data are available from the authors on reasonable request.
SUPPLEMENTARY MATERIALS
Supplementary material for this article is available at http://advances.sciencemag.org/cgi/content/full/6/19/eaaz3513/DC1
REFERENCES AND NOTES
- 1.Obu J., Westermann S., Bartsch A., Berdnikov N., Christiansen H. H., Dashtseren A., Delaloye R., Elberling B., Etzelmüller B., Kholodov A., Northern Hemisphere permafrost map based on TTOP modelling for 2000–2016 at 1 km2 scale. Earth Sci. Rev. 193, 299–316 (2019). [Google Scholar]
- 2.Zhang T., Barry R. G., Knowles K., Heginbottom J. A., Brown J., Statistics and characteristics of permafrost and ground-ice distribution in the Northern Hemisphere. Pol. Geogr. 23, 132–154 (1999). [Google Scholar]
- 3.Biskaborn B. K., Smith S. L., Noetzli J., Matthes H., Vieira G., Streletskiy D. A., Schoeneich P., Romanovsky V. E., Lewkowicz A. G., Abramov A., Allard M., Boike J., Cable W. L., Christiansen H. H., Delaloye R., Diekmann B., Drozdov D., Etzelmüller B., Grosse G., Guglielmin M., Ingeman-Nielsen T., Isaksen K., Ishikawa M., Johansson M., Johannsson H., Joo A., Kaverin D., Kholodov A., Konstantinov P., Kröger T., Lambiel C., Lanckman J.-P., Luo D. L., Malkova G., Meiklejohn I., Moskalenko N., Oliva M., Phillips M., Ramos M., Sannel A. B. K., Sergeev D., Seybold C., Skryabin P., Vasiliev A., Wu Q. B., Yoshikawa K., Zheleznyak M., Lantuit H., Permafrost is warming at a global scale. Nat. Commun. 10, 264 (2019). [DOI] [PMC free article] [PubMed] [Google Scholar]
- 4.Luo D., Wu Q., Jin H., Marchenko S. S., Lü L. Z., Gao S., Recent changes in the active layer thickness across the northern hemisphere. Environ. Earth Sci. 75, 555 (2016). [Google Scholar]
- 5.Hugelius G., Strauss J., Zubrzycki S., Harden J. W., Schuur E. A. G., Ping C.-L., Schirrmeister L., Grosse G., Michaelson G. J., Koven C. D., O’Donnell J. A., Elberling B., Mishra U., Camill P., Yu Z., Palmtag J., Kuhry P., Estimated stocks of circumpolar permafrost carbon with quantified uncertainty ranges and identified data gaps. Biogeosciences 11, 6573–6593 (2014). [Google Scholar]
- 6.E. A. G. Schuur, A. D. McGuire, V. Romanovsky, C. Schädel, M. Mack, Chapter 11: Arctic and boreal carbon, in Second State of the Carbon Cycle Report (SOCCR2): A Sustained Assessment Report, Cavallaro, N., G. Shrestha, R. Birdsey, M. A. Mayes, R. G. Najjar, S. C. Reed, P. Romero-Lankao, Z. Zhu, Eds. (U.S. Global Change Research Program, 2018), pp. 428–468.
- 7.Schuur E. A. G., Vogel J. G., Crummer K. G., Lee H., Sickman J. O., Osterkamp T. E., The effect of permafrost thaw on old carbon release and net carbon exchange from tundra. Nature 459, 556–559 (2009). [DOI] [PubMed] [Google Scholar]
- 8.Schuur E. A. G., McGuire A. D., Schädel C., Grosse G., Harden J. W., Hayes D. J., Hugelius G., Koven C. D., Kuhry P., Lawrence D. M., Natali S. M., Olefeldt D., Romanovsky V. E., Schaefer K., Turetsky M. R., Treat C. C., Vonk J. E., Climate change and the permafrost carbon feedback. Nature 520, 171–179 (2015). [DOI] [PubMed] [Google Scholar]
- 9.Schaefer K., Zhang T., Bruhwiler L., Barrett A. P., Amount and timing of permafrost carbon release in response to climate warming. Tellus Ser. B Chem. Phys. Meteorol. 63, 165–180 (2011). [Google Scholar]
- 10.Koven C. D., Lawrence D. M., Riley W. J., Permafrost carbon–climate feedback is sensitive to deep soil carbon decomposability but not deep soil nitrogen dynamics. Proc. Natl. Acad. Sci. U.S.A. 112, 3752–3757 (2015). [DOI] [PMC free article] [PubMed] [Google Scholar]
- 11.McGuire A. D., Lawrence D. M., Koven C., Clein J. S., Burke E., Chen G. S., Jafarov E., MacDougall A. H., Marchenko S., Nicolsky D., Peng S. S., Rinke A., Ciais P., Gouttevin I., Hayes D. J., Ji D. Y., Krinner G., Moore J. C., Romanovsky V., Schaedel C., Schafer K., Schuur E. A. G., Zhuang Q. L., Dependence of the evolution of carbon dynamics in the northern permafrost region on the trajectory of climate change. Proc. Natl. Acad. Sci. U.S.A. 115, 3882–3887 (2018). [DOI] [PMC free article] [PubMed] [Google Scholar]
- 12.Burke E. J., Hartley I. P., Jones C. D., Uncertainties in the global temperature change caused by carbon release from permafrost thawing. Cryosphere 6, 1063–1076 (2012). [Google Scholar]
- 13.Harden J. W., Koven C. D., Ping C.-L., Hugelius G., McGuire A. D., Camill P., Jorgenson T., Kuhry P., Michaelson G. J., O’Donnell J. A., Schuur E. A. G., Tarnocai C., Johnson K., Grosse G., Field information links permafrost carbon to physical vulnerabilities of thawing. Geophys. Res. Lett. 39, L15704 (2012). [Google Scholar]
- 14.McGuire A. D., Koven C., Lawrence D. M., Clein J. S., Xia J., Beer C., Burke E., Chen G., Chen X., Delire C., Jafarov E., MacDougall A. H., Marchenko S., Nicolsky D., Peng S., Rinke A., Saito K., Zhang W., Alkama R., Bohn T. J., Ciais P., Decharme B., Ekici A., Gouttevin I., Hajima T., Hayes D. J., Ji D., Krinner G., Lettenmaier D. P., Luo Y., Miller P. A., Moore J. C., Romanovsky V., Schädel C., Schaefer K., Schuur E. A. G., Smith B., Sueyoshi T., Zhuang Q., Variability in the sensitivity among model simulations of permafrost and carbon dynamics in the permafrost region between 1960 and 2009. Glob. Biogeochem. Cycle 30, 1015–1037 (2016). [Google Scholar]
- 15.MacDougall A. H., Avis C. A., Weaver A. J., Significant contribution to climate warming from the permafrost carbon feedback. Nat. Geosci. 5, 719–721 (2012). [Google Scholar]
- 16.Anthony K. W., von Deimling T. S., Nitze I., Frolking S., Emond A., Daanen R., Anthony P., Lindgren P., Jones B., Grosse G., 21st-century modeled permafrost carbon emissions accelerated by abrupt thaw beneath lakes. Nat. Commun. 9, 3262 (2018). [DOI] [PMC free article] [PubMed] [Google Scholar]
- 17.Friedlingstein P., Cox P., Betts R., Bopp L., von Bloh W., Brovkin V., Cadule P., Doney S., Eby M., Fung I., Bala G., John J., Jones C., Joos F., Kato T., Kawamiya M., Knorr W., Lindsay K., Matthews H. D., Raddatz T., Rayner P., Reick C., Roeckner E., Schnitzler K.-G., Schnur R., Strassmann K., Weaver A. J., Yoshikawa C., Zeng N., Climate–carbon cycle feedback analysis: Results from the C4MIP model intercomparison. J. Climate 19, 3337–3353 (2006). [Google Scholar]
- 18.Qian H., Joseph R., Zeng N., Enhanced terrestrial carbon uptake in the Northern high latitudes in the 21st century from the coupled carbon cycle climate model intercomparison project model projections. Glob. Chang. Biol. 16, 641–656 (2010). [Google Scholar]
- 19.Turetsky M. R., Abbott B. W., Jones M. C., Anthony K. W., Olefeldt D., Schuur E. A. G., Koven C., McGuire A. D., Grosse G., Kuhry P., Hugelius G., Lawrence D. M., Gibson C., Sannel A. B. K., Permafrost collapse is accelerating carbon release. Nature 569, 32–34 (2019). [DOI] [PubMed] [Google Scholar]
- 20.Peng X., Zhang T., Frauenfeld O. W., Wang K., Luo D., Cao B., Su H., Jin H., Wu Q., Spatiotemporal changes in active layer thickness under contemporary and projected climate in the Northern hemisphere. J. Climate 31, 251–266 (2018). [Google Scholar]
- 21.Yao T., Xue Y., Chen D., Chen F., Thompson L., Cui P., Koike T., Lau W. K.-M., Lettenmaier D., Mosbrugger V., Zhang R., Xu B., Dozier J., Gillespie T., Gu Y., Kang S., Piao S., Sugimoto S., Ueno K., Wang L., Wang W., Zhang F., Sheng Y., Guo W., Ailikun, Yang X., Ma Y., Shen S. S. P., Su Z., Chen F., Liang S., Liu Y., Singh V. P., Yang K., Yang D., Zhao X., Qian Y., Zhang Y., Li Q., Recent third pole’s rapid warming accompanies cryospheric melt and water cycle intensification and interactions between monsoon and environment: Multidisciplinary approach with observations, modeling, and analysis. Bull. Amer. Meteorol. Soc. 100, 423–444 (2019). [Google Scholar]
- 22.Cheng G., Wu T., Responses of permafrost to climate change and their environmental significance, Qinghai–Tibet Plateau. J. Geophys. Res. Earth Surf. 112, (2007). [Google Scholar]
- 23.Ran Y., Li X., Cheng G., Climate warming over the past half century has led to thermal degradation of permafrost on the Qinghai–Tibet Plateau. Cryosphere 12, 595–608 (2018). [Google Scholar]
- 24.Mu C., Zhang T., Wu Q., Peng X., Cao B., Zhang X., Cao B., Cheng G., Editorial: Organic carbon pools in permafrost regions on the Qinghai–Xizang (Tibetan) Plateau. Cryosphere 9, 479–486 (2015). [Google Scholar]
- 25.Chen L., Liang J., Qin S., Liu L., Fang K., Xu Y., Ding J., Li F., Luo Y., Yang Y., Determinants of carbon release from the active layer and permafrost deposits on the Tibetan Plateau. Nat. Commun. 7, 13046 (2016). [DOI] [PMC free article] [PubMed] [Google Scholar]
- 26.Zhao L., Wu X., Wang Z., Sheng Y., Fang H., Zhao Y., Hu G., Li W., Pang Q., Shi J., Mo B., Wang Q., Ruan X., Li X., Ding Y., Soil organic carbon and total nitrogen pools in permafrost zones of the Qinghai-Tibetan Plateau. Sci. Rep. 8, 3656 (2018). [DOI] [PMC free article] [PubMed] [Google Scholar]
- 27.Ding J., Li F., Yang G., Chen L., Zhang B., Liu L., Fang K., Qin S., Chen Y., Peng Y., Ji C., He H., Smith P., Yang Y., The permafrost carbon inventory on the Tibetan Plateau: A new evaluation using deep sediment cores. Glob. Chang. Biol. 22, 2688–2701 (2016). [DOI] [PubMed] [Google Scholar]
- 28.Yang Y., Donohue R. J., McVicar T. R., Roderick M. L., An analytical model for relating global terrestrial carbon assimilation with climate and surface conditions using a rate limitation framework. Geophys. Res. Lett. 42, 9825–9835 (2015). [Google Scholar]
- 29.Luo J., Niu F., Lin Z., Liu M., Yin G., Recent acceleration of thaw slumping in permafrost terrain of Qinghai-Tibet Plateau: An example from the Beiluhe Region. Geomorphology 341, 79–85 (2019). [Google Scholar]
- 30.Jones C. D., Arora V., Friedlingstein P., Bopp L., Brovkin V., Dunne J., Graven H., Hoffman F., Ilyina T., John J. G., Jung M., Kawamiya M., Koven C., Pongratz J., Raddatz T., Randerson J. T., Zaehle S., C4MIP – The coupled climate–carbon cycle model intercomparison project: Experimental protocol for CMIP6. Geosci. Model Dev. 9, 2853–2880 (2016). [Google Scholar]
- 31.Camino-Serrano M., Guenet B., Luyssaert S., Ciais P., Bastrikov V., De Vos B., Gielen B., Gleixner G., Jornet-Puig A., Kaiser K., Kothawala D., Lauerwald R., Peñuelas J., Schrumpf M., Vicca S., Vuichard N., Walmsley D., Janssens I. A., ORCHIDEE-SOM: Modeling soil organic carbon (SOC) and dissolved organic carbon (DOC) dynamics along vertical soil profiles in Europe. Geosci. Model Dev. 11, 937–957 (2018). [Google Scholar]
- 32.Koven C. D., Riley W. J., Subin Z. M., Tang J. Y., Torn M. S., Collins W. D., Bonan G. B., Lawrence D. M., Swenson S. C., The effect of vertically resolved soil biogeochemistry and alternate soil C and N models on C dynamics of CLM4. Biogeosciences 10, 7109–7131 (2013). [Google Scholar]
- 33.Wang T., Yang D., Fang B., Yang W., Qin Y., Wang Y., Data-driven mapping of the spatial distribution and potential changes of frozen ground over the Tibetan Plateau. Sci. Total Environ. 649, 515–525 (2019). [DOI] [PubMed] [Google Scholar]
- 34.Shen Y., Xiong A., Validation and comparison of a new gauge-based precipitation analysis over mainland China. Int. J. Climatol. 36, 252–265 (2016). [Google Scholar]
- 35.Karjalainen O., Luoto M., Aalto J., Hjort J., New insights into the environmental factors controlling the ground thermal regime across the Northern Hemisphere: A comparison between permafrost and non-permafrost areas. Cryosphere 13, 693–707 (2019). [Google Scholar]
- 36.Hengl T., de Jesus J. M., Heuvelink G. B. M., Gonzalez M. R., Kilibarda M., Blagotić A., Shangguan W., Wright M. N., Geng X., Bauer-Marschallinger B., Guevara M. A., Vargas R., MacMillan R. A., Batjes N. H., Leenaars J. G. B., Ribeiro E., Wheeler I., Mantel S., Kempen B., SoilGrids250m: Global gridded soil information based on machine learning. PLOS ONE 12, e0169748 (2017). [DOI] [PMC free article] [PubMed] [Google Scholar]
- 37.Taylor K. E., Stouffer R. J., Meehl G. A., An overview of CMIP5 and the experiment design. Bull. Am. Meteorol. Soc. 93, 485–498 (2012). [Google Scholar]
- 38.Chang C.-C., Lin C.-J., LIBSVM: A library for support vector machines. ACM Trans. Intell. Syst. Technol. 2, 27 (2011). [Google Scholar]
- 39.Breiman L., Random forests. Mach. Learn. 45, 5–32 (2001). [Google Scholar]
- 40.Friedman J. H., Greedy function approximation: A gradient boosting machine. Ann. Stat. 29, 1189–1232 (2001). [Google Scholar]
- 41.Qin Y., Wu T., Zhao L., Wu X., Li R., Xie C., Pang Q., Hu G., Qiao Y., Zhao G., Liu G., Zhu X., Hao J., Numerical modeling of the active layer thickness and permafrost thermal state across Qinghai-Tibetan plateau. J. Geophys. Res. Atmos. 122, 11604–11620 (2017). [Google Scholar]
- 42.Shangguan W., Hengl T., de Jesus J. M., Yuan H., Dai Y., Mapping the global depth to bedrock for land surface modeling. J. Adv. Model. Earth Syst. 9, 65–88 (2017). [Google Scholar]
- 43.Gruber S., Derivation and analysis of a high-resolution estimate of global permafrost zonation. Cryosphere 6, 221–233 (2012). [Google Scholar]
- 44.T. Wang, N. Wang, S. Li, Map of the Glaciers, Frozen Ground and Desert in China, 1:4,000,000 (Chinese Map Press, 2006).
- 45.Zou D., Zhao L., Sheng Y., Chen J., Hu G., Wu T., Wu J., Xie C., Wu X., Pang Q., Wang W., Du E., Li W., Liu G., Li J., Qin Y., Qiao Y., Wang Z., Shi J., Cheng G., A new map of permafrost distribution on the Tibetan Plateau. Cryosphere 11, 2527–2542 (2017). [Google Scholar]
- 46.Luo D. L., Jin H. J., Lin L., He R. X., Yang S. Z., Chang X. L., Degradation of permafrost and cold-environments on the interior and eastern Qinghai Plateau (in Chinese). J. Glaciol. Geocryol. 34, 538–546 (2012). [Google Scholar]
- 47.Wu Q., Zhang T., Liu Y., Thermal state of the active layer and permafrost along the Qinghai-Xizang (Tibet) Railway from 2006 to 2010. Cryosphere 6, 607–612 (2012). [Google Scholar]
- 48.Chen H., Nan Z., Zhao L., Ding Y., Chen J., Pang Q., Noah modelling of the permafrost distribution and characteristics in the West Kunlun area, Qinghai-Tibet Plateau, China. Permafrost Periglacial Process. 26, 160–174 (2015). [Google Scholar]
- 49.Chen J., Zhao L., Sheng Y., Li J., Wu X.-d., Du E.-j., Liu G.-y., Pang Q.-q., Some characteristics of permafrost and its distribution in the Gaize area on the Qinghai—Tibet Plateau, China. Arct. Antarct. Alp. Res. 48, 395–409 (2016). [Google Scholar]
- 50.Cao B., Zhang T., Peng X., Mu C., Wang Q., Zheng L., Wang K., Zhong X. Y., Thermal characteristics and recent changes of permafrost in the upper reaches of the heihe river basin, Western China. J. Geophys. Res. Atmos. 123, 7935–7949 (2018). [Google Scholar]
Associated Data
This section collects any data citations, data availability statements, or supplementary materials included in this article.
Supplementary Materials
Supplementary material for this article is available at http://advances.sciencemag.org/cgi/content/full/6/19/eaaz3513/DC1