

Biologically templated plasmonics enables simultaneous biophysical and biomolecular analysis of exosome biomarkers.
Abstract
Exosomes are nanoscale vesicles distinguished by characteristic biophysical and biomolecular features; current analytical approaches, however, remain univariate. Here, we develop a dedicated platform for multiparametric exosome analysis—through simultaneous biophysical and biomolecular evaluation of the same vesicles—directly in clinical biofluids. Termed templated plasmonics for exosomes, the technology leverages in situ growth of gold nanoshells on vesicles to achieve multiselectivity. For biophysical selectivity, the nanoshell formation is templated by and tuned to distinguish exosome dimensions. For biomolecular selectivity, the nanoshell plasmonics locally quenches fluorescent probes only if they are target-bound on the same vesicle. The technology thus achieves multiplexed analysis of diverse exosomal biomarkers (e.g., proteins and microRNAs) but remains unresponsive to nonvesicle biomarkers. When implemented on a microfluidic, smartphone-based sensor, the platform is rapid, sensitive, and wash-free. It not only distinguished biomarker organizational states in native clinical samples but also showed that the exosomal subpopulation could more accurately differentiate patient prognosis.
INTRODUCTION
Cancer cells secrete diverse materials into the circulation, at various stages of the disease progression; these materials include membrane vesicles and free-floating molecules (1). Of these factors, exosomes have recently emerged as a promising circulating biomarker. Distinguished by their biophysical and biomolecular composition (2, 3), exosomes are nanoscale membrane vesicles (diameter, 30 to 150 nm) actively released by a variety of mammalian cells and most notably by dividing cancer cells. Exosomes contain a rich trove of molecular contents, either as inherited constituents from the parent cells or as membrane-associated molecules (4), that include proteins (5, 6), nucleic acids (7, 8), lipids, and various modifications (9, 10). As a robust messenger of intercellular communication, exosomes play an important role in mediating disease progression. Specifically, cancer cells actively produce and use exosomes to promote tumor growth. Exosomes are released most abundantly by rapidly dividing cancer cells (11). Exosomal contents not only mediate intercellular communication but also condition the microenvironment to facilitate cancer metastasis (12, 13). This orchestrated release and functional activities highlight the clinical potential of exosomes as a more reflective circulating biomarker.
Despite this clinical potential, direct and specific analysis of exosomes in native biofluids remains technically challenging, especially for clinical translation (14, 15). In particular, clinical biofluids are compositionally heterogeneous and contain nanoscale vesicles and abundant nonvesicle, free molecules. Current detection of the exosome population from this complex mixture relies primarily on either biophysical or biochemical characterization, performed in an independent or sequential manner (14, 16). In bin dimension and was equippediophysical preparation, vesicles of characteristic size could be isolated through conventional ultracentrifugation (16, 17) or advanced sorting strategies (18, 19); however, these approaches require extensive processing, face contamination with other similarly sized protein aggregates, and lack biomolecular confirmation of vesicle identities. On the other hand, biochemical assays generally use affinity enrichment to capture and measure vesicles based on common exosomal markers (20, 21). These methods tend to miss vesicle subpopulations and/or are susceptible to interference by biochemically identical but differentially organized molecular targets (e.g., nonvesicle, free protein antigens).
Motivated by the unique features of exosomes, we developed a dedicated nanotechnology platform to enable multiparametric molecular profiling of vesicles—through the simultaneous evaluation of biophysical and biomolecular composition of the same vesicles—directly in native clinical biofluids. Named templated plasmonics for exosomes (TPEX), the technology uses the formation of gold nanoshells, assembled and grown on vesicles in situ, to achieve specific analysis of exosomal biomarkers. For biophysical selectivity, the nanoshell formation is templated by vesicle membrane and tuned to distinguish exosome dimensions. For biomolecular selectivity, through matched and localized energy transfer (22, 23), the nanoshell’s unique plasmonic signature quenches fluorescent probes only if they are target-bound on the same vesicle. The resultant optical signals (i.e., absorbance and fluorescence) enable multiselective analysis of diverse exosomal biomarkers [e.g., proteins and microRNAs (miRNAs)] but remain unresponsive to nonvesicle, free molecular targets. When implemented on a microfluidic, smartphone-based sensor, the TPEX technology achieved rapid and multiplexed analysis of exosomal targets with superior performance (1 μl of sample in 15 min). We further applied the developed platform to examine native clinical ascites samples. The technology not only revealed exosomal biomolecular signatures against complex biological background but also showed that the exosomal subpopulation of biomarkers, as compared to the total biomarkers, could more accurately differentiate cancer patient prognosis.
RESULTS
TPEX platform
The TPEX platform is designed to distinguish and measure exosomal markers (i.e., constituent and bound markers) from nonvesicle, free molecules. It consists of three functional steps: double labeling, development of templated nanoplasmonics, and signal detection (Fig. 1A and fig. S1). In the first step, a complex biological mixture (e.g., exosomes and free proteins) is incubated with fluorescent molecular probes (e.g., aptamers) and gold nanoparticles (AuNP). While AuNP remain monodispersed when associated with free proteins, because of the entropy-driven formation of protein corona (24), they assemble onto exosome periphery, through electrostatic interactions with the exosomal membrane. Excess unbound probes and AuNP are not removed. In the next step, the AuNP serve as seeds for in situ nanomaterial growth. AuNP associated with free proteins (or unbound AuNP) experience a meager growth and show a minimal red shift in their absorbance spectra. On the contrary, AuNP bound to exosomal surface develop into a nanoshell, templated by the vesicle dimension, to induce strong localized plasmonic resonance in the infrared region (25). The TPEX platform leverages this disparity in the resultant nanomaterial morphology and plasmonic properties to achieve simultaneous and multiselective measurement of exosomal markers. Specifically, the spectral compatibility of the nanoshell is templated by exosome membrane and tuned to distinguish exosome dimensions (i.e., selective for exosome biophysical properties); the enhanced fluorescence quenching of molecular probes is observed only if they are target-bound and colocalized on the same vesicle as the formed nanoshell (i.e., selective for molecular markers). As free proteins cause minimal signal changes, the TPEX platform enables direct quantification of exosomal markers in native biofluids, obviating any purification.
Fig. 1. Templated nanoplasmonics for multiparametric profiling of exosomes.
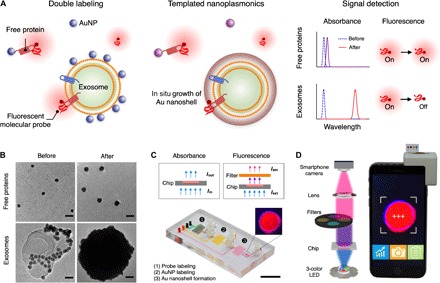
(A) Schematic of the TPEX platform. The technology is designed to measure exosomal markers and comprises three functional steps. Exosomes are first labeled with fluorescent molecular probes and AuNP. While AuNP remain well dispersed when associated with nonvesicle, free proteins, they assemble onto exosome periphery, through electrostatic interactions. Excess unbound probes and AuNP are not removed. In the presence of gold salt, the AuNP serve as seeds for in situ gold growth. The dispersed AuNP experience a small growth and a slight shift in their absorbance spectra, leading to minimal changes in the fluorescence signals of probes. The exosome-bound AuNP, on the other hand, develop into a nanoshell; this nanostructure is templated by the vesicle dimension and demonstrates a large red shift in its plasmonic resonance to effectively quench the fluorescence signal of probes bound onto the same vesicle. The TPEX fluorescence signal is thus multiparametric, for both exosomal biophysical characteristics and biomarker compositions. (B) Transmission electron micrographs of TPEX products. In the presence of free proteins, AuNP remained well dispersed (before) and demonstrated a small particle growth after treatment with gold salt (after). When incubated with exosomes, AuNP bound to vesicle periphery (before) and developed into large spherical particles after gold growth (after). Scale bars, 20 nm. (C and D) Photographs of the microfluidic device and the smartphone-based optical detector. Absorbance and fluorescence measurements could be performed on the integrated platform through different light-emitting diode (LED) sources and filter configurations. Scale bar, 1 cm.
To confirm the TPEX-induced changes in nanomaterial morphology, we performed transmission electron microscopy (TEM) analysis, before and after gold growth (Fig. 1B). In the presence of free proteins (fig. S2A), AuNP (mean diameter, 9.2 nm) remained well dispersed and demonstrated a small particle growth after TPEX reaction. When incubated with exosomes derived from human colorectal adenocarcinoma cell line (DLD-1) (fig. S2, B to D), AuNP bound to vesicle periphery. TEM analysis further confirmed the presence of large spherical particles after nanomaterial growth, consistent with the formation of exosome-templated gold nanoshell (fig. S3, A and B). Absorbance spectra of the formed nanomaterials corresponded well with the TEM characterization (fig. S3, C and D). To facilitate TPEX measurements of complex clinical biofluids, we implemented the technology in a miniaturized microfluidic system (Fig. 1C). The device incorporates serpentine mixers for efficient labeling and torque-activated valves for fluidic control (fig. S4A) and was designed to streamline the TPEX assay operation (fig. S4B). Furthermore, the microfluidic system can be loaded onto a custom-designed, smartphone-based optical detector (Fig. 1D), which enabled absorbance and fluorescence measurements through different configurations of light-emitting diode (LED) light source and filter setting. Image-based data acquisition and analysis could be achieved automatically through a smartphone interface.
Exosome-templated nanoplasmonics
To evaluate the size effect of biomarker template on TPEX plasmonic profile, so as to optimize the technology for exosome dimension, we first performed numerical simulations for a range of template diameters (Fig. 2A). On the basis of TEM characterization of the formed nanostructures (Fig. 1B and fig. S3), a 9-nm gold nanolayer was simulated to grow on the surface of exosome-sized template. The simulation results showed that for exosome diameters (30 to 150 nm), the resultant plasmonic resonance peaks locate predominantly at >600 nm (mean peak position at 750 nm), distinct from that formed of smaller templates (e.g., bare AuNP or AuNP associated with free proteins) (Fig. 2A). The electrical field distribution and normalized absorbance spectra further confirmed that the exosome-templated nanoshells demonstrate a strong resonance (~ 479-fold enhancement) at 750 nm and the bare AuNP-templated nanoparticles at 540 nm (fig. S5, A and B).
Fig. 2. TPEX absorbance analysis.
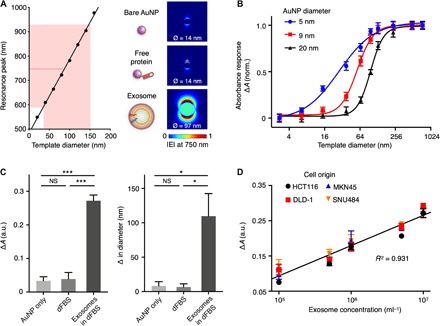
(A) Optical simulations with different-sized templates. On the basis of microscopy characterization of the formed TPEX nanostructures, we simulated the plasmonic resonance peaks of gold nanoshells developed on different-sized templates (left). For exosome-sized templates (30 to 150 nm; shaded red), the resultant plasmonic peaks locate predominantly at >600 nm. Red dotted line indicates the mean peak wavelength, formed from this range of template diameters, and locates to 750 nm. Electric field distributions at 750 nm were mapped for single AuNP (bare or particles associated with free proteins) and gold nanoshell (exosome-templated), formed after gold growth (right). Ø indicates particle diameter after gold growth. The simulations confirmed that nanoshells templated to exosome dimension could generate a strong plasmonic resonance at 750 nm |E|, electric field norm. (B) Tuning of the TPEX responsive range to template diameter. We incubated different-sized templates with AuNP of different diameters to form gold nanoshells. The TPEX absorbance measurement (A) is defined as the ratio of absorbance at 750 and 540 nm and its difference (ΔA) before and after gold growth. Using the 9-nm AuNP, the TPEX response range could be optimized to match exosome dimension, so as to maximize exosome-induced signals. (C) Experimental evaluation with biological samples. Exosomes derived from human colorectal adenocarcinoma (DLD-1) were spiked into vesicle-depleted fetal bovine serum (dFBS) and subjected to TPEX analysis with 9-nm AuNP. In all reactions, we measured the resultant absorbance (left) and diameter changes (right). Diameter changes were performed through dynamic light scattering analysis. Only samples containing exosomes demonstrated a large signal increment, while reactions in phosphate-buffered saline (PBS) (i.e., bare AuNP) and that in dFBS (i.e., free proteins) showed negligible changes. (D) Correlation of TPEX absorbance analysis with exosome concentration. Exosomes derived from four cell lines (DLD-1, HTC116, MKN45, and SNU484) were counted through nanoparticle tracking analysis (NTA) and evaluated by the TPEX absorbance analysis. All measurements were performed in triplicate, and the data are displayed as means ± SD in (B) to (D). *P < 0.05 and ***P < 0.0005, Student’s t test. NS, not significant; a.u., arbitrary units.
To experimentally validate the simulation results, we prepared polydopamine (PDA) nanoparticles as different-sized templates with well-defined diameter distribution (fig. S5, C and D) and incubated these templates with AuNP (mean diameter, 9.2 nm). The resultant absorbance spectra after templated nanomaterial growth confirmed the simulation results. In the absence of target template (i.e., bare AuNP), a single resonance peak was formed near 540 nm; when reacted with templates of increasing size, an additional resonance peak emerged at 750 nm (fig. S5E). We thus defined the TPEX absorbance measurement (A) as the ratio of absorbance at 750 and 540 nm and its difference (ΔA) before and after gold growth to evaluate the formation of large templated nanoshell. We found that using different-sized AuNP (fig. S6, A to C), we could fine-tune the responsive range of TPEX absorbance against templates of different diameters (Fig. 2B). We thus chose the 9-nm AuNP for all subsequent TPEX measurements to match the responsive range to exosome diameter (30 to 150 nm), thereby maximizing exosome-induced signals and minimizing background interference from other smaller biological entities.
We further validated the optimized TPEX absorbance analysis (ΔA) with biological samples. Exosomes derived from human colorectal adenocarcinoma (DLD-1) were spiked into vesicle-depleted fetal bovine serum (dFBS) and subjected to the TPEX reaction (fig. S2). The corresponding absorbance analysis reflected good selectivity for exosomes. Specifically, ΔA demonstrated a large increment only in the presence of exosomes and showed negligible changes for reactions in phosphate-buffered saline (PBS) (i.e., bare AuNP) and that in dFBS (i.e., free proteins) (Fig. 2C, left). A similar selectivity was observed for the resultant changes in a particle diameter, as determined by dynamic light scattering analysis, before and after gold growth (Fig. 2C, right). We attribute this good specificity of TPEX to its assay design, which exploits multiple biophysical properties of vesicles in forming distinct plasmonic profile; the negatively charged vesicle membrane facilitates electrostatic binding of AuNP, and the vesicle itself acts as a scaffold for developing size-compatible gold nanoshell whose plasmonic properties are templated by the vesicle diameter (fig. S6, D and E). Leveraging the specificity of TPEX absorbance analysis, we evaluated the system for determining exosome concentrations. Exosomes derived from various cell origins (DLD-1, HCT116, MKN45, and SNU484; fig. S7, A to D) were diluted to different concentrations, quantified by gold standard nanoparticle tracking analysis (NTA), before being spiked into dFBS. Across all spiked samples tested, TPEX absorbance analysis could directly determine exosome concentrations (fig. S7, E and F) and demonstrated a good correlation (R2 = 0.931) to the gold standard measurements (Fig. 2D).
Multiplexed fluorescence detection of exosomal markers
We next expanded the technology for multiplexed detection of exosome molecular markers. We used the plasmonic properties of the TPEX nanoshell to quench colocalized fluorescent probes. To evaluate the technology, we first prepared PDA nanoparticles of various sizes and attached fluorescent dyes [Alexa Fluor 647 (A647)] on the PDA surface. We subjected the nanoparticles to TPEX reactions (i.e., AuNP incubation and gold growth) and monitored changes in their fluorescence intensity (ΔF) and absorbance signal (ΔA) (Fig. 3A). Both analyses showed a similar trend and demonstrated a template size-responsive range that was optimized for exosome diameters.
Fig. 3. Multiplexed fluorescence analysis of exosome molecular markers.
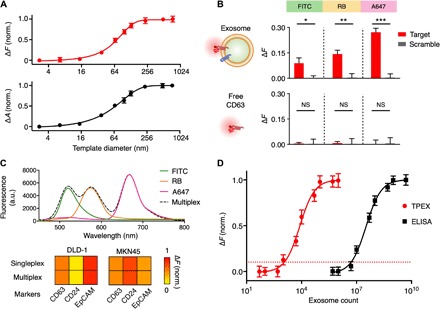
(A) TPEX fluorescence analysis. To evaluate whether TPEX nanoshell can be used to quench colocalized fluorescent probes, we prepared PDA nanoparticles as well-defined size templates and conjugated the particles with fluorescent dyes [Alexa Fluor 647 (A647)]. We treated the templates with TPEX reaction and measured the resultant changes in fluorescence (ΔF; top) and absorbance (ΔA; bottom). Both analyses showed a similar trend and demonstrated a template size-responsive range optimized for exosome diameters. (B) Assay specificity to exosome markers. We incubated whole exosomes (derived from DLD-1) that contain CD63 (top) and free CD63 (bottom) with fluorescent aptamers (anti-CD63 and scrambled control) for TPEX measurements. Only whole exosomes showed significant signals, while free CD63 samples demonstrated negligible signals. Of the different fluorescent dyes tested [fluorescein isothiocyanate (FITC), rhodamine B (RB), and A647], aptamers modified with A647 (emission of 665 nm, most closely matched to a TPEX absorbance of 750 nm) demonstrated the largest signal difference. (C) Multiplexed profiling of exosome markers. Exosomes were incubated with different fluorescent aptamers, either individually (singleplex) or as a mixture (multiplex), for TPEX analysis. The multiplex fluorescence spectrum agreed with the singleplex spectra (top) and showed accurate marker expression profiles across cell lines (bottom). (D) Molecular detection sensitivity. The limit of detection was determined by titrating a known quantity of exosomes and measuring their associating TPEX signal for CD63. The detection limit of enzyme-linked immunosorbent assay (ELISA) was independently assessed on the basis of chemiluminescence. All measurements were performed in triplicate, and fluorescence analysis was normalized against respective sample-matched scrambled controls. The data are displayed as means ± SD in (A), (B), and (D). *P < 0.05, **P < 0.005, and ***P < 0.0005, Student’s t test.
We next applied the TPEX fluorescence analysis for exosomal marker evaluation. Using CD63, a tetraspanin membrane protein found abundant in and characteristic of most exosomes (5, 26), as a positive control target, we prepared two samples to evaluate the technology specificity: whole exosomes that contain CD63 (derived from DLD-1 cell line) and free CD63 proteins (Fig. 3B). We incubated the samples with fluorescent aptamers (anti-CD63 and scrambled control) for TPEX measurements. Each aptamer was modified with three identical fluorescent molecules (fig. S8A) to enhance its signal performance (fig. S8, B and C). We also evaluated three different types of fluorescent dyes [i.e., fluorescein isothiocyanate (FITC), rhodamine B (RB), and A647], selected for their distinct excitation and emission profiles, to examine the effect of resonance spectral matching for TPEX analysis. Across all fluorescent dyes tested, TPEX showed significant signals only in the presence of exosomes and displayed negligible signals to free CD63 proteins. Aptamers modified with A647, which has an emission peak (665 nm) most closely matched to the TPEX absorbance (750 nm), demonstrated the largest signal difference (Fig. 3B). Consistent with a published report (27), these observations suggest that the TPEX fluorescence quenching is influenced by electron transfer at the gold nanoshell surface (i.e., distance effect) and spectral matching (i.e., plasmon and fluorescence).
Using different fluorescent aptamers, we developed a multiplexed TPEX analysis for simultaneous detection of exosomal markers in a single test. Exosomes derived from human cancer cells (i.e., DLD-1 and MKN45) were incubated with different fluorescent aptamers, either individually (singleplex) or as a mixture (multiplex), for TPEX measurements (Fig. 3C). The multiplex fluorescence spectrum agreed with the singleplex spectra and could accurately reveal marker expression profiles. In addition, this multiplexed TPEX assay could be adapted for protein measurements with fluorescent antibodies and expanded for in situ analysis of miRNAs in whole exosomes (fig. S9). We further determined the technology’s molecular detection sensitivity through a titration analysis (Fig. 3D). Exosome counts were measured through NTA. The measured TPEX response, as determined by CD63 aptamer analysis, correlated to exosome counts and established a limit of detection of ~1500 exosomes. This observed sensitivity was >103-fold better than that of enzyme-linked immunosorbent assay (ELISA) analysis.
In situ analysis in complex background
Next, we evaluated the TPEX platform to measure exosomal marker signatures against the complex biological background of native biofluids (i.e., human serum). We prepared mock clinical samples by spiking exosomes, derived from various human lines (i.e., DLD-1, HCT116, MKN45, GLI36vIII, and PC9) into vesicle-depleted human serum. On the basis of published literatures (26, 28), we measured the expression of the following protein markers: exosome marker CD63 and putative cancer markers including CD24, epithelial cell adhesion molecule (EpCAM), and mucin 1 (MUC1). We performed TPEX analysis on the spiked samples through the miniaturized microfluidic system and smartphone detection platform (Fig. 1, C and D), which showed good performance correlation to commercial readers (fig. S10, A to C). For all serum-spiked samples, we also performed comparative analysis with conventional sandwich ELISA assays.
For each marker analyzed, when compared to the pure exosome signatures (obtained from the identical exosomes before spiking), the TPEX analysis showed a better concordance to reflect the expression trends across cell lines (Fig. 4A). Specifically, the TPEX analysis of the spiked samples showed a good correlation (R2 = 0.9299; Fig. 4B, left) to the pure exosome signatures, while the ELISA measurements performed on the same spiked samples showed a significantly poorer correlation (R2 = 0.03211; Fig. 4B, right). We attribute this performance difference to TPEX’s multiselectivity (i.e., exosomal biophysical properties and biomarker compositions) in measuring exosomal markers directly against complex background. The ELISA analysis, however, is only marker sensitive and could be susceptible to free-floating forms of the target proteins [e.g., unbound proteins in human plasma (29)].
Fig. 4. Exosome analysis in complex background.
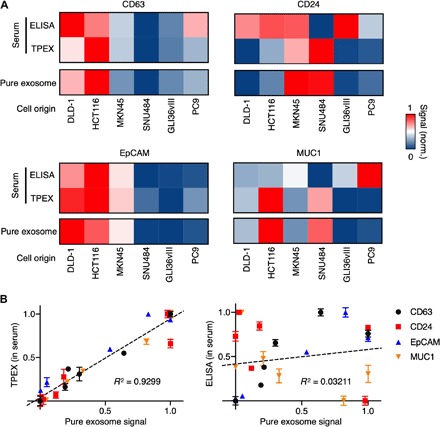
(A) TPEX analysis of mock clinical samples. Samples were prepared by spiking exosomes, derived from six human lines into vesicle-depleted human serum. In these spiked samples, we measured exosome marker CD63 and putative cancer markers including CD24, EpCAM, and MUC1. All protein measurements of the spiked samples were performed by multiplex TPEX analysis on a microfluidic platform, as well as conventional singleplex sandwich ELISA. The analyses were compared against marker signatures of pure exosomes (obtained from exosomes before spiking). For each marker analyzed, the TPEX analysis showed a better concordance to reflect the expression trends across cell lines. (B) Correlation of TPEX measurements with pure exosome signatures. The TPEX detection showed a good correlation to the pure exosome analysis (left), while the conventional ELISA measurements performed on the same spiked samples showed a significantly poorer correlation (right). All measurements were performed in triplicate, against respective sample-matched scrambled controls. The data are assay-normalized and displayed as means in (A) and as means ± SD in (B).
TPEX classification of clinical prognosis
To evaluate the clinical utility of TPEX, we lastly conducted a feasibility study using patient ascites samples. We aimed at addressing the following questions: (i) if TPEX could be directly applied to clinical specimens for multiplexed measurements, (ii) the accuracy of TPEX in distinguishing exosomal targets, and (iii) if the TPEX signatures could differentiate additional clinical characteristics (e.g., prognosis). We obtained cancer ascites samples (n = 20; 12 colorectal cancer and 8 gastric cancer) and used the miniaturized microfluidic and detector platform (Fig. 1, C and D) to perform multiplexed TPEX molecular analysis directly on these samples (1 μl for each native sample) (Fig. 5A, top). As a comparison, we also performed conventional, singleplex ELISA analysis to measure total target proteins in all clinical samples (Fig. 5A, bottom). The TPEX analysis (exosomal targets) showed different protein expression profiles to that measured by the ELISA analysis (total targets), consistent with published report (30). Across all clinical samples tested, the TPEX analysis of CD63 could reflect vesicle counts, as determined by gold standard NTA, while ELISA analysis of total CD63 proteins showed a poor concordance to the counts (fig. S10, D to F).
Fig. 5. TPEX analysis of patient prognosis.
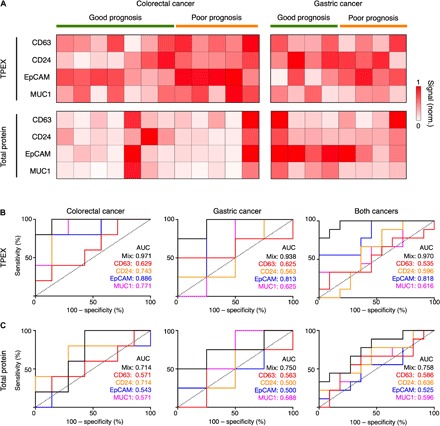
(A) Analysis of protein markers in clinical cancer ascites (n = 20; 12 colorectal cancer and 8 gastric cancer) using multiplex TPEX for measurement of vesicle-associated target markers (top) and conventional singleplex ELISA for measurement of total target markers (bottom). TPEX analysis showed different protein expression profiles as compared to the ELISA analysis. (B and C) Receiver operating characteristic (ROC) curves of the TPEX (B) and ELISA (C) regression models on ascites samples of colorectal cancer (left), gastric cancer (middle), and both cancer types (right). ROC curves were constructed using individual markers or a combination of the target markers (mix). The TPEX analysis showed a higher accuracy in prognosis classification across both cancers as compared to the ELISA assay. All measurements were performed in triplicate, against respective sample-matched scrambled controls. The data are assay-normalized and displayed as means in (A).
Using individual patient survival data, as determined from the length of survival after ascites collection, we used the TPEX and ELISA measurements to develop regression scoring models for classification of disease prognosis. We validated these models using leave-one-out cross-validation and compared the performance of these models (mix) and individual markers through receiver operating characteristic (ROC) curve analysis (Fig. 5, B and C). The TPEX model showed a higher accuracy in outcome classification, across both cancer types [area under curve (AUC), 0.970; Fig. 5B], while the ELISA analysis of total target proteins showed a lower accuracy (AUC, 0.758; Fig. 5C). We attribute this improved TPEX performance to the following possibilities. Ascites contain target protein markers in different organizational states (e.g., exosome-bound and unbound). Recent studies have shown that these proteins are released through different mechanisms and play different roles in disease progression, suggesting the potential utility of exosomes as a more reflective indicator of disease aggressiveness and poor prognosis. Specifically, while free-floating membrane proteins are generally released during cell death, exosomes are secreted during active tumor growth and carry multiple cargoes to promote metastasis (12, 13). TPEX’s ability to distinguish and measure these reflective vesicle indicators could thus facilitate better disease stratification.
DISCUSSION
Exosomes play an important role in mediating disease progression. Among other heterogeneous circulating factors found in bodily fluids, their orchestrated release by actively dividing cancer cells and functional activities in conditioning tumor microenvironment highlight the clinical potential of exosomes as a more reflective biomarker (12, 13). Despite these recent discoveries, direct and specific analysis of exosomes in native clinical specimens remains challenging because of limitations of existing analytical approaches (14). Specifically, exosomes are distinguished by unique biophysical and biomolecular properties; current detection of the exosome population, however, relies primarily on either biophysical or biochemical characterization, performed in an independent or sequential manner (16). This analysis not only tends to miss vesicle subpopulations but also fails to provide simultaneous, multiparametric analysis of vesicle biophysics and biomolecular composition.
To overcome these challenges, we developed the TPEX platform as a dedicated analytical platform for multiselective molecular profiling of exosomes directly in clinical samples, through simultaneous and in situ evaluation of biophysical and biochemical compositions of the same vesicles. As compared to conventional analytical technologies, which enable univariate biophysical or biomolecular characterization, TPEX is well suited for rapid and multiparametric analysis of exosomes (fig. S10G): (i) the assay design is multiselective, for exosome biophysical properties (e.g., membrane envelope and characteristic dimensions) and colocalized biomolecular contents of the same vesicles; (ii) the technology can be adapted to measure diverse exosomal biomarkers (e.g., proteins and miRNAs) but remain unresponsive to nonvesicle, free molecules; and (iii) its implementation with the smartphone-based sensor not only enables multimodal analysis (e.g., absorbance and fluorescence) but also streamlines the assay process to obviate any washing steps. The entire assay can be completed in as little as 15 min while requiring 1 μl of native sample. Using the developed technology, we demonstrated that the TPEX platform could distinguish biomarker organizational states (i.e., exosome-associated versus total biomarkers) and that the exosomal subpopulation of biomarkers could reveal improved correlations, previously masked by total measurements, to enable better patient stratification.
The scientific applications of the developed technology are potentially broad. With its robust ability to differentiate biomarker organization in native clinical samples, the TPEX technology could be readily expanded to measure other molecules and modifications and investigate their incorporation and/or association with diverse vesicles. Since the nanoshell growth is templated by vesicle biophysics, its plasmonic properties could be tuned to measure other extracellular vesicles of distinct sizes (e.g., oncosomes) (31) and molecular subtypes (e.g., derived from different cell origins) (3). Further technical improvements through incorporating other molecular probes (32) and advanced recognition mechanisms (33, 34) could enhance the analytical performance of the technology to measure even rare and complex molecular modifications. These studies will not only facilitate comprehensive vesicle characterization but also provide additional insights about compositional changes of secreted factors during disease progression.
The technology could also be developed and adapted for diverse clinical benefits. Specifically, the TPEX platform could be applied to find new biomarker signatures and refine existing clinical biomarkers, through the incorporation of multiparametric analysis of biomarker organization, vesicle biophysics, and molecular composition (14). These developments will not only distinguish biomarker subpopulations but could also shed light on the biophysical and/or biochemical properties of the associated biomarkers, thereby providing a new avenue to establishing accurate composite signatures (35). For clinical translation, the developed technology and composite signatures should be rigorously validated in large-scale clinical studies, across a spectrum of diseases (e.g., cancers of different origins and molecular subtypes). The TPEX platform is well suited for clinical validation trials; it is fast, sensitive, and wash-free. With its demonstrated robustness in native patient specimens, the system could be applied to small volumes of clinical samples (e.g., ascites and serum) to enable rapid data collection and multiparametric biomarker evaluation. Further technical developments, through the incorporation of advanced microfluidics (36–38) and array-type sensor integration (35), could enable highly parallel processing and facilitate large-scale clinical validation.
METHODS
Cell culture
All human cancer cell lines were obtained from American Type Culture Collection. DLD-1, HCT116, and GLI36vIII were grown in Dulbecco’s modified Eagle’s medium (HyClone) supplemented with 10% FBS (Gibco) and 1% penicillin-streptomycin (Gibco). MKN45, SNU484, and PC9 were cultured in RPMI 1640 medium wmycin. All cell lines were tested and free of mycoplasma contamination (MycoAlert Mycoplasma Detection Kit, Lonza, LT07-418).
Exosome isolation and quantification
Cells at passages 1 to 15 were cultured in vesicle-depleted medium (containing 5% dFBS) for 48 hours before vesicle collection. All media containing extracellular vesicles were filtered through a 0.2-μm membrane filter (Millipore), isolated by differential centrifugation (first at 10,000g and subsequently at 100,000g). For independent quantification of vesicle concentration, we used the NTA system (NS300, NanoSight). Vesicle concentrations were adjusted to obtain ~50 vesicles in the field of view to achieve optimal counting. All NTA measurements were performed with identical system settings for consistency.
Synthesis and characterization of AuNP
All chemicals used for synthesis and modification were purchased from Sigma-Aldrich, unless otherwise stated. AuNP were prepared by a sodium citrate approach (39). Briefly, different-sized AuNP were synthesized by varying the amount of sodium citrate in the reaction. In a typical synthesis, to prepare AuNP with a diameter of 9 nm, 50 ml of sodium citrate tribasic dehydrate (0.6 mg/ml) was heated to boil. Subsequently, 250 μl of gold(III) chloride trihydrate (HAuCl4·3H2O; 20 mg/ml) was quickly injected into the boiling solution and reacted for 30 min to produce AuNP. After cooling to room temperature, 9 ml of the prepared solution was mixed with 1 ml of polyethylenimine (PEI; 10% in water) to replace the surface ligand on AuNP. The PEI-coated AuNP were then centrifuged at 20,000g for 1 hour to remove excess reactants and resuspended and kept at 4°C for future use. For AuNP characterization, we measured particle core diameters with TEM (JEOL 2010F). Hydrodynamic diameter and zeta potential of AuNP were determined with Zetasizer Nano ZS instrument (Malvern). Measurement runs (3 × 14) were performed. Z-average diameter and polydispersity were analyzed. For every measurement, the autocorrelation function and polydispersity index were monitored to ensure sample quality for size determination. Optical absorbance of AuNP was measured spectroscopically (Tecan).
Synthesis and characterization of PDA particles
To prepare different-sized PDA nanoparticles as target templates, 1 ml of dopamine hydrochloride (0.5 mg/ml in water) was mixed with a varying volume of sodium hydroxide solution (4 mg/ml; volume varied from 1 to 50 μl). The mixture was incubated at 25°C under stirring condition for 12 hours to produce PDA particles with well-defined diameters. All particles were stored at 4°C for subsequent use. Particle size distribution was determined by dynamic light scattering analysis, as described above. To label PDA particles with respective fluorophores (e.g., FITC, RB, and A647), fluorescent dyes dissolved in dimethyl sulfoxide were added to the PDA solution (0.5 mg/ml). The mixture was incubated at 25°C for 12 hours, before sample purification. Fluorescence intensity was measured through a microplate reader (Tecan).
Preparation of fluorescent aptamers
DNA sequences, modified with a primary amine group at the 3′ end, were purchased from Integrated DNA Technologies and dissolved in water to a final concentration of 10 μM. Sequences include CD63 (CACCCCACCTCGCTCCCGTGACACTAATGCTA), CD24 (TATGTGGGTGGGTGGGCGGTTATGCTGAGTCAGCCTTGCT), EpCAM (CACTACAGAGGTTGCGTCTGTCCCACGTTGTCATGGGGGGTTGGCCTG), and MUC1 (GCAGTTGATCCTTTGGATACCCTGG). To enhance the fluorescence performance of the aptamers, we labeled a single aptamer sequence with three fluorescent molecules. Specifically, 100 μl of aptamer solution was reacted with 10 μl of N,N-methylenebisacrylamide (1 mM) for 12 hours at 37°C to produce acrylated aptamer. This purified reaction was added to an excess of four-arm poly(ethylene glycol) with free amines (4 arm–PEG2K-NH2; molecular weight, 2000; 100 μM, 40 μl) for 12 hours at 37°C. Last, fluorescent dyes (e.g., A647) were conjugated to the free amines on the PEGylated aptamers. After each reaction step, the modified aptamers were purified by a centrifugal filter (Amicon; molecular cutoff, 3000) to remove excess reactants. Purified fluorescent aptamers were kept at −20°C for future use.
Optical simulation
Full three-dimensional (3D) finite-difference time-domain (FDTD) simulations were performed using a commercial software package (FDTD Solutions, Lumerical). On the basis of TEM analysis of the formed nanostructures, the exosome-templated gold nanoshell was modeled as a core-shell structure, with a dielectric core of refractive index of 1.4 (40), surrounded by a 9-nm-thick gold shell. The complex dielectric constants for gold were obtained from reference (41). In simulating the field distribution of AuNP bound to free proteins, as experimentally characterized with dFBS, AuNP with a final diameter of 14 nm after growth was modeled to attach to a 3-nm protein. A uniform mesh of 2 nm was applied in all directions. In all simulations, the formed gold nanostructures were illuminated with a plane wave from the top, and the transmitted (absorbance) spectrum was recorded at the bottom. We used the simulated electric field distribution and absorbance spectra to identify the corresponding resonance peaks of nanostructures templated by exosomes and free proteins, respectively.
TPEX absorbance assay
To experimentally evaluate and validate the optical simulations, we first performed the TPEX assay on PDA nanoparticles of different diameters. We used these PDA nanoparticles as target templates with well-defined size distribution. Briefly, we incubated 5 μl of PDA solution with 5 μl of AuNP solution for 15 min at room temperature to enable self-assembly of AuNP on PDA surface. Without any purification, we added to this reaction a mixture containing 10 μl of hydrogen peroxide (3%), 35 μl of PBS buffer, and 40 μl of gold salt (HAuCl4·3H2O; 1 mg/ml). We incubated the reaction for 15 min to enable templated in situ gold growth. Absorbance spectra were recorded before and after gold growth to compare the experimental results against that of the simulations. To investigate the effect of AuNP diameter in tuning the TPEX absorbance response, we incubated the PDA nanoparticles with different-sized AuNP, before subjecting the reactions to gold growth. We chose the 9-nm AuNP for all subsequent TPEX measurements, so as to match and maximize the TPEX responsive range to published exosome diameter. We further applied this optimized TPEX assay on biological samples. We prepared extracellular vesicles and dFBS through differential centrifugation, as described above. All samples were characterized by NTA and dynamic light scattering analysis. Biological samples were treated with AuNP and subjected to gold growth, as described above in the PDA reactions. Corresponding absorbance spectra, before and after gold growth, were measured spectroscopically.
TPEX fluorescence assay
For detection of molecular markers, we developed the TPEX fluorescence assay. We optimized the assay with fluorescent anti-CD63 aptamers. Using exosomes isolated from cell lines and free CD63 proteins (Proteintech), we incubated these samples with 0.5 μl of fluorescent aptamer (10 μM) for 30 min. Subsequently, 5 μl of AuNP (9 nm) was added to this reaction and incubated for 15 min. Without any purification, we added 10 μl of hydrogen peroxide (3%), 35 μl of PBS buffer, and 40 μl of gold salt (HAuCl4·3H2O; 1 mg/ml) to this reaction, as described above. For multiplexed fluorescence detection, different fluorescent aptamers were added to the sample and incubated simultaneously before AuNP incubation. For all TPEX fluorescence measurements, we included a sample-matched control, which was incubated with scrambled aptamers. Fluorescence intensities, before and after the TPEX reactions, were measured.
TPEX analysis
On the basis of optical simulation and experimental validation, we defined the TPEX absorbance and fluorescence measurements as follows:
where Aafter is the TPEX absorbance signal (A) after AuNP incubation and gold growth and Abefore is the TPEX absorbance signal (A) after AuNP incubation but before gold growth.
where A750 and A540 are absorbance intensities at a wavelength of 750 and 540 nm, respectively.
where Fsample is the fluorescence intensity of the sample, incubated with target probe of distinct emission spectrum, after gold growth, and Fcontrol is the fluorescence intensity of sample-matched control, incubated with scrambled fluorescent probe, after gold growth.
TPEX antibody and miRNA detection
For TPEX measurement with antibodies, we isolated exosomes from various cell lines and incubated the samples with fluorescent antibodies (anti-CD63, BD Biosciences, and anti-CD24, eBioscience; 1 μg/ml). Without any purification, we added AuNP and gold salt mixture to this reaction, as described above, and measured the resultant changes in fluorescence. All measurements were compared against gold standard ELISA analysis using the same antibodies (see below for details).
For TPEX miRNA detection, whole exosomes were subjected to additional fixation and permeabilization (BD Biosciences), before being labeled with fluorescent DNA probes against miRNA targets (Integrated DNA Technologies; 10 μM). Without any purification, we added AuNP and gold salt mixture to this reaction, as described above, and measured the resultant changes in fluorescence. All measurements were compared against gold standard TaqMan assays (Thermo Fisher Scientific) through polymerase chain reaction (Applied Biosystems).
Microfluidic device fabrication
A prototype microfluidic device comprising three regions (fig. S4A) was fabricated through standard soft lithography. Briefly, 50-μm-thick cast molds were patterned with SU-8 photoresist and silicon wafers using a cleanroom mask aligner (SUSS MicroTec) and developed after ultraviolet (UV) exposure. Polydimethylsiloxane (PDMS; Dow Corning) and cross-linker were mixed at a ratio of 10:1 and casted on the SU-8 mold. The polymer was first cured at 75°C for 30 min. Then, multiple nylon screws and hex nuts (RS Components) were positioned on the PDMS film over their respective channels and embedded in the PDMS, before a final curing step.
Microfluidic TPEX assay
Operation steps of the microfluidic assay are illustrated in fig. S4B. In a typical procedure, 1 μl of biological sample and 0.3 μl of fluorescent aptamer solution (10 μM) were loaded into the microchannel through inlet 1 and inlet 2, respectively. This solution was mixed thoroughly in the serpentine channel to facilitate aptamer labeling of exosomal membrane biomarkers. A mixture containing 1 μl of AuNP, 2 μl of hydrogen peroxide (3%), and 8 μl of PBS buffer, preloaded at inlet 3, was introduced to the reaction and allowed to mix for 5 min in the microchannel at a flow rate of 2 μl/min. Last, 7 μl of gold salt (HAuCl4·3H2O; 1 mg/ml), preloaded at inlet 4, was added to the reaction and allowed to mix for 3 min in the microchannel. The resultant fluorescence intensity was recorded through a smartphone-based optical sensor.
Smartphone-based sensor
To enable smartphone analysis of the microfluidic TPEX assay, we developed a sensor that comprised four components (Fig. 1C): a 3D-printed optical cage, a three-color LED source, three optical filters, and a magnification lens. The optical cage was fabricated from a UV-curable resin (HTM 140) using a desktop 3D printer (EnvisionTEC, Aureus). The LED light source (Chaoziran S&T) was customized with three LED diodes, with central wavelengths at 365, 540, and 750 nm, respectively (fig. S10A). Three bandpass filters with center wavelengths of 520, 590, and 665 nm were used for measurements of FITC, RB, and A647, respectively. The magnification lens (Thorlabs, LA4280) was placed before the smartphone camera to improve the image quality. The assembled system measured 45 mm (width) by 45 mm (length) by 50 mm (height) in dimension and was equipped with two sliding slots for quick attachment to smartphones (Apple). Sensor performance was evaluated against a commercial microplate reader (Tecan) for different fluorescent dyes and intensities (fig. S10C).
Western blotting
Exosomes isolated by ultracentrifugation were lysed in radioimmunoprecipitation assay buffer containing protease inhibitors (Thermo Fisher Scientific) and quantified using bicinchoninic acid assay (Thermo Fisher Scientific). Protein lysates were resolved by SDS–polyacrylamide gel electrophoresis, transferred onto polyvinylidene fluoride membrane (Invitrogen), and immunoblotted with antibodies against protein markers: CD63 (Invitrogen), Alix (Cell Signaling Technology), HSP70 (BioLegend), LAMP-1 (BD Biosciences), Flotillin 1 (BD Biosciences), and TSG101 (BD Biosciences). Following incubation with horseradish peroxidase–conjugated secondary antibody (Cell Signaling Technology), enhanced chemiluminescence was used for immunodetection (Thermo Fisher Scientific).
Enzyme-linked immunosorbent assay
Capture antibodies (5 μg/ml) were adsorbed onto ELISA plates (Thermo Fisher Scientific) and blocked in PBS containing 1% bovine serum albumin before incubation with samples. After washing with PBS with 0.05% Tween 20, detection antibodies (1 μg/ml) were added and incubated for 2 hours at room temperature. Following incubation with horseradish peroxidase–conjugated secondary antibody (Thermo Fisher Scientific) and chemiluminescent substrate (Thermo Fisher Scientific), chemiluminescence intensity was determined (Tecan).
Transmission electron microscopy
Sample solutions were directly deposited onto the surface of formvar-carbon film-coated copper grid (Latech). Dried samples were imaged with a transmission electron microscope (JEOL 2010F).
Clinical measurements
The study was approved by the National University Hospital (2016/01088) and SingHealth (2015/2479) Institutional Review Boards (IRBs). All individuals were recruited according to IRB-approved protocols after obtaining informed consent. Ascites samples were collected from patients with colorectal cancer and gastric cancer, centrifuged at 500g for 10 min, and filtered through a 0.2-μm membrane filter (Millipore). All samples were deidentified and stored at −80°C before TPEX measurements.
For clinical TPEX analysis, ascites samples were used directly. We incubated the ascites samples with fluorescent aptamers against different biomarkers and subjected the samples to TPEX reactions (i.e., AuNP incubation and in situ gold growth). For all TPEX measurements, we included a patient sample-matched, scrambled control. TPEX analysis was performed relative to this control to account for nonspecific binding of aptamers. Clinical evaluation of patient characteristics was determined independently. Specifically, patient prognosis was determined by the overall survival from the time of collection of ascites. Patients were deemed to have a good prognosis when the overall survival was more than 10 months. Conversely, patients were determined to have a poor prognosis if the overall survival was less than 5 months. All TPEX measurements were performed blinded from these clinical evaluations.
Statistical analysis
All measurements were performed in triplicate, and the data were displayed as means ± SD. Significance tests were performed via a two-tailed Student’s t test. For intersample comparisons, multiple pairs of samples were each tested, and the resulting P values were adjusted for multiple hypothesis testing using Bonferroni correction. An adjusted P < 0.05 was determined as significant. Correlation analysis was performed with linear regression to determine the goodness of fit (R2). For clinical analysis, we used the TPEX and ELISA measurements to develop multiple linear regression scoring models for the classification of disease prognosis. To avoid overfitting and evaluate performance, we conducted leave-one-out cross-validation. For a single marker, ROC curves were determined from the marker expression. For multimarker analysis, ROC curves were plotted on the basis of the regression scorings. Statistical analyses were performed using R (v.3.5.0) and GraphPad Prism (v.7.0c).
Supplementary Material
Acknowledgments
We thank X. Qiu, J. W. S. Tan, C. Y. J. Chee, and S. C. Teo for assistance with clinical sample collection. Funding: This work was supported in part by funding from National University of Singapore (NUS), NUS Research Scholarship, Ministry of Education, National Medical Research Council, Institute for Health Innovation and Technology, IMCB Independent Fellowship, and NUS Early Career Research Award. Author contributions: X.W., H.Z., and H.S. designed the study. C.-A.J.O., M.C.C.T., and J.B.Y.S. provided deidentified clinical samples and health information. X.W., H.Z., A.N., C.Z.J.L., and N.R.Y.H. performed the research. X.W., H.Z., A.N., and H.S. analyzed the data and wrote the manuscript. All authors contributed to the manuscript. Competing interests: The authors declare that they have no competing interests. Data and materials availability: All data needed to evaluate the conclusions in the paper are present in the paper and/or the Supplementary Materials. Additional data related to this paper may be requested from the authors.
SUPPLEMENTARY MATERIALS
Supplementary material for this article is available at http://advances.sciencemag.org/cgi/content/full/6/19/eaba2556/DC1
REFERENCES AND NOTES
- 1.Speicher M. R., Pantel K., Tumor signatures in the blood. Nat. Biotechnol. 32, 441–443 (2014). [DOI] [PubMed] [Google Scholar]
- 2.Colombo M., Raposo G., Théry C., Biogenesis, secretion, and intercellular interactions of exosomes and other extracellular vesicles. Annu. Rev. Cell Dev. Biol. 30, 255–289 (2014). [DOI] [PubMed] [Google Scholar]
- 3.van Niel G., D’Angelo G., Raposo G., Shedding light on the cell biology of extracellular vesicles. Nat. Rev. Mol. Cell Biol. 19, 213–228 (2018). [DOI] [PubMed] [Google Scholar]
- 4.Lim C. Z. J., Zhang L., Zhang Y., Sundah N. R., Shao H., New sensors for extracellular vesicles: Insights on constituent and associated biomarkers. ACS Sens. 5, 4–12 (2020). [DOI] [PubMed] [Google Scholar]
- 5.Shao H., Chung J., Balaj L., Charest A., Bigner D. D., Carter B. S., Hochberg F. H., Breakefield X. O., Weissleder R., Lee H., Protein typing of circulating microvesicles allows real-time monitoring of glioblastoma therapy. Nat. Med. 18, 1835–1840 (2012). [DOI] [PMC free article] [PubMed] [Google Scholar]
- 6.Choi D.-S., Kim D.-K., Kim Y.-K., Gho Y. S., Proteomics of extracellular vesicles: Exosomes and ectosomes. Mass Spectrom. Rev. 34, 474–490 (2015). [DOI] [PubMed] [Google Scholar]
- 7.Valadi H., Ekström K., Bossios A., Sjöstrand M., Lee J. J., Lötvall J. O., Exosome-mediated transfer of mRNAs and microRNAs is a novel mechanism of genetic exchange between cells. Nat. Cell Biol. 9, 654–659 (2007). [DOI] [PubMed] [Google Scholar]
- 8.Skog J., Würdinger T., van Rijn S., Meijer D. H., Gainche L., Sena-Esteves M., Curry W. T., Carter B. S., Krichevsky A. M., Breakefield X. O., Glioblastoma microvesicles transport RNA and proteins that promote tumour growth and provide diagnostic biomarkers. Nat. Cell Biol. 10, 1470–1476 (2008). [DOI] [PMC free article] [PubMed] [Google Scholar]
- 9.Maas S. L. N., Breakefield X. O., Weaver A. M., Extracellular vesicles: Unique intercellular delivery vehicles. Trends Cell Biol. 27, 172–188 (2017). [DOI] [PMC free article] [PubMed] [Google Scholar]
- 10.Wang Z., Sun X., Natalia A., Tang C. S. L., Beng C. T. A., Ong C.-A. J., Teo M. C. C., So J. B. Y., Shao H., Dual-selective magnetic analysis of extracellular vesicle glycans. Matter 2, 150–166 (2020). [Google Scholar]
- 11.McAndrews K. M., Kalluri R., Mechanisms associated with biogenesis of exosomes in cancer. Mol. Cancer 18, 52 (2019). [DOI] [PMC free article] [PubMed] [Google Scholar]
- 12.Minciacchi V. R., Freeman M. R., Di Vizio D., Extracellular vesicles in cancer: Exosomes, microvesicles and the emerging role of large oncosomes. Semin. Cell Dev. Biol. 40, 41–51 (2015). [DOI] [PMC free article] [PubMed] [Google Scholar]
- 13.Wortzel I., Dror S., Kenific C. M., Lyden D., Exosome-mediated metastasis: Communication from a distance. Dev. Cell 49, 347–360 (2019). [DOI] [PubMed] [Google Scholar]
- 14.Shao H., Im H., Castro C. M., Breakefield X., Weissleder R., Lee H., New technologies for analysis of extracellular vesicles. Chem. Rev. 118, 1917–1950 (2018). [DOI] [PMC free article] [PubMed] [Google Scholar]
- 15.Ligler F. S., Gooding J. J., Lighting up biosensors: Now and the decade to come. Anal. Chem. 91, 8732–8738 (2019). [DOI] [PubMed] [Google Scholar]
- 16.Gardiner C., Di Vizio D., Sahoo S., Théry C., Witwer K. W., Wauben M., Hill A. F., Techniques used for the isolation and characterization of extracellular vesicles: Results of a worldwide survey. J. Extracell. Vesicles 5, 32945 (2016). [DOI] [PMC free article] [PubMed] [Google Scholar]
- 17.Witwer K. W., Buzás E. I., Bemis L. T., Bora A., Lässer C., Lötvall J., Nolte-‘t Hoen E. N., Piper M. G., Sivaraman S., Skog J., Théry C., Wauben M. H., Hochberg F., Standardization of sample collection, isolation and analysis methods in extracellular vesicle research. J. Extracell. Vesicles 2, 20360 (2013). [DOI] [PMC free article] [PubMed] [Google Scholar]
- 18.Lee K., Shao H., Weissleder R., Lee H., Acoustic purification of extracellular microvesicles. ACS Nano 9, 2321–2327 (2015). [DOI] [PMC free article] [PubMed] [Google Scholar]
- 19.Zhang P., Zhou X., He M., Shang Y., Tetlow A. L., Godwin A. K., Zeng Y., Ultrasensitive detection of circulating exosomes with a 3D-nanopatterned microfluidic chip. Nat. Biomed. Eng. 3, 438–451 (2019). [DOI] [PMC free article] [PubMed] [Google Scholar]
- 20.Shao H., Chung J., Lee K., Balaj L., Min C., Carter B. S., Hochberg F. H., Breakefield X. O., Lee H., Weissleder R., Chip-based analysis of exosomal mRNA mediating drug resistance in glioblastoma. Nat. Commun. 6, 6999 (2015). [DOI] [PMC free article] [PubMed] [Google Scholar]
- 21.Ko J., Bhagwat N., Black T., Yee S. S., Na Y.-J., Fisher S., Kim J., Carpenter E. L., Stanger B. Z., Issadore D., miRNA profiling of magnetic nanopore-isolated extracellular vesicles for the diagnosis of pancreatic cancer. Cancer Res. 78, 3688–3697 (2018). [DOI] [PubMed] [Google Scholar]
- 22.Xin H., Namgung B., Lee L. P., Nanoplasmonic optical antennas for life sciences and medicine. Nat. Rev. Mat. 3, 228–243 (2018). [Google Scholar]
- 23.Sánchez-Purrà M., Roig-Solvas B., Rodriguez-Quijada C., Leonardo B. M., Hamad-Schifferli K., Reporter selection for nanotags in multiplexed surface enhanced raman spectroscopy assays. ACS Omega 3, 10733–10742 (2018). [DOI] [PMC free article] [PubMed] [Google Scholar]
- 24.Cifuentes-Rius A., de Puig H., Kah J. C., Borros S., Hamad-Schifferli K., Optimizing the properties of the protein corona surrounding nanoparticles for tuning payload release. ACS Nano. 7, 10066–10074 (2013). [DOI] [PubMed] [Google Scholar]
- 25.Sriram M., Zong K., Vivekchand S. R. C., Gooding J. J., Single nanoparticle plasmonic sensors. Sensors (Basel) 15, 25774–25792 (2015). [DOI] [PMC free article] [PubMed] [Google Scholar]
- 26.Im H., Shao H., Park Y. I., Peterson V. M., Castro C. M., Weissleder R., Lee H., Label-free detection and molecular profiling of exosomes with a nano-plasmonic sensor. Nat. Biotechnol. 32, 490–495 (2014). [DOI] [PMC free article] [PubMed] [Google Scholar]
- 27.Abadeer N. S., Brennan M. R., Wilson W. L., Murphy C. J., Distance and plasmon wavelength dependent fluorescence of molecules bound to silica-coated gold nanorods. ACS Nano 8, 8392–8406 (2014). [DOI] [PubMed] [Google Scholar]
- 28.Zaborowski M. P., Lee K., Na Y. J., Sammarco A., Zhang X., Iwanicki M., Cheah P. S., Lin H.-Y., Zinter M., Chou C.-Y., Fulci G., Tannous B. A., Lai C. P.-K., Birrer M. J., Weissleder R., Lee H., Breakefield X. O., Methods for systematic identification of membrane proteins for specific capture of cancer-derived extracellular vesicles. Cell Rep. 27, 255–268.e6 (2019). [DOI] [PMC free article] [PubMed] [Google Scholar]
- 29.Gidlöf O., Evander M., Rezeli M., Marko-Varga G., Laurell T., Erlinge D., Proteomic profiling of extracellular vesicles reveals additional diagnostic biomarkers for myocardial infarction compared to plasma alone. Sci. Rep. 9, 8991 (2019). [DOI] [PMC free article] [PubMed] [Google Scholar]
- 30.Ji H., Greening D. W., Barnes T. W., Lim J. W., Tauro B. J., Rai A., Xu R., Adda C., Mathivanan S., Zhao W., Xue Y., Xu T., Zhu H.-J., Simpson R. J., Proteome profiling of exosomes derived from human primary and metastatic colorectal cancer cells reveal differential expression of key metastatic factors and signal transduction components. Proteomics 13, 1672–1686 (2013). [DOI] [PubMed] [Google Scholar]
- 31.Meehan B., Rak J., Di Vizio D., Oncosomes—Large and small: What are they, where they came from. J. Extracell. Vesicles 5, 33109 (2016). [DOI] [PMC free article] [PubMed] [Google Scholar]
- 32.Samanta D., Ebrahimi S. B., Mirkin C. A., Nucleic-acid structures as intracellular probes for live cells. Adv. Mater. 32, e1901743 (2019). [DOI] [PMC free article] [PubMed] [Google Scholar]
- 33.Ho N. R. Y., Lim G. S., Sundah N. R., Lim D., Loh T. P., Shao H., Visual and modular detection of pathogen nucleic acids with enzyme-DNA molecular complexes. Nat. Commun. 9, 3238 (2018). [DOI] [PMC free article] [PubMed] [Google Scholar]
- 34.Sundah N. R., Ho N. R. Y., Lim G. S., Natalia A., Ding X., Liu Y., Seet J. E., Chan C. W., Loh T. P., Shao H., Barcoded DNA nanostructures for the multiplexed profiling of subcellular protein distribution. Nat. Biomed. Eng. 3, 684–694 (2019). [DOI] [PubMed] [Google Scholar]
- 35.Lim C. Z. J., Zhang Y., Chen Y., Zhao H., Stephenson M. C., Ho N. R. Y., Chen Y., Chung J., Reilhac A., Loh T. P., Chen C. L. H., Shao H., Subtyping of circulating exosome-bound amyloid β reflects brain plaque deposition. Nat. Commun. 10, 1144 (2019). [DOI] [PMC free article] [PubMed] [Google Scholar]
- 36.Yeh E.-C., Fu C.-C., Hu L., Thakur R., Feng J., Lee L. P., Self-powered integrated microfluidic point-of-care low-cost enabling (SIMPLE) chip. Sci. Adv. 3, e1501645 (2017). [DOI] [PMC free article] [PubMed] [Google Scholar]
- 37.Lim G. S., Hor J. H., Ho N. R. Y., Wong C. Y., Ng S. Y., Soh B. S., Shao H., Microhexagon gradient array directs spatial diversification of spinal motor neurons. Theranostics 9, 311–323 (2019). [DOI] [PMC free article] [PubMed] [Google Scholar]
- 38.Yelleswarapu V., Buser J. R., Haber M., Baron J., Inapuri E., Issadore D., Mobile platform for rapid sub-picogram-per-milliliter, multiplexed, digital droplet detection of proteins. Proc. Natl. Acad. Sci. U.S.A. 116, 4489–4495 (2019). [DOI] [PMC free article] [PubMed] [Google Scholar]
- 39.Link S., El-Sayed M. A., Size and temperature dependence of the plasmon absorption of colloidal gold nanoparticles. J. Phys. Chem. B. 103, 4212–4217 (1999). [Google Scholar]
- 40.Gardiner C., Shaw M., Hole P., Smith J., Tannetta D., Redman C. W., Sargent I. L., Measurement of refractive index by nanoparticle tracking analysis reveals heterogeneity in extracellular vesicles. J. Extracell. Vesicles 3, 25361 (2014). [DOI] [PMC free article] [PubMed] [Google Scholar]
- 41.E. D. Palik, in Handbook of Optical Constants of Solids: Comments on the Optical Constants of Metals and an Introduction to the Data for Several Metals (Academic Press, 1997), vol. 1, pp. 286. [Google Scholar]
Associated Data
This section collects any data citations, data availability statements, or supplementary materials included in this article.
Supplementary Materials
Supplementary material for this article is available at http://advances.sciencemag.org/cgi/content/full/6/19/eaba2556/DC1