

Abstract
Objective
Road traffic injuries (RTI) cause ~1.2 million deaths and 50 million injuries annually, disproportionately occurring in low- and middle-income countries. Although policy changes and infrastructural developments have continued to contribute to the decrease in RTI-related deaths, limited studies have investigated the relationship between motorcycle taxi driver behaviors and RTIs in Rwanda. This study aims to describe the safety behaviors of commercial motorcyclists in Kigali, Rwanda.
Methods
We surveyed 609 commercial motorcyclists in January 2014 then conducted a cross-sectional analysis of the results, including descriptive and bivariate logistic regression analyses.
Results
We found that 38.7% of surveyed motorcycle drivers experienced a crash during their lifetime, of which, more than half (n=134, 56.8%) suffered injuries. Of all injuries, 38.8% (n=52) resulted in hospitalization, and 14.2% (n=19) in disability. Among motorcyclists, 100% reported always wearing a helmet, 99% reported always wearing a chin strap, and 98.8% reported always having a passenger helmet. There was an association between sustaining a crash and believing that helmets (p=0.08) and chin straps (p=0.05) reduced crash risk.
Conclusions
Rwandan commercial motorcyclists demonstrate generally proper safety behaviors, but remain a high-risk occupational group. Road safety policy initiatives have been effective in changing driver behavior regardless of driver safety beliefs.
Keywords: Road traffic injury, Rwanda, motorcycle, behavior, safety
1. INTRODUCTION
Globally, road traffic injuries (RTIs) are the 9th leading cause of death amongst all age groups. {World Health Organization, Road Safety in the African Region 2015, 2016}. Specifically, for people between the ages of 15 and 29, RTIs are the leading cause of death and are among the top 3 causes for all people aged 5–44 {World Health Organization, Road Safety in the African Region 2015, 2016}. In addition to the estimated 1.2 million deaths per year, another 50 million people sustain non-fatal injuries as a result of RTIs {Mathers C, The Global Burden of Disease: 2004 Update, 2008}. Despite having fewer motorized vehicles, the majority of RTIs occur in low- and middle-income countries (LMICs) {WHO, Global status report on safety 2013: supporting a decade of action, 2013}. Sub-Saharan Africa, in particular, has the highest rate of road-traffic deaths in the world at 24.1 per 100,000 population, {WHO, Global status report on safety 2013: supporting a decade of action, 2013} despite having only 2% of the world’s vehicles {WHO, Global status report on safety 2013: supporting a decades of action, 2013}. In contrast to high income countries (HICs), where overall RTIs are decreasing, the number of RTIs are increasing in LMICs with only a limited increase in RTI research {Vissoci, Joao Ricardo N, Road traffic injury in Sub-Saharan African countries: a systematic review and summary of observational studies} {WHO, Global status report on safety 2013: supporting a decade of action, 2013}. This is attributed to increased motorization, urbanization, and economic growth without a concomitant expansion of infrastructure, law enforcement, and safety prevention {Peden, M., World report on road traffic injury prevention: summary, 2004}. As a result, by 2030, RTIs are expected to nearly double and become the 7th leading cause of death globally {World Health Organization, Road Safety in the African Region 2015, 2016}.
Rwanda, a low-income country with a population of ~11.7 million, {National Institute of Statistics of Rwanda, Fourth Rwanda Population and Housing Census Thematic Report on Population size, structure and distribution, 2014} has been cited as a positive example of how policy changes and infrastructure developments can decrease death rates from RTIs {WHO, The health of the people: The African regional health report, 2006}. In 1995, Rwanda was noted to have one of the highest rates of RTI-related deaths in the world {Brown, Hannah, Rwanda s road-safety transformation, 2007}. The following decade saw the development of policy and enforcement of speed limits, mandatory motorcycle helmet use and anti-drink driving regulations that contributed to the 35% reduction in road deaths observed at one hospital between 2002 and 2005 {Twagirayezu, E, Road Traffic Injuries in Kigali University Central Teaching Hospital, Rwanda, 2008} {Brown, Hannah, Rwanda s road-safety transformation, 2007}. Similarly, government statistics showed a continued decline in traffic deaths by 2.5% between 2011 and 2012 {Rwanda Ministry of Internal Security, Combating Road Traffic Accidents., 2013}.
Motorcycles and motorcycle taxis are common modes of transportation in Rwanda. In 2012, there were 47,622 motorcycles registered in Rwanda, representing 44.3% of all vehicles {World Health Organization, Road Safety in the African Region, 2015}. The largest percentage of motorcyclists reside in the capital city, Kigali, which has an adult population of approximately 700,000 {National Institute of Statistics of Rwanda, Fourth Rwanda Population and Housing Census Thematic Report on Population size, structure and distribution, 2014}. As of 2012, Kigali had 18,502 motorcycles registered as taxis, meaning that there is one motorcycle for every 37.8 adults {Rwanda Utilities Regulatory Agency, Key Statistics in Road Transport, 2012}. The number of motorcycle taxis is increasing faster than other forms of transportation, at a rate nearly double that of registered buses and car taxis between 2009 and 2012. {Rwanda Utilities Regulatory Agency, Key Statistics in Road Transport, 2012}.
Despite the legislative and enforcement progress in Rwanda, commercial motorcyclists are still working long hours in poor safety conditions, increasing their risk of sustaining a crash {Staton, CA, High road utilizers surveys compared to police data for road traffic crash hotspot localization in Rwanda and Sri Lanka, 2016}. As a result, there is still a significant public health burden from injuries related to motorcycle crashes. While previous studies have investigated dangerous driving locations and general practices in Rwanda, {Twagirayezu, E, Road Traffic Injuries in Kigali University Central Teaching Hospital, Rwanda, 2008} {Patel A., The epidemiology of road traffic injury hotspots in Kigali, Rwanda from police data, 2016} none have investigated driver safety behavior and knowledge of safe driving practices. We hypothesize that there is limited driver safety knowledge and behavior which would be a potential area of focus for future interventions. Therefore, we conducted a community-based survey in Kigali, Rwanda aimed at evaluating demographics, crash and injury history, as well as safety practices of motorcycle drivers.
2. METHODS
2.1. Ethics
This study was approved by the University Teaching Hospital of Kigali Ethical Committee; the National Health Research Council of the Ministry of Health of Rwanda; and Institutional Review Board of Duke University in Durham, North Carolina.
2.2. Study Design and Participants
In January 2014 we conducted a cross-sectional analysis of 609 commercial motorcyclists from a high road user survey study conducted in Kigali, Rwanda. Six experienced research personnel completed two days of intensive training before spending a period of five days surveying participants in the Municipality of Kigali. We enrolled participants who were identified as “full-time” drivers (i.e. worked at least 8 hours/day, 4 days/week on average), geographically located in this city for 6 months prior to the enrollment date. The national moto (motorcycle taxi) driver association formally designates stands to provide service in the most populated locations across Kigali. Particular stands were chosen in order to ensure spatial representation of the city. At each of these stands, the first ten moto drivers encountered were offered questionnaire participation by trained research assistants who conducted the surveys in Kinyarwanda after verbally obtaining informed consent. Study personnel conducted the surveys during daytime hours both weekdays and weekends. Due to safety and staffing limitations we were not able to have investigators interview drivers overnight. As most drivers work over twelve hours per day, we anticipate some overlap in drivers who work nights/evenings with those interviewed at different times of the day. Participants completed an interviewer-administered questionnaire, which assessed basic demographic information, road use, crash history, and PPE use, as well as beliefs regarding the risky behaviors of other drivers.
2.3. Study Setting
The Republic of Rwanda, which is located in the central and east Africa region, has a population of nearly 12 million {National Institute of Statistics of Rwanda, Fourth Rwanda Population and Housing Census Thematic Report on Population size, structure and distribution, 2014}. Although 84% of the country’s residents live in rural areas, Rwanda is the third most densely populated country in Africa {National Institute of Statistics of Rwanda, Fourth Rwanda Population and Housing Census Thematic Report on Population size, structure and distribution, 2014}. Rwanda has a youthful population, with 43.4 percent of all Rwandans under 15 years of age {National Institute of Statistics of Rwanda, Fourth Rwanda Population and Housing Census Thematic Report on Population size, structure and distribution, 2014}.
Among the urban population, 49 percent live in Kigali, the capital and the largest city in Rwanda {National Institute of Statistics of Rwanda, Fourth Rwanda Population and Housing Census Thematic Report on Population size, structure and distribution, 2014}. Kigali is centrally located in Rwanda and spans 730 km2. The province of Kigali City is administered through three districts: Gasabo, Kicukiro, and Nyarugenge.
2.4. Data Collection
The survey was translated into Kinyarwanda and all research assistants who collected the data were fluent in Kinyarwanda and had English proficiency. Study staff received extensive training in data collection and quality assurance checks were performed on the data collected. Piloting of the survey was conducted in Kigali in order to ensure question comprehension and appropriateness, as well as technology capacity. For instance, we removed questions whether boda boda drivers have helmets for themselves or passengers as it is required by law that they do, and instead asked about the availability of hairnets for passengers which might reduce concerns about transmittable infections. Pilot testing also affirmed that collection of data via tablet computers and tabulation of data directly into an online database was feasible and appropriate. In addition to the responses to direct questions some data regarding the condition and fit of the helmets used by moto drivers was collected by visual inspection of the helmets. Surveys were intentionally brief to maximize participation and minimize potential loss of income; moto drivers were reimbursed at about the average cost of a ride for their time participating in the research. Reimbursement was provided at $0.68USD, and can be referenced against the Rwandan average monthly income of $61.03USD {National Institute of Statistics of Rwanda, Labour Force Survey, 2016}. Research assistants then entered survey data directly into an online database via tablet computers without personal identifiers in order to maintain anonymity. Respondents were assured of anonymity in order to minimize reporting bias. Data collectors were asked to assure that unique drivers completed each survey. Because each taxi stand was assigned to a specific data collector, who completed all surveys during a singular visit to that stand (with rare exceptions), we do not believe that there is a large risk of a single driver completing the survey more than one time. Each data collector was directly observed by the study coordinator while they conducted an interview to assure procedures were followed. Data were collected on tablets with a predefined Redcap form designed to limit errors through text validation. Completeness of data was verified first by the collector, then data quality of every interview was checked by the study coordinator and then checked again by author EK.
2.5. Variables
The sociodemographic variables analyzed included age, hours worked per day, days worked per week, work start time, work end time, and years worked. Road traffic crash (RTC) outcome variables included have ever been involved in a crash or experiencing a near miss (missing a crash). Of those who had experienced an RTC, we investigated how many suffered an injury, had been hospitalized, missed days of work, and indications of suffering due to RTI. Safety variables included the use of helmets, helmet conditions, as well as opinions regarding the risky behaviors of other commercial motorcyclists. A list of the questions asked regarding safety behaviors is displayed in Table 1.
Table 1.
Questions asked regarding safety behaviors of commercial motorcyclists.
| Variables | Questions asked |
|---|---|
| Helmet use | How often do you wear a helmet when you are on a motorcycle? |
| Helmet strap use | Do you buckle the helmet strap when you use your helmet? |
| Peer helmet use | How often do you think your moto driver colleagues wear helmets? |
| Peer risk behavior | How often do you think your moto driver colleagues take risks while driving? |
| Hairnets for passengers | Do moto drivers have hair-nets available for passengers? |
| Headlights always | Do you run your headlight at all times when using your moto? |
| Headlights at night | Do you run your headlight on your moto after dark? |
| New helmet if damaged | Do moto drivers purchase a new helmet after a crash or if it has been damaged? |
| Helmet cracks observed | Does the driver’s helmet have cracks or dents in the shell of the helmet? |
| Helmet broken strap observed | Does the driver’s helmet have a broken chin strap? |
| Helmet scratches observed | Does the driver’s helmet have scratches in the paint? |
| Helmet screen shield | Is the face shield of the drivers helmet obscured by scratches, paint, or a graphic? |
| Helmet properly fit observed | Does the driver’s helmet fit the driver well? |
| Helmet reduce risk | Do you believe helmets reduce injuries from crashes? |
| Helmet straps reduce risk | Do you believe helmet straps are important to reduce injuries from crashes? |
2.6. Data Analysis
Descriptive analysis on the socio-demographic characteristics, crashes, injuries, and safety behavior was performed using frequencies and proportions. We then used chi-square tests and t-tests to explore the relationship between demographics and safety behaviors, with having experienced a crash. We dichotomized variables regarding safety behaviors, categorizing individual’s personal protective behavior as “not always using” or “always using” PPE and other driver risky behaviors as “always” or “not always” occurring. We discerned the options as always and not always because our goal was to evaluate the ideal scenario of optimal use of safety behavior in relation to an increased risk of not using of momentary usage.
Latent class analysis:
Latent Class Analysis (LCA) was conducted to define taxonomies derived from the safety behavior variables of participants. This derivation created a conjunction of latent categorical variables grouping individuals with similar safety behavior profiles. Classification was performed through maximum likelihood estimation, and through several different iterations of modeling. This resulted in driving the categorization through the probability of classifying an individual properly, giving the best possible model fitness. Model fitness was assessed through: (a) model interpretability, meaning the model’s ability to represent a theoretical hypothesis, (b) class size, where classes containing less than 5% of the sample considered possible false classes {Hipp, John R, Local solutions in the estimation of growth mixture models, 2006}, and (c) Bayesian information criteria (BIC) and Akaike information criteria (AIC) {Nylund, Karen L, Deciding on the number of classes in latent class analysis and growth mixture modeling: A Monte Carlo simulation study, 2007}. In addition, logistic regression models were conducted to evaluate a potential association of participants’ sociodemographic profiles and barriers to accessing care.
3. RESULTS
3.1. Demographics
In our sample of 609 commercial motorcyclists, the mean age was 30.08 (SD ± 6.46, range 16–74) and all respondents were male. Participants reported using their motorcycles an average of 76.42 hours per week, 12.5 hours per day and 6.11 days per week. Participants had worked as commercial motorcyclists for an average of 5.39 years at the time of survey. There were no statistically significant differences between drivers who experienced a crash and those who did not in regards to age, experience, hours worked per day, or work start and end time.
3.2. Crash/Injury Data
A majority of participants (n=373, 61.3%) reported that they had never been involved in a road traffic crash in their lifetime. Of those that had been in a crash, more than half (n=134, 56.8%) suffered an injury as a result of their crash. A majority of drivers (88.8%) reported at least one near miss in the month before taking the survey, with 338 (55.5%) drivers reporting 1–4 near misses the month before taking the survey, 71 (11.7%) reporting more than 15 near misses, and 68 (11.2%) reporting no near misses (Table 3). There was no association between crash history and age, experience, or hours worked.
Table 3.
Injury and Health Outcomes of Commercial Motorcyclists in Rwanda.
| Variable | Road traffic outcomes |
|---|---|
| Suffered a RTC - N (%) | 236 (38.7) |
| Suffered a RTI - N (%) | 134 (22.0) |
| Near Miss within 1 Month - N (%) | |
| Zero | 68 (11.2) |
| <5 | 338 (55.5) |
| 5–10 | 90 (14.8) |
| 10–15 | 42 (7.0) |
| >15 | 71 (11.7) |
| Time of crash - N (%) | |
| Morning | 203 (33.3) |
| Daytime | 123 (20.2) |
| Evening | 213 (35.0) |
| Nighttime | 51 (8.4) |
| Injury Location - N (%) | |
| Head or face | 20 (14.9) |
| Chest | 5 (3.7) |
| Abdominal | 15 (11.2) |
| Upper Extremity | 17 (12.7) |
| Lower Extremity | 25 (18.7) |
| Spinal | - |
| Participants Hospitalized** - N (%) | 52 (38.8) |
| Length of hospital stay (days) - Mean (sd) | 14 (2; 30) |
| Disability amongst injured participants ** - N (%) | 19 (14.2) |
| Type of Disability (n = 19) - N (%) | |
| Chronic daily pain | 13 (68.4) |
| Injury altering daily life | 5 (26.3) |
| Other | 1 (5.3) |
| Days of work missed due to injury (n = 51) - Median (IQR) | 14 (3;60) |
Of the 134 participants reporting an injury
Of the 236 drivers reporting a crash, 134 (56.8%) experienced an injury as a result of the worst crash they experienced. Injuries involving a lower extremity (n=25, 40.9%) and the head (n= 20, 32.7%) were most common. Surveyed drivers reported the occurrence of 52 (38.8%) injuries that resulted in hospitalization with a median hospital stay of 14 days. Among those drivers who were injured, 19 (14.2%) suffered from at least one disability or permanent injury as a result. Of those injuries sustained (n=19), 13 (68.4%) consisted of chronic daily pain and 5 (26.3%) were injuries that altered daily life. Of the 134 injuries that occurred, 128 (95.5%) resulted in missed days of work and the median number of days missed was 14 (IQR 3;60).
3.3. Safety Behaviors Data and Crash/Injury Data
When surveyed about the use of PPE, all respondents reported always using a helmet while on a motorcycle (Table 1), while a high percentage also reported using helmet straps (99.0%, n=603) and having helmets for passengers (98.8%, n=602). A majority of respondents were observed to have a helmet with the proper fit (82.3%, n=501) and a screen shield (71.9%, n=438). While many drivers were observed to have either helmet scratches (34.6%, n=211) or cracks (19.2%, n=117), only 44.0% (n=268) of participants reported buying new helmets whenthey became damaged. The majority of commercial motorcyclists believed that wearing a helmet (77.8%, n=474) and using helmet straps (73.1%, n=445) reduced the risk of injury. Commercial motorcyclists who had a previous RTC were less likely to have bought a new helmet when it got damaged (P=0.01), and less likely to believe that helmet straps reduced risk of injury (P=0.05).
Nearly all respondents reported using their headlights at night (98.7%, n=601), while 62.1% (n=378) responded always using headlights during the day. There was no significant difference between headlight use among drivers that had and had not previously been in a crash.
Typology:
Safety behavior classes differences are represented in Figure 1A by the percentage of the sample. Participants were best classified into three different latent classes. Class one (21% of the sample, N = 128) was named Good Safety Behavior for this sample because of the high value attributed to helmet, helmet buckle strap use and good helmet condition (no scratches, cracks or buying a new one when damaged) (i.e. >90%). Class two (16% of the participants, N = 97), labeled Moderate Safety Behavior, had lower proportions of value attributed to helmet use and helmet buckle use, and participants also showed more damage to the helmet than in the previous class. The third class (63% of the participants, N = 384) was labeled Poor Safety Behavior as participants scored low in nearly all safety behavior indicators (Figure 1A), with exception to having a good helmet fit and helmet buckle. A latent class model showed adequate interpretability in differentiating safety behaviors and a high entropy (0.93). AIC and BIC values were significantly different for the 3 classes model in relation to the model for 4 and 2 classes. The 3 class model was ultimately used as four or more classes showed poor adjustment by presenting lower entropy, suggesting spurious classification.
Figure 1.
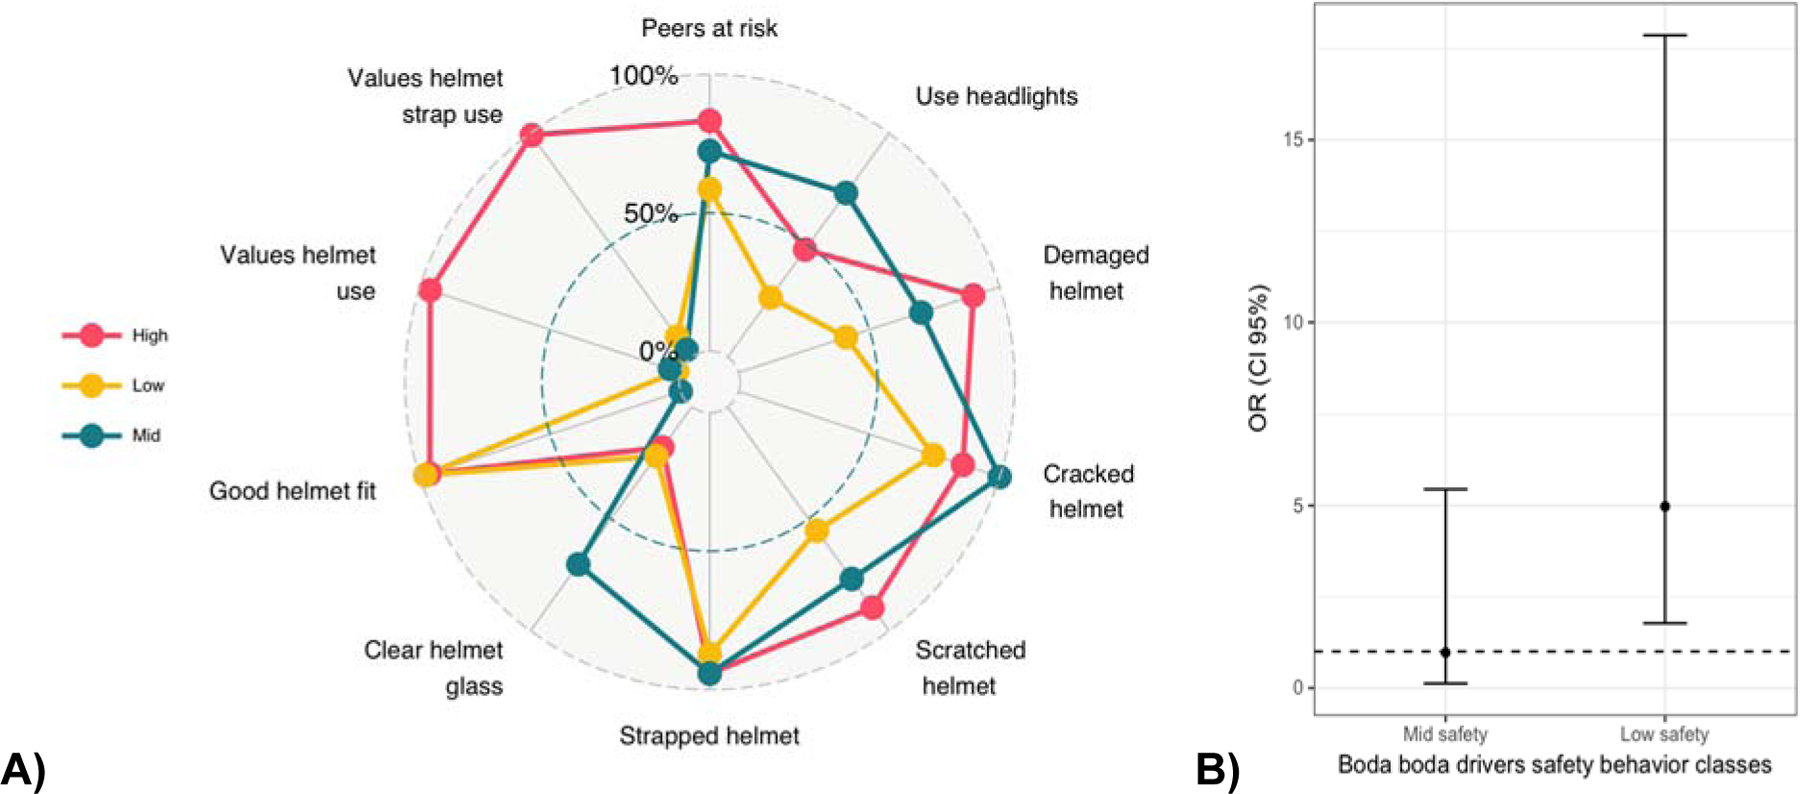
Boda boda driver safety behavior classes characteristics (A) and association with having a crash in the past year (B).
Comparing participants’ reasons for avoiding seeking care revealed that the value attributed to helmet use, its ability to protect from injury, and its condition differentiated between classes. In a logistic regression model, participants in the Poor Safety Behavior class were five times more likely to have experienced a crash (OR 5.00; CI 95% 1.77;17.87) in relation to participants belonging to the Good Safety Behavior class (Figure 1B). The Moderate Safety Behavior class did not differ in crash/injury outcomes when compared to the Good Safety Behavior class. No association was observed with road traffic injuries between the classes.
3.4. Suggestions for Improvement
When asked about ways to improve the road traffic environment to reduce crashes and injuries, most respondents suggested the need for educational and advertising campaigns making drivers aware of the presence of motorcycle taxis (60.4%, n=368). Some commercial motorcyclists suggested improving driver training for motorcycles (37.9%, n=231) and improvement of road conditions (23.5%, n=143). No statistical significant differences were observed in the suggestions for improvement in relation to previous involvement in a RTC (Table 4).
Table 4.
Suggestions for improvement offered by commercial motorcyclists
| Road traffic crashes | ||||
|---|---|---|---|---|
| Overall (N=609) | Yes (n=236) | No (n=373) | p | |
| Creation of motorcycle lane | 37 (6.1) | 20 (8.6) | 17 (4.6) | 0.049 |
| Improved road condition | 143 (23.5) | 56 (20.0) | 87 (23.5) | 0.909 |
| Decreased traffic density | 68 (11.2) | 28 (12.0) | 40 (10.8) | 0.663 |
| More traffic regulation | 101 (16.6) | 42 (18.0) | 59 (15.9) | 0.522 |
| Make other vehicles aware of motos | 368 (60.4) | 242 (60.5) | 141 (61.4) | 0.785 |
| More walkways | 96 (15.8) | 34 (14.6) | 62 (16.8) | 0.465 |
| Improved driver training for motos | 231 (37.9) | 89 (38.4) | 142 (38.2) | 0.929 |
4. DISCUSSION
4.1. Overview
This is the first-community-based survey of commercial motorcyclists in Rwanda characterizing their safety behaviors and beliefs, in addition to demographics, crash and injury burden. All drivers were male, with an average age of 30.08 years and just over 5 years (5.39) of driving experience (Table 2). Demographic information did not vary significantly between groups regarding history of RTC or RTI. Drivers work an average of 6.11 days per week for a total of 76.47 hours per week which is similar to data from other sub-Saharan African countries, {Boateng, LA, Sleep Habits and Road Traffic Accident Risk among Long Distance Drivers at Circle Transport Yard, 2014} {Johnson, OE, Effect of health education on the riding habits of commercial motorcyclists in Uyo, Southern Nigeria, 2012} {Oginni, Fadekemi O, Knowledge, attitude, and practice of Nigerian commercial motorcyclists in the use of crash helmet and other safety measures, 2007} indicating that long hours are a ubiquitous job requirement for commercial motorcyclists. Our previous report showed that up to 60% of all crashes resulting in death or disability occur at night or near dawn {Patel, The epidemiology of road traffic injury hotspots in Kigali, Rwanda from police data, 2016}. These findings suggest that driver fatigue, in combination with low visibility and decreased overnight bus service, resulting in increased motorcycle taxi usage, make driving at night especially hazardous.
Table 2.
Demographics and Safety Behaviors Characteristics of Commercial Motorcyclists in Rwanda.
| Previous Road traffic Crash | ||||
|---|---|---|---|---|
| Overall (N=609) | Yes (n=236) | No (n=373) | p | |
| Sociodemographics (mean, SD) | ||||
| Age | 30.08 (6.46) | 30.39 (6.29) | 29.89 (6.56) | 0.246 |
| Hours worked per day | 12.5 (2.02) | 12.58 (2.06) | 12.45 (2) | 0.445 |
| Days per week | 6.11 (0.62) | 6.1 (0.61) | 6.12 (0.63) | 0.683 |
| Hours per week | 76.47 (15.22) | 76.84 (15.72) | 76.24 (14.92) | 0.642 |
| Years worked | 5.39 (4.08) | 5.67 (4.02) | 5.21 (4.12) | 0.173 |
| Safety behaviors (n, %) | ||||
| Helmet Motorcycle | 609 (100) | 236 (100) | 373 (100) | - |
| Helmet Strap Use | 603 (99.0) | 230 (97.4) | 373 (100) | - |
| Moto Hairnets for Passengers | 602 (98.8) | 235 (99.6) | 367 (98.4) | 0.258 |
| Headlights always | 378 (62.1) | 139 (58.9) | 239 (64.1) | 0.199 |
| Headlights at night | 601 (98.7) | 233 (98.7) | 368 (98.7) | 0.942 |
| New helmet if damaged | 268 (44.0) | 82 (34.7) | 186 (49.9) | 0.001* |
| Helmet cracks observed | 117 (19.2) | 47 (19.9) | 70 (18.8) | 0.726 |
| Helmet scratches observed | 211 (34.6) | 83 (35.2) | 128 (34.3) | 0.829 |
| Helmet screen shield | 438 (71.9) | 165 (69.9) | 273 (73.2) | 0.381 |
| Helmet properly fit observed | 501 (82.3) | 197 (83.5) | 304 (81.5) | 0.534 |
| Peer risk behavior | 208 (34.2) | 79 (33.5) | 129 (34.6) | 0.778 |
| Peer helmet use | 603 (99.0) | 368 (98.7) | 235 (99.6) | 0.450 |
| Helmet reduce risk | 474 (77.8) | 175 (28.7) | 299 (49.1) | 0.082 |
| Helmet straps reduce risk | 445 (73.1) | 162 (68.6) | 283 (75.9) | 0.050* |
significant at p<0.05
4.2. Safety Behaviors and Beliefs
Overall, the percentage of drivers who had been involved in a crash in their lifetime (38.7%) is slightly lower compared to surveys done in other sub-Saharan African countries such as Nigeria (48.5%) {Oginni, Fadekemi O, Knowledge, attitude, and practice of Nigerian commercial motorcyclists in the use of crash helmet and other safety measures, 2007} and Ghana (40.8%) {Boateng, LA, Sleep Habits and Road Traffic Accident Risk among Long Distance Drivers at Circle Transport Yard, 2014}. Also notable is that reported safety behaviors were extremely high, with 100% of drivers stating that they consistently wear a helmet and nearly all (98.8%) having helmets available for passengers. In contrast, ~25% of drivers in nearby Kenya and Tanzania reported wearing a helmet, {Bachani, Abdulgafoor M, Road traffic injuries in Kenya: the health burden and risk factors in two districts, 2012} {Chalya, Phillipo L, Injury characteristics and outcome of road traffic crash victims at Bugando Medical Centre in Northwestern Tanzania, 2012} with a study in Kenya reporting <5% of passengers having a helmet {Bachani, Abdulgafoor M, Road traffic injuries in Kenya: the health burden and risk factors in two districts, 2012}. While Rwanda has historically been heralded for its strict enforcement of helmet use, such findings may also be related to a high cultural acceptance of motor vehicle safety behaviors when compared to neighboring countries.
Drivers who had been involved in a crash were less likely to replace their helmet if damaged compared to drivers who had not been involved in a crash, however, other safety behaviors did not vary significantly between the two groups. There was an association between not having been in a RTC and the belief that wearing the helmet strap reduced risk (p = 0.050), as well as believing that helmets reduce risk (p = 0.082). It is possible that the decreased belief in the importance of safety practices, similar to not replacing a broken helmet, are indicators of overall riskier driving behaviors, explaining the higher number of RTCs in this group. When comparing both crash rates and driver safety practices of nearby countries, the fact that nearly all drivers wear helmets and straps suggests that a strong central government policy of implementation and enforcement of road traffic laws is an effective way to change behavior.
4.3. Under Reporting
While nearly 40% of drivers had experienced a crash in their lifetime, only 8.5% of all participants reported being hospitalized. This means that 61.2% of participants who suffered a crash-related injury did not report to a hospital. Although not all injuries may have been severe enough to necessitate hospitalization, these findings suggest that using hospital records alone to quantify the burden of disease of both RTCs and RTIs will substantially underestimate the actual burden of injury. Unfortunately, other methods of reporting are similarly flawed, necessitating a multi-faceted approach to RTC estimation. In fact, a meta-analysis from 13 countries showed that ~30% of severe injuries and 75% of non-severe injuries were unreported {Elvik, Rune, Incomplete accident reporting: meta-analysis of studies made in 13 countries, 1999} and the WHO estimates that the true burden of road traffic fatalities may be as much as 4 times greater than the official estimates {World Health Organization, Road Safety in the African Region, 2015}. Our previous report comparing police records to road users surveys showed that surveys are a reliable way to account for previously unreported RTCs. Our current findings further support surveys of road users as an adjunctive source of road traffic crash data.
4.4. Strengths and Limitations
This study drew on a very representative sample of Rwandan motorcycle drivers. Respondents were recruited from motorcycle stands in the capital city of Kigali. The survey is the first to examine the safety behaviors and beliefs in this occupational population. Because the survey was community-based, it did not exclude RTIs that were unreported in police or hospital records. Additionally, although participants were given assurance of their anonymity, there is a possibility of reporting bias, especially related to helmet use, due to fear of prosecution.
This study likely underestimates the burden of injury and incidence of crashes amongst motorcycle drivers. Only current drivers were interviewed, meaning that drivers who had sustained major disability or death as a result of a crash would be missed. This results in recall and survivor bias, although we cannot know to what extent this would affect our findings. Additionally, although surveyors informed participants of the surveyors affiliation with the healthcare team and not the police or government, as well as ensured anonymity, there may be an element of reporting bias due to fear of prosecution or other penalty which serves to overestimate the reported safety behaviors. Lastly, because the data collected was cross-sectional, no causal relationships could be inferred from the survey results.
5. CONCLUSIONS
In conclusion, this study sought to better delineate behavior patterns of motorcycle drivers who are a high-risk occupational group with a significant burden of RTI-related disability and permanent injury. This study determined that behavior change of boda boda drivers was associated with perceived enforcement improvement of road safety laws. Finally, this study provides further evidence indicating that there is a large burden of underreported road traffic injuries in Rwanda.
Supplementary Material
Acknowledgements
This project would not have been possible without the collaboration and support of our Rwandan data collection team and the Rwandan Federation of Motorcycle Taxi Drivers (FERWACOTAMO).
Funding
The authors acknowledge funding for this study from the Fogarty International Center (K01 TW010000-01A1 to C.S., R25 TW009887 to B.M. and E.K.) and the National Institute of Neurological Disorders and Stroke of the National Institutes of Health (NIH) (R25 TW009887-06S3 to B.M.). The content is solely the responsibility of the authors and does not necessarily represent the official views of the NIH. Additional financial support for this project was provided by the Duke Global Health Institute. Funders of this project played no role in study design, data collection, data analysis, interpretation of data, writing of this report or the decision to submit the article for publication.
References
- Agency, R. U. R. (2012). Key Statistics in Road Transport. Retrieved from Kigali, Rwanda: [Google Scholar]
- Bachani AM, Koradia P, Herbert HK, Mogere S, Akungah D, Nyamari J, … Stevens KA (2012). Road traffic injuries in Kenya: the health burden and risk factors in two districts. Traffic injury prevention, 13(sup1), 24–30. [DOI] [PubMed] [Google Scholar]
- Boateng L (2014). Sleep Habits and Road Traffic Accident Risk among Long Distance Drivers at Circle Transport Yard. University of Ghana, [Google Scholar]
- Brown H (2007). Rwanda s road-safety transformation. Bulletin of the World Health Organization, 85(6), 425–426. [DOI] [PMC free article] [PubMed] [Google Scholar]
- Chalya PL, Mabula JB, Dass RM, Mbelenge N, Ngayomela IH, Chandika AB, & Gilyoma JM (2012). Injury characteristics and outcome of road traffic crash victims at Bugando Medical Centre in Northwestern Tanzania. Journal of trauma management & outcomes, 6(1), 1. [DOI] [PMC free article] [PubMed] [Google Scholar]
- Elvik R, & Mysen A (1999). Incomplete accident reporting: meta-analysis of studies made in 13 countries. Transportation Research Record: Journal of the Transportation Research Board(1665), 133–140. [Google Scholar]
- Hipp JR, & Bauer DJ (2006). Local solutions in the estimation of growth mixture models. Psychological methods, 11(1), 36. [DOI] [PubMed] [Google Scholar]
- Johnson O, & Owoaje E (2012). Effect of health education on the riding habits of commercial motorcyclists in Uyo, Southern Nigeria. West African journal of medicine, 31(1), 39–46. [PubMed] [Google Scholar]
- Mathers C (2008). The Global Burden of Disease: 2004 Update. In. Geneva: World Health Organization. [Google Scholar]
- Nylund KL, Asparouhov T, & Muthén BO (2007). Deciding on the number of classes in latent class analysis and growth mixture modeling: A Monte Carlo simulation study. Structural equation modeling, 14(4), 535–569. [Google Scholar]
- Oginni FO, Ugboko VI, & Adewole RA (2007). Knowledge, attitude, and practice of Nigerian commercial motorcyclists in the use of crash helmet and other safety measures. Traffic injury prevention, 8(2), 137–141. [DOI] [PubMed] [Google Scholar]
- Patel A, Krebs E, Andrade L, Rulisa S, Vissoci JR, & Staton CA (2016). The epidemiology of road traffic injury hotspots in Kigali, Rwanda from police data. BMC Public Health, 16(1), 697. doi: 10.1186/s12889-016-3359-4 [DOI] [PMC free article] [PubMed] [Google Scholar]
- Peden M, Scurfield R, Sleet D, Mohan D, Hyder AA, Jarawan E, & Mathers C (2004). World report on road traffic injury prevention: summary. Retrieved from Geneva: [Google Scholar]
- Rwanda, N. I. o. S. o. (2014). Fourth Rwanda Population and Housing Census Thematic Report on Population size, structure and distribution. Retrieved from http://statistics.gov.rw/publication/rphc4-thematic-report-population-size-structure-and-distribution
- Rwanda, N. I. o. S. o. (2016). Labour Force Survey (2016).
- Security, R. M. o. I. (2013). Combating Road Traffic Accidents. Retrieved from http://www.mininter.gov.rw/index.php?
- Staton C (2016). High road utilizers surveys compared to police data for road traffic crash hotspot localization in Rwanda and Sri Lanka. BMC Public Health. [DOI] [PMC free article] [PubMed] [Google Scholar]
- Twagirayezu E, Teteli R, Bonane A, & Rugwizangoga E. (2008). Road Traffic Injuries in Kigali University Central Teaching Hospital, Rwanda. East and Central African Journal of Surgery, 13(1), 73–76. [Google Scholar]
- Vissoci JRN, Shogilev DJ, Krebs E, Andrade L. d., Vieira IF, Toomey N, … Staton CA (2017). Road traffic injury in Sub-Saharan African countries: a systematic review and summary of observational studies. Traffic injury prevention, 18(7), 767–773. doi: 10.1080/15389588.2017.1314470 [DOI] [PMC free article] [PubMed] [Google Scholar]
- WHO. (2006). The health of the people: The African regional health report (9290231033). Retrieved from
- WHO. (2013). Global status report on road safety 2013: supporting a decade of action (9241564563). Retrieved from Geneva: [Google Scholar]
- WHO. (2016). Road Safety in the African Region 2015. Retrieved from Geneva, Switzerland: http://www.afro.who.int/sites/default/files/2017-06/Road_Safety_AFRO_for_web_0.pdf [Google Scholar]
Associated Data
This section collects any data citations, data availability statements, or supplementary materials included in this article.