

SUMMARY
Working memory (WM) relies on the prioritization of relevant information and suppression of irrelevant information [1,2]. Prioritizing relevant information has been linked to theta frequency neural oscillations in lateral prefrontal cortex and suppressing irrelevant information has been linked to alpha oscillations in occipito-parietal cortex [3]. Here, we used a retrospective-cue WM paradigm to manipulate prioritization and suppression task demands designed to drive theta oscillations in prefrontal cortex and alpha oscillations in parietal cortex, respectively. To causally test the role of these neural oscillations, we applied rhythmic transcranial magnetic stimulation (TMS) in either theta or alpha frequency to prefrontal and parietal regions identified using functional MRI. The effect of rhythmic TMS on WM performance was dependent on whether the TMS frequency matched or mismatched the expected underlying task-driven oscillations of the targeted region. Functional MRI in the targeted regions predicted subsequent TMS effects across subjects supporting a model by which theta oscillations are excitatory to neural activity, and alpha oscillations are inhibitory. Together, these results causally establish dissociable roles for prefrontal theta oscillations and parietal alpha oscillations in the control of internally maintained WM representations.
Keywords: Rhythmic TMS, fMRI, theta, alpha, retro-cue, working memory, neural oscillations, prioritization, suppression
Graphical Abstract
eTOC Blurb
Using non-invasive brain stimulation and neuroimaging, Riddle et al. demonstrate a causal role for theta and alpha neural oscillations in the prioritization and suppression of working memory representations. Neuroimaging data supports a model by which theta and alpha oscillations are excitatory and inhibitory to neural activity, respectively.
RESULTS AND DISCUSSION
Managing the limited capacity of working memory (WM) requires control processes that can prioritize goal-relevant information and suppress goal-irrelevant information [1,2]. Prioritization and suppression processes can operate prospectively on perceptual input, with exogenous selective attention serving as an “input gate” that controls what perceptual information is ultimately encoded into WM [4–6], or retrospectively on the internally-maintained contents of WM, effectively serving as an “output gate” that controls what mnemonic information is most likely to guide future behavior [7–10]. For both prospective and retrospective control, substantial evidence has shown that prioritization is associated with theta oscillations that are typically observed over frontal cortex [3,11,12], whereas suppression is associated with alpha oscillations that are typically observed over occipital-parietal cortex [3,13–16]. However, the majority of previous work has used correlational methods such as electroencephalography that have limited spatial resolution and cannot provide insight into the causal function of neural oscillations during WM (but see [13,17,18]). In the current study, we combine functional magnetic resonance imaging (fMRI) and frequency-specific brain stimulation to move beyond previous limitations and provide causal evidence for the roles of prefrontal theta and parietal alpha oscillations in the prioritization and suppression of WM representations.
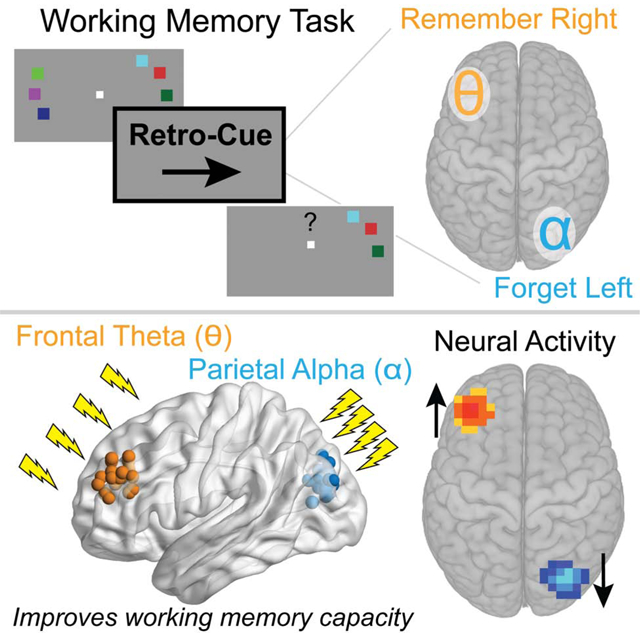
Rhythmic transcranial magnetic stimulation (TMS) has been shown to cause local entrainment of both alpha [19] and theta [20] oscillations and to impact behavioral task performance when the frequency of stimulation is matched to neuronal oscillations evoked by the task demands [21–24]. Here we use a WM paradigm in which a retrospective cue (retro-cue) is designed to drive distinct prioritization and suppression processes operating on the contents of WM. Subjects initially encoded two peripherally presented memory arrays of colored squares in the left and right visual hemifield (Figure 1; see STAR Methods). After an initial delay period, a deterministic retro-cue indicated which memory array would be tested by the probe and should therefore be prioritized in memory, and which array was irrelevant and should therefore be suppressed [3,25]. After a second delay, subjects indicated whether the test probe was the same as the array initially presented in that hemifield. Since retro-cues have been shown to elicit theta oscillations in prefrontal cortex contralateral to prioritized stimuli (Figure 1A) and alpha oscillations in occipito-parietal cortex contralateral to suppressed stimuli (Figure 1B), the entire memory array was presented in one hemifield to segregate the task-relevant theta and alpha oscillations to separate hemispheres. In an initial behavioral session using this paradigm, we confirmed that retro-cues increased WM capacity (t(36) = 2.53, p = 0.016, d = 0.42) and decreased response time (RT; t(36) = −11.70, p = 7.95 × 10⁻¹⁴, d = 1.00) relative to non-informative neutral-cues which indicated that either array could be tested by the probe, consistent with previous findings [25].
Figure 1. Experimental design and hypothesized TMS effects.

(A and B) Subject performed a working memory task with colored squares presented in two peripheral arrays. A retrospective cue (retro-cue; epoch is bolded for emphasis) presented during the delay period indicated whether the upcoming probe would test the memory array initially presented in the left or right visual field. Given that each hemisphere processes contralateral visual information, we predicted that a retro-cue to the right visual field (A) would generate theta oscillations in the left frontal cortex (depicted by a theta symbol), whereas a retro-cue to the left visual field (B) would generate alpha oscillations in the left parietal cortex (depicted by an alpha symbol). Task conditions without task-driven oscillations are described in Figure S1. (C) Rhythmic transcranial magnetic stimulation (TMS) was applied to the left frontal (anterior middle frontal gyrus) and left parietal (inferior intraparietal sulcus) in separate sessions. These regions were localized in fMRI prior to the TMS sessions using the peak activation from all conditions. Each sphere shows an individual’s target TMS site. (D) TMS trains were delivered on every trial in either theta frequency, alpha frequency, or an arrhythmic pattern matched for duration and the number of TMS pulses. This experimental design allowed us to compare WM performance when the frequency of rhythmic TMS was either matched or mismatched with the frequency of the predicted task-driven neural oscillation. The opaque lightning bolts are the pulses for which timing was randomly selected. The final pulse was randomly sampled to be between the alpha and theta duration. The inter-pulse interval was constrained to be greater than 20 milliseconds. The TMS trains were specifically time-locked to the window after retro-cue onset during which a previous magnetoencephalography study reported endogenous theta and alpha oscillations emanating from frontal and parietal regions during a similar retro-cue WM paradigm [3].
We then collected baseline fMRI data while subjects performed the retro-cue WM task. We leveraged the spatial resolution of fMRI to functionally localize subject-specific regions of interest (ROIs) in left prefrontal cortex (middle frontal gyrus; MFG) and left parietal cortex (inferior intraparietal sulcus; IPS) for subsequent TMS targeting (Figure 1C), which are regions recruited during retrospective control of WM [3]. Next, we applied theta and alpha frequency rhythmic TMS during performance of the task in separate sessions for the MFG and IPS target sites, counterbalanced for order. TMS was delivered immediately following the retro-cue on each trial, based on previous work showing task-driven theta and alpha oscillations in these regions during this time window [3] (Figure 1D). Arrhythmic TMS was used as a control for any non-frequency specific effects of stimulation to the targeted region. TMS was delivered every trial at a randomized and intermixed frequency (theta-TMS, alpha-TMS, or arrhythmic-TMS).
This experimental design allowed us to compare WM performance when the frequency of rhythmic TMS was either matched or mismatched with the frequency of the predicted task-driven neural oscillation. Thus, the “matched” condition included trials where theta-TMS was applied to MFG when a retro-cue indicated that the contralateral WM representation was task-relevant (Figure 1A) and trials where alpha-TMS was applied to IPS when a retro-cue rendered the contralateral WM representation irrelevant (Figure 1B). In contrast, the “mismatched” condition included trials where the alternative frequency of TMS was applied: alpha-TMS to MFG and theta-TMS to IPS when the contralateral representation was irrelevant or relevant, respectively. Because theta and alpha oscillations are theorized to play opposite roles in either prioritizing or suppressing representations [13,26,27], we predicted that the beneficial (or detrimental) impact of rhythmic TMS on performance would depend on whether the TMS frequency was matched (or mismatched) to the task-relevant oscillations of the targeted region [21,28]. To test for this interaction, we analyzed data from the TMS sessions using a two-way repeated-measures analysis of variance (ANOVA) with factors TMS site (prefrontal or parietal) and TMS frequency (theta or alpha) separately for WM capacity and RT. To control for non-TMS frequency specific effects, we calculated difference scores for each condition relative to arrhythmic-TMS trials that were condition-matched (for TMS site and retro-cue type) and submitted these difference scores to the analyses. The duration of the arrhythmic-TMS train uniformly varied between 300 and 600 milliseconds, such that a single arrhythmic-TMS condition served as a common control for both theta-TMS and alpha-TMS for a given TMS site (Figure S1).
The effect of rhythmic TMS on WM capacity is shown in Figure 2A. Consistent with our predictions, we found a significant interaction between TMS site and TMS frequency such that WM capacity was greater for matched TMS relative to mismatched TMS (F(1,19) = 5.66, p = 0.028, η2p = 0.23). This interaction effect is formally identical to a test comparing the difference in capacity for matched TMS versus mismatched TMS and is summarized in Figure 2B (t(19) = 2.379, p = 0.028, d = .532). Capacity scores did not significantly differ as a function of stimulation site or stimulation frequency (main effect of site: (F(1,19) = 0.14, p = 0.72, η2p = .01; main effect of frequency: F(1,19) = 0.19, p = 0.67, η2p = .01). The raw data and code to generate the plots in Figure 2, as well as versions that depict individual subject traces, are publicly available on the Open Science Framework (https://osf.io/ufz56/).
Figure 2. Effect of rhythmic TMS on WM performance.
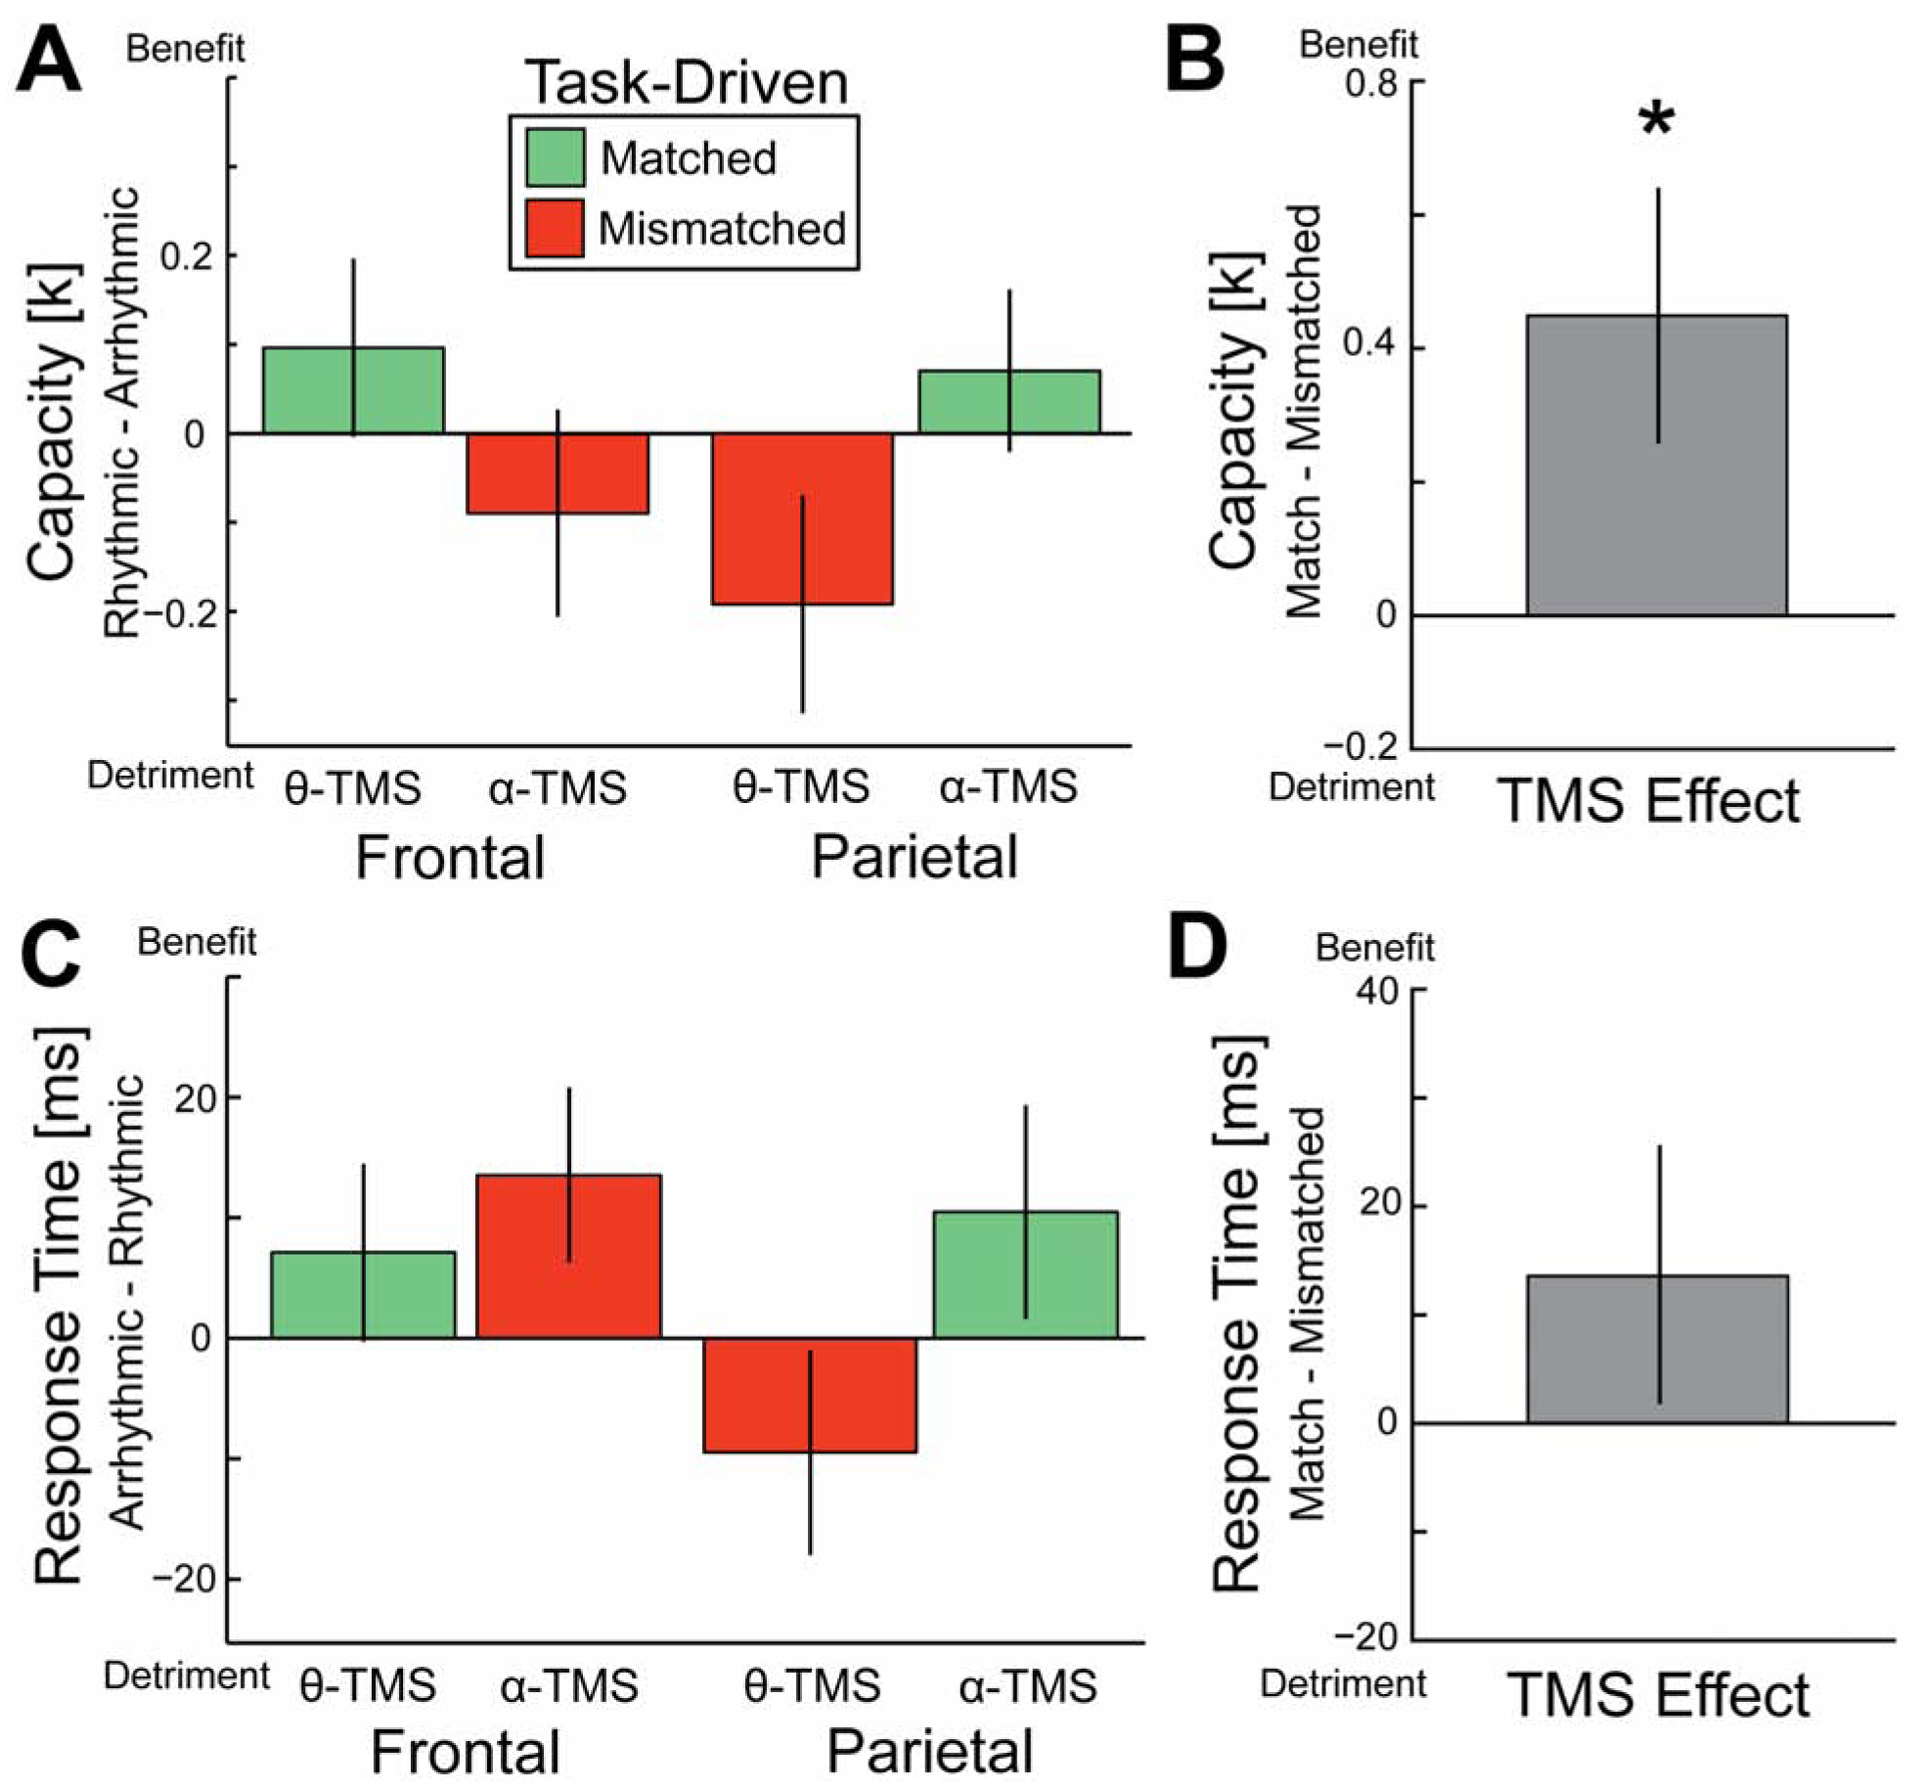
A retro-cue to the right visual field was expected to drive theta oscillations in left frontal cortex; and a retro-cue to the left visual field was expected to drive alpha oscillations in left parietal cortex. We predicted that the behavioral effect of rhythmic-TMS would depend on whether the TMS frequency was matched (green) or mismatched (red) to the task-driven oscillations. To control for the general effects of TMS, we calculated difference scores relative to arrhythmic-TMS and performed a two-way repeated-measures ANOVA for TMS site and TMS frequency on the capacity (A, B) and response time (C, D) difference scores. There was a significant site by frequency interaction for capacity (A, p = 0.028) such that performance was better for matched versus mismatched TMS (B). There was no site by frequency interaction for response time (C, p = 0.264) and thus no significant difference between matched versus mismatched TMS (D). Error bars are the within-subject standard error of the mean. * p < 0.05. Behavioral analysis for conditions without task-driven oscillations is described in Figure S1.
For RT, there was no interaction between TMS site and TMS frequency (Figure 2C; F(1,19) = 1.32, p = 0.27, η2p = .07) and thus no significant difference in RT between matched and mismatched TMS, although RT was numerically better for matched TMS (Figure 2D; t(19) = 1.150, p = 0.264, d = .257). Combined with the effect on capacity, this suggests that rhythmic TMS did not result in a speed-accuracy tradeoff in performance. Additionally, RT scores did not significantly differ as a function of stimulation site or stimulation frequency (main effect of site: (F(1,19) = 0.59, p = 0.45, η2p = .03; main effect of frequency: (F(1,19) = 2.87, p = 0.11, η2p = .13).
For the conditions in which the retro-cue was not expected to systematically drive theta or alpha oscillations in the region targeted by TMS (retro-cue left with TMS to left MFG and retro-cue right with TMS to left IPS), we did not have an a priori hypothesis about the systematic effect of rhythmic TMS on performance. Given minimal prior work using this TMS method, the expected impact of rhythmic TMS applied to regions without reliable task-driven neural oscillations is uncertain: the efficacy of rhythmic TMS may depend (at least in part) on entraining a frequency that is already endogenously present and therefore have a negligible effect in the absence of task-driven neural oscillations. Alternatively, it may induce substantive oscillatory activity de novo that is task-unrelated and therefore interferes with task performance, it may facilitate task-driven oscillations in the corresponding contralateral cortex via interhemispheric connections and therefore enhance performance, or it may have a combination of these effects. As an exploratory control analysis, we performed the same analysis for conditions in which theta and alpha oscillations were not task-driven (Figure S1A,B; see STAR Methods for details) and found no significant effects in these conditions (Figure S1C,D; see Figure S1E,F for all conditions).
Next, to test whether the TMS match/mismatch interaction effect was greater for conditions with versus without task-driven oscillations in the region targeted by TMS, we submitted the capacity scores for all conditions to a three-way ANOVA with factors of TMS site, TMS frequency, and task-driven neural oscillations (present or absent). Although the match/mismatch TMS effect was numerically greater when task-driven neural oscillations were present in the targeted region, the three-way interaction test that corresponds to this effect was not statistically significant (F(1,19) = 0.605, p = 0.446, η2p = .031). As a final control analysis, we tested for a more task-general TMS interaction effect by submitting the capacity scores for all conditions, collapsed across whether task-driven neural oscillations were present or absent, to a two-way ANOVA with factors of TMS site and TMS frequency. There was a significant interaction such that WM capacity was greater when the TMS frequency was consistent with the generally preferred frequency of the targeted region (frontal theta and parietal alpha versus frontal alpha and parietal theta; F(1,19) = 8.64, p = 0.00842, η2p = .31). This control analysis also provides evidence for dissociable contributions of prefrontal theta and parietal alpha oscillations to WM performance, but begets a potential alternative account of the rhythmic TMS effects: theta-TMS to prefrontal cortex and alpha-TMS to parietal cortex may enhance WM performance in a more task-general manner, regardless of whether there are task-driven neural oscillations in the targeted region, perhaps by influencing remote regions via interhemispheric connections.
Because WM capacity and retro-cue benefits can vary substantially across individuals, we hypothesized that MFG and IPS activity (assessed during the baseline fMRI session) may index the degree to which subjects engage task-driven prioritization and suppression processes during retro-cue trials [29,30] and thus predict the behavioral impact of matched versus mismatched TMS. We predicted opposite effects of prioritization and suppression on neural activity such that there would be a positive correlation for prioritization processes subserved by MFG and a negative correlation for suppression processes subserved by IPS. Specifically, subjects who reliably engaged prioritization processes that depend on prefrontal theta oscillations should exhibit increased MFG activity on retro-cue relative to neutral-cue trials, as well as exhibit the greatest benefit from matched (theta) versus mismatched (alpha) TMS to MFG. In contrast, subjects who reliably engaged suppression processes that depend on parietal alpha oscillations should exhibit decreased IPS activity on retro-cue trials relative to neutral-cue trials, because the retro-cue indicates that the four items presented in the contralateral hemifield are no longer task-relevant and therefore reduces the effective memory load for that hemifield from four items to zero items. Neural activity in parietal cortex tracks the amount of information maintained in memory [29–34], and successfully engaging suppression processes should result in less (now irrelevant) information maintained in memory and a corresponding decrease in IPS activity. This predicted relationship between alpha oscillations and fMRI activity is further bolstered by simultaneous EEG-fMRI studies that have found negative correlations between fMRI activity and alpha oscillations at rest [35–37].
Across subjects, left MFG activity was positively and significantly correlated with the MFG TMS effect (r(18) = 0.55, p = 0.014; Figure 3A) and left IPS activity was negatively correlated with the IPS TMS effect, although not statistically significant (r(18) = −0.35, p = 0.139; Figure 3B). Critically, the hypothesized difference between the MFG and IPS brain-behavior correlations was significant (z(18) = 3.61, p = 0.0003). As a control analysis, we performed the same analysis for conditions in which theta and alpha oscillations were not expected to be systematically driven by task demands and found no significant effects (Figure S2). Finally, we found that the hypothesized pattern of brain-behavior correlations was greater for conditions with versus without task-driven oscillations in the targeted regions (z(18) = 2.56, p = 0.010). This dissociation suggests that rhythmic TMS does not exert its effects in a task-general manner, independent of whether there are task-driven oscillations in the targeted region, but instead depends on the presence of endogenous theta and alpha oscillations associated with prioritization and suppression demands.
Figure 3. Brain Behavior Correlation Analysis.
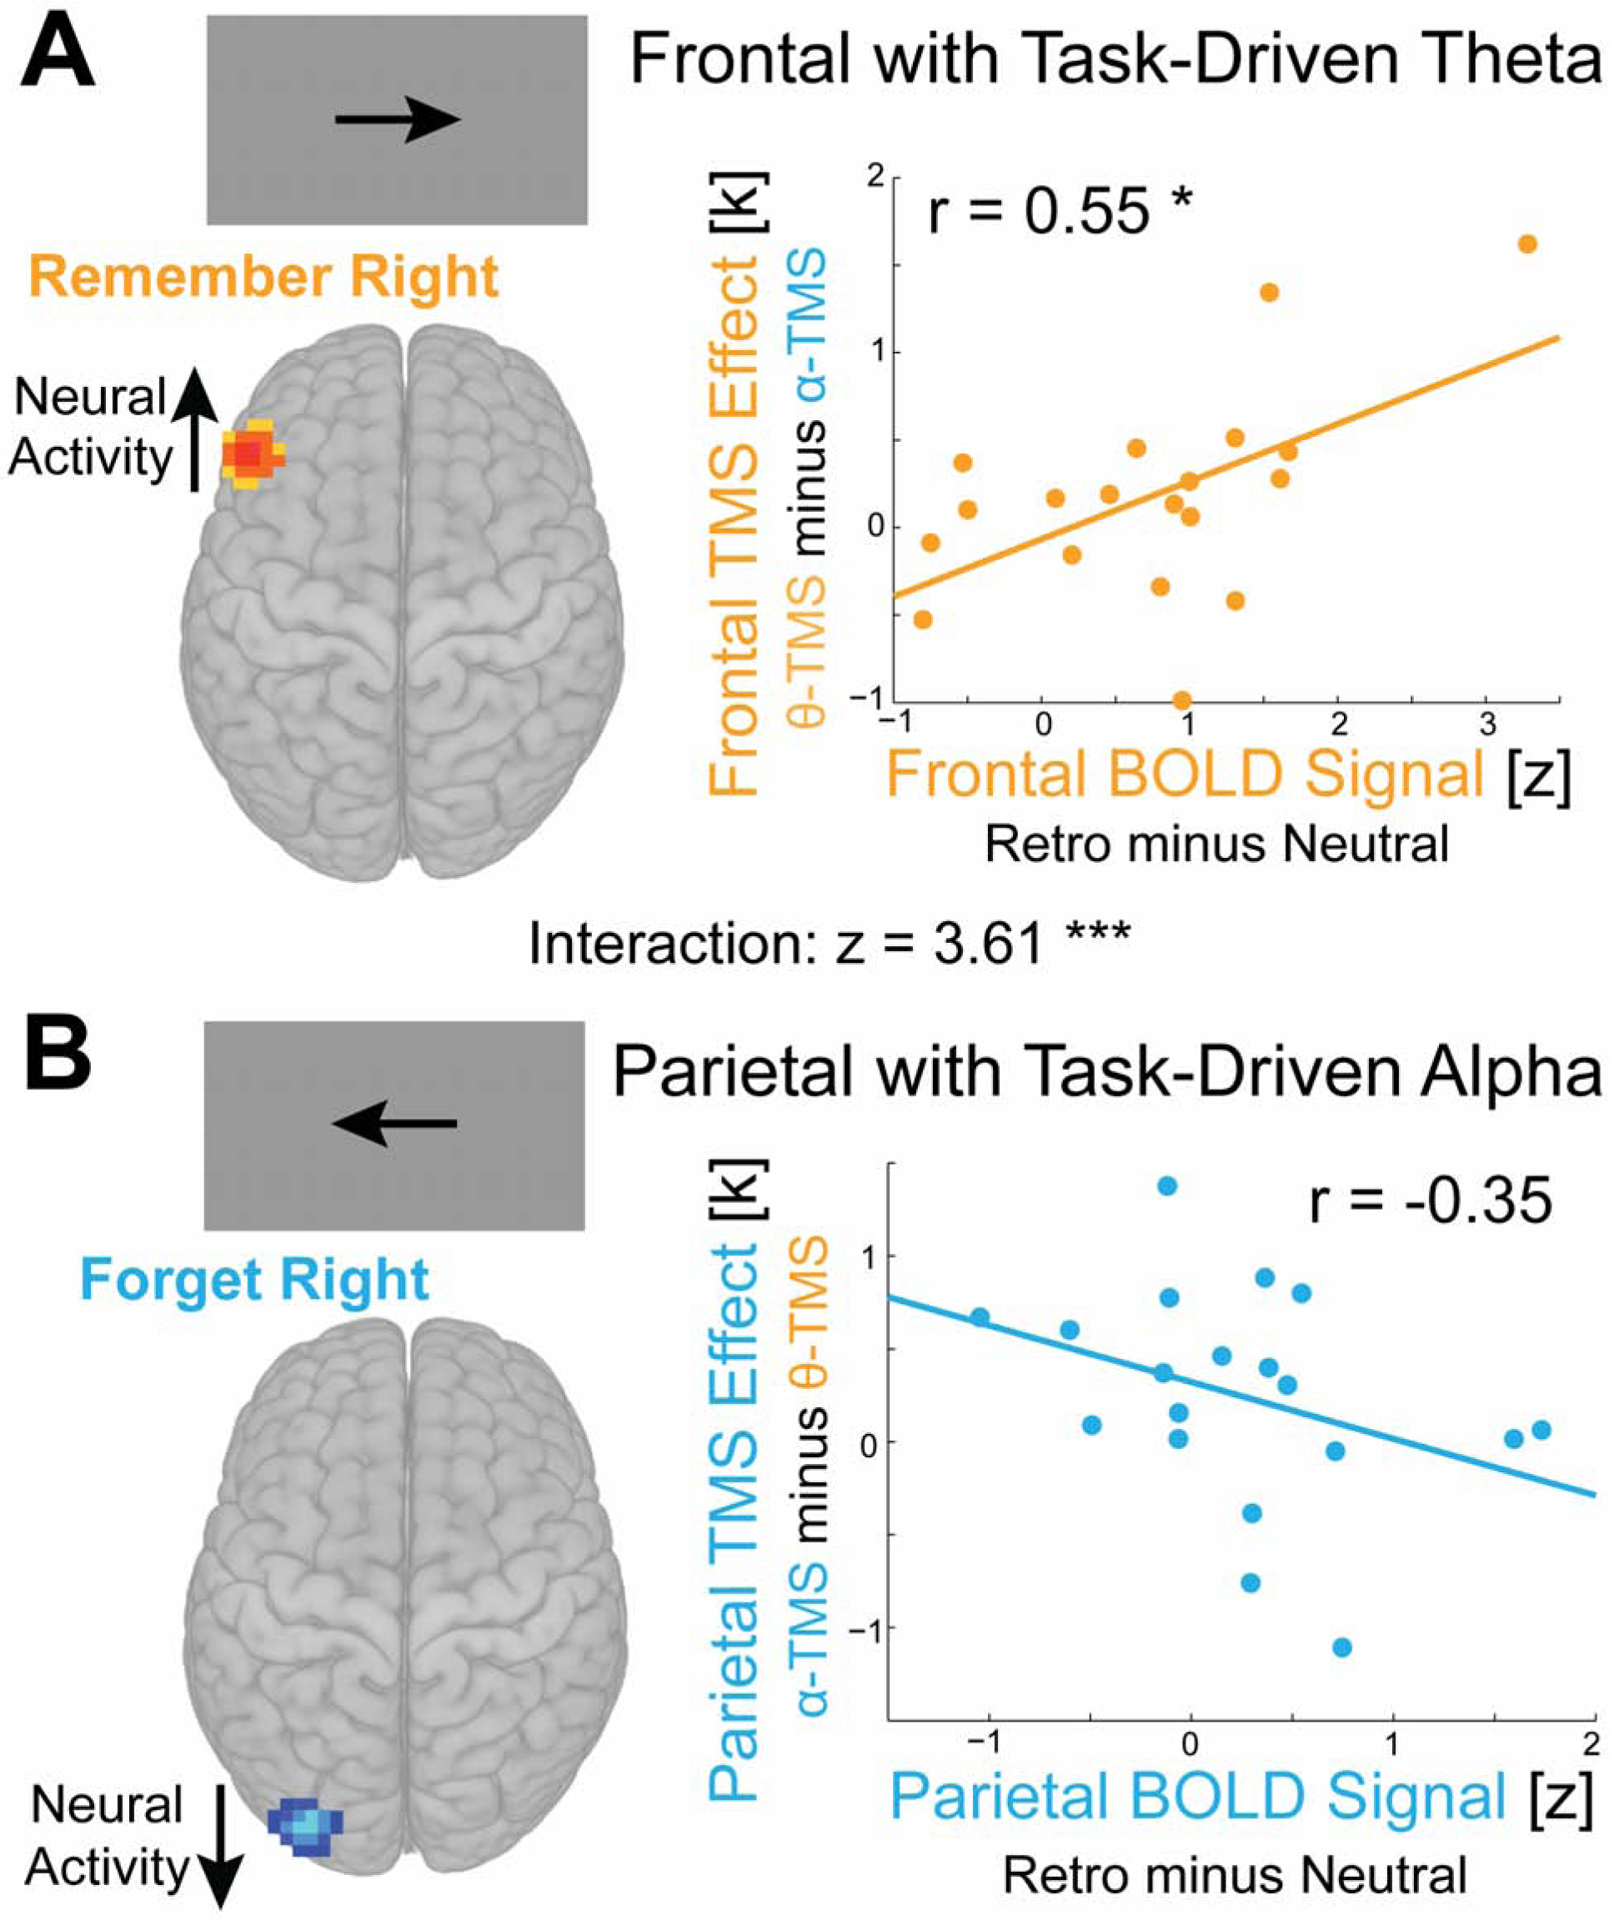
Functional MRI blood-oxygenation-level dependent (BOLD) signal in frontal and parietal cortex correlated with the behavioral effect of matched TMS for each region. The hypothesized model of task-driven neural oscillations predicts brain-behavior correlations of opposite direction across the two regions: positive for frontal cortex and negative for parietal cortex. (A) Subjects who reliably engage theta-dependent prioritization processes should demonstrate increased neural activity (greater BOLD signal; assessed in the fMRI localizer session) in the left frontal cortex on retro-cue trials that prioritize the contralateral hemifield, relative to neutral-cue trials. The model predicts that subjects with higher frontal BOLD signal should therefore demonstrate the greatest relative benefit from matched (theta) versus mismatched (alpha) TMS applied to frontal cortex. We found that frontal BOLD signal was positively correlated with the TMS effect on capacity for frontal stimulation (p = 0.014). (B) Subjects who reliably engage alpha-dependent suppression processes should demonstrate decreased BOLD signal (due to the reduced memory load from four to zero items encoded from the contralateral visual field and previous reports of a negative correlation of the BOLD signal and alpha oscillations) in the left parietal cortex on retro-cue trials that prioritize the ipsilateral hemifield, relative to neutral-cue trials. The model predicts that subjects with lower parietal BOLD should therefore demonstrate the greatest relative benefit from matched (alpha) versus mismatched (theta) TMS applied to parietal cortex. We found that parietal BOLD signal was negatively correlated with the TMS effect on capacity for parietal stimulation, although this relationship did not reach statistical significance (p = 0.139). Critically, however, the predicted difference between brain-behavior correlations for frontal and parietal cortex was significant (p = 0.0003). * p < 0.05, *** p < 0.001. Brain to behavior analysis for conditions without task-driven oscillations is described in Figure S2.
The retro-cue task used here allowed us to isolate output-gating control processes that operate on internally-maintained WM representations [3,38] and establish a causal role for frontal theta and parietal alpha oscillations. Together, the TMS effects on behavior and the brain-behavior correlations support the proposed model in which prefrontal theta oscillations support task-related prioritization demands and parietal alpha oscillations support task-related suppression demands. Theta oscillations are observed in the prefrontal cortex during a variety of tasks that require top-down control signals [39–44], including tasks that require controlling the priority of WM representations [3,11]. When there is a change in the task-relevance of WM representations, theta oscillations may serve to output-gate a control policy that is maintained in prefrontal cortex and provides top-down signals that subsequently modulate activity in posterior regions such as parietal cortex [9], linking recent gating models and the sensory recruitment model of WM [2,7–9,45]. Alpha oscillations in parietal cortex have been previously shown to play a causal role in input-gating by suppressing task-irrelevant exogenous information from being encoded into WM [13]. Our findings suggest that alpha oscillations also serve to suppress endogenous WM representations for information that has already been encoded into memory but is no longer relevant to guide future behavior. This view is compatible with the hypothesis that internal attention acts via the same mechanisms employed in external attention [1].
Additionally, our frequency-specific TMS effects provide causal evidence that the match (or mismatch) between ongoing task-relevant neural oscillations and the frequency of stimulation is critical to the behavioral impact of TMS. These results are consistent with prior observations that theta and alpha oscillations are often anti-correlated [41,42,46] and that functional connectivity between brain regions displays increased alpha coherence with suppressed neural activity and increased theta coherence with active processing [47]. Optimal brain function requires a careful balance between excitation and inhibition of activity in neurons and networks [48]. Our findings of antagonistic oscillatory states of theta and alpha oscillations that are necessary for prioritizing (or suppressing) information necessary to guide successful behavior may represent a mechanism by which an optimal excitatory-inhibitory balance is achieved at the network level.
STAR ★ METHODS
LEAD CONTACT AND MATERIALS AVAILABILITY
Further information and requests for resources should be directed toward and will be fulfilled by the Lead Contact, Justin Riddle (riddler@berkeley.edu). This study did not generate new unique reagents.
EXPERIMENTAL MODEL AND SUBJECT DETAILS
Subjects
We obtained informed consent from thirty-seven research subjects according to the guidelines of the Committee for the Protection of Human Subjects and University of California, Berkeley. Potential subjects were screened for contraindications from TMS or fMRI: implanted devices or metal in body, claustrophobia, tinnitus or hearing problems, color blindness, personal or family history of epilepsy or convulsion, personal history of fainting, drug or alcohol use in the past 24 hours, pregnancy (urine test for all females), history of head trauma, neurological disorder, chronic or transient sleep disturbance, chronic stress, high blood pressure, medication for any psychological condition in the past three months. Eight of the 37 subjects were excluded from the fMRI and TMS sessions because they did not show a beneficial effect of the retro-cues in a behavioral screening session. An additional nine subjects dropped out of the study due to an inability to make the time commitment required to complete all sessions. Twenty subjects (seven males, ages mean 21.3 years and standard deviation 3.1 years) completed all four sessions of the experiment and were included in the final analyses.
METHOD DETAILS
General Procedure and Behavioral Task
The overall experimental design included four sessions: an initial behavior-only session to screen subjects for their ability to perform the task, an fMRI scanning session to localize regions of interest to be targeted by subsequent TMS sessions, and two TMS sessions with online stimulation of left MFG and IPS, counterbalanced for order across subjects. Each session was completed on a separate day.
In the initial behavioral screening, subjects completed a change detection WM task with retro-cues (Figure 1A). On each trial, two arrays of colored squares were presented around a central fixation cross for 500 milliseconds. The two memory arrays were always on opposite sides of the visual field and each item was equidistant from fixation. The left and right arrays included an equal number of stimuli (two, three, or four items per array) on each trial. Following a delay period of 1000 milliseconds, a retro-cue (50% of trials) or a neutral cue (50% of trials) was presented at fixation for 100 milliseconds. Retro-cues took the form of an arrow pointing towards either the left or right visual field. Subjects were instructed to “remember” the array from the cued visual field and to “forget” the array from the other visual field; the retrospective cue was 100% predictive of the array that would be tested at probe. Neutral cues took the form of a double-sided arrow that provided no predictive information about the upcoming memory probe; subjects were instructed to continue remembering both arrays. After a second delay period of 1000 milliseconds, subjects were probed with a test array on either the left or right side of fixation, in the exact same location as the original encoding display. Subjects indicated whether the entire test array matched the memory array or whether at least one color had changed. On non-match trials the test array could include a novel color not in either memory array, a color from the memory array not tested, or two colors in the array could have swapped. Subjects had 2000 milliseconds to indicate their response by making a button press with the index finger (match) or the middle finger (non-match) of their right hand. The conditions for size of memory array and retro versus neutral cue were intermixed, randomized, and balanced.
We used a fixed stimulus set of nine colors. The colored squares could appear at 12 different locations equally spaced around fixation. On each trial, the two memory arrays were randomly placed contiguously in each visual hemifield, six possible locations each. The memory arrays were never contiguous to each other within the encoding display and therefore always had at least one empty location between them. For the screening session, subjects performed on average 90.32 +/− 30.36 trials per condition with a minimum of 36 trials per condition.
As an initial assessment of performance, we compared performance between retro and neutral cues for response time and accuracy. At the group level, subjects demonstrated a behavioral improvement from the retro-cue relative to the neutral cue: increased WM capacity (t(36) = 2.53, p = 0.016, d = 0.42) and decreased response time (t(36) = −11.70, p = 7.95 × 10⁻¹⁴, d = 1.00). Next, individual subjects were screened for their ability to utilize the retro-cue by comparing their performance to the non-informative neutral cue. We performed this screening process so that subjects included in the TMS sessions would be more likely to show a retro-cue benefit and be generating the endogenous neural oscillatory signatures targeted by rhythmic TMS. Out of the 37 subjects screened, eight displayed suboptimal behavioral performance such that retro-cue performance was worse than or equal to that of the neutral cue and thus did not participate in the fMRI and TMS sessions of the study.
For the TMS sessions, the behavioral task was restricted to a single set size that that was determined on a subject-specific basis based on their performance in the initial session. This procedure was designed to maximize the effect of TMS on behavior by avoiding floor and ceiling effects on performance. Subjects who did not show a retro-cue benefit for a set size of four, but demonstrated a retro-cue benefit for a set size of three were given encoding displays of size three for all subsequent sessions, because the experiment was designed to study the cognitive processing of retro-cues. All other subjects were assigned to a set size of four. Of the 20 subjects that completed all session and were included in analyses, eight were assigned to a set size of three.
FMRI and Region of Interest Localization
After the behavioral screening session, subjects underwent an MRI session in order to acquire a high-resolution anatomical scan for 3D stereotaxic navigation and to functionally localize the left middle frontal gyrus (MFG) and left inferior intraparietal sulcus (IPS) for targeting during subsequent TMS sessions. Subjects performed the same task as the behavioral screening session except with a fixed set size based on their screening session, and completed three to six runs depending on time constraints of the fMRI procedure. Each run consisted of 40 trials. Overall, each subject had at least 30 trials, mean 47.89, in each of 4 conditions: probe on the left or right visual field and cue type (retro or neutral).
MRI data was collected in the Henry H. Wheeler Brain Imaging Center at the University of California, Berkeley on a Siemens 3T MAGNETOM Trio (Erlangen, Germany) using a 32-channel receive-only coil. We collected a high-resolution structural scan for targeting of TMS and multiple functional MRI scans for localizing the subject-specific task-activated left MFG and IPS. The anatomical scan was collected using a T1-weighted magnetization-prepared rapid gradient-echo (MPRAGE) sequence with 160 sagittal slices with 1 mm isotropic voxels, 2.3 second repetition time, interleaved slice acquisition, phase-encoding direction from anterior to posterior, 2.98 millisecond echo time, 9-degree flip angle, and parallel imaging via GeneRalized Autocalibrating Partial Parallel Acquisition (GRAPPA) with an acceleration factor of 2. The functional echo planar imaging scans were collected during performance of the WM task using a T2*-weighted single-shot echo-planar imaging (EPI) sequence with 2.5 mm isotropic voxels, 2.5 second repetition time, descending slice acquisition, phase encoding direction anterior to posterior, 29 millisecond echo time, 60-degree flip angle, fat saturation, and prescan normalization. The first two volumes of every functional run were discarded upon acquisition; and for analysis purposes, the first two recorded volumes were also discarded.
Preprocessing of fMRI data was performed using the Statistical Parametric Mapping 12 toolbox (SPM12, www.fil.ion.ucl.ac.uk/spm) in MATLAB (version 2014a release). All preprocessing steps were performed in SPM12 unless otherwise noted. The anatomical image had the neck removed (AFNI, afni.nimh.nih.gov), manual reorientation to the anterior commissure, segmentation with mean bias correction, and normalization into the Montreal Neurological Institute (MNI) space. The functional data were de-spiked at three standard deviations above the mean (AFNI, afni.nimh.nih.gov), slice time corrected, rigid body motion aligned to the mean functional image, manually reoriented to the anterior commissure, normalized into MNI space, and smoothed with a FWHM kernel of 4 millimeters.
A univariate analysis of the fMRI data was performed in MNI space with a general linear model (GLM) analysis that included a regressor for each behavioral condition (retro-cue probe left, neutral-cue probe left, retro-cue probe right, and neutral-cue probe right) and a regressor for missed trials. Each trial was modeled as a boxcar with onset at the presentation of the encoding display and duration until the subject made a response (mean response time relative to the onset of the test probe was 967.3 milliseconds with a standard deviation of 125.9 milliseconds). If no response was made, then the boxcar duration included the full two second response window. The above regressors were convolved with the canonical hemodynamic response function. We also included 8 nuisance regressors: 6 rigid body motion realignment parameters and the mean signal in white matter and cerebral spinal fluid. The masks for white matter and cerebral spinal fluid were calculated by SPM12’s segmentation of the anatomical image.
Coordinates used for TMS targeting were defined individually for each subject based on a combination of task activity and coordinates reported by a meta-analysis of retro-cue studies that identified clusters in MFG (−40, 39, 23) and IPS (−34, −76, 26) [3]. The meta-analysis collapsed across the left and right hemispheres. TMS targeting coordinates were defined individually for each subject as the peak univariate BOLD activation in the contrast map for a contrast of all task conditions versus baseline that was nearest to the meta-analysis coordinates and constrained anatomically to the middle frontal gyrus and inferior intraparietal sulcus. A starting threshold of p < 0.001 was initially selected and then lowered until a supra-threshold cluster was found for each subject. The mean coordinates across subjects for left MFG in MNI space was (−33.70, 42.70, 27.70) with a standard deviation of (6.10, 6.03, 6.63) and for left IPS was (−30.60, −78.80, 23.80) with a standard deviation of (3.90, 4.18, 6.19; Figure 1C). After the subject-specific coordinates were defined in MNI space, we created an eight-millimeter sphere surrounding this point and these regions of interest were back-normalized into native space for online TMS targeting.
Non-Invasive Brain Stimulation
For the third and fourth sessions of the experiment, online rhythmic TMS was delivered to either left MFG or IPS on separate days, counterbalanced for order, using a MagStim Super Rapid-2 Plus1 stimulator with a MagStim figure-eight 70mm double air film coil (MagStim, Whitland, United Kingdom). Each subject’s motor threshold (MT) was calculated to calibrate the coil intensity to their specific sensitivity level. To calculate MT, an electrode was attached to the first dorsal interosseous muscle on the right hand of the subject. Single pulses of TMS were delivered to the corresponding hand region of the left motor cortex at a 45-degree angle until the TMS pulses reliably elicited a motor evoked potential (MEP), defined as a near instantaneous voltage increase of at least 70 microvolts above baseline (O’Shea et al., 2007). Once a MEP was generated, the intensity was decreased to a level that elicited an MEP on 5 out of 10 TMS pulses.
A custom-built cable triggered trains of 4 biphasic pulses at 110% of MT in either 5 Hertz (theta frequency), 10 Hertz (alpha frequency), or arrhythmic. During online TMS, subjects were actively monitored for signs of duress and were encouraged to inform the experimenter of any discomfort. To ensure the accuracy of TMS targeting, we used Rogue Research’s BrainSight v2.2.11 (Rogue Research, Montreal, Canada) with a Northern Digital Polaris Spectra infrared camera (Waterloo, Ontario, Canada) to register anatomical landmarks on the subject’s head to their anatomical MRI scan with stereotaxic 3-dimensional tracking. Subject-specific coordinates derived from that individual subject’s fMRI data were overlaid on the subject’s anatomical image. A trajectory for TMS was calculated perpendicular to the skull. The coil angle was held constant in the posterior to anterior direction for both TMS sites. Modeling of the electric currents induced by TMS in spherical models predicts the maximal electric field along the angle of the coil. These models can be further specified by finite element models that indicate that the greatest induced electric field is in the gyral crown perpendicular to the coil angle [49]. We chose the TMS coil angle to be oriented along the middle frontal gyrus and intraparietal sulcus, and electric field strength was expected to vary within this target based on the particular gyral geometry of the subject. During the TMS sessions, experimenters actively maintained a stable position of the TMS coil aided by a MagStim coil holder and continuous real-time stereotaxic tracking. After the delivery of each TMS train, a TTL pulse was generated that recorded the position of the coil relative to the target trajectory. Trials were rejected from analysis in which the TMS coil position deviated greater than 5 millimeters from the target trajectory (mean 1.66% with standard deviation 2.19% of trials were removed). For technical reasons, one session of one subject did not have usable stereotaxic tracking data and all trials for this session were included in the analysis.
A previous experiment found behaviorally relevant alpha oscillations from 300 to 800 milliseconds and theta oscillations from 100 to 600 milliseconds after the onset of the retro-cue [3]. Based on the timing of these oscillations, we delivered a train of TMS 100 milliseconds after the onset of the retro-cue to maximally overlap with both of these relevant time windows (Figure 1D). Each biphasic TMS pulse was a brief event lasting only about one fourth of a millisecond. Thus, an alpha frequency train consisted of four pulses of TMS with an inter-pulse interval of 100 milliseconds (10 Hertz) and total duration of 300 milliseconds, and theta frequency TMS consisted of four pulses of TMS with an inter-pulse interval of 200 milliseconds (5 Hertz). Arrhythmic-TMS was used as a control stimulation to account for any non-frequency specific physiological effects of receiving TMS pulses in the same window of time. The total duration of arrhythmic TMS varied uniformly between that of alpha and theta frequency TMS (300 to 600 milliseconds). Arrhythmic-TMS trains were constrained such that each pulse was separated by at least 20 milliseconds. Each arrhythmic train was generated randomly and checked for its proximity to either alpha or theta frequency pulse patterns. A generated pulse pattern was discarded if all three intervals had values in the range of 80–120 milliseconds or if all three intervals had values in the range of 180–220 milliseconds, and a new pattern was randomly generated. In order to control for non-frequency specific effects of online TMS within each subject, we computed differences scores for each condition by contrasting alpha/theta-TMS versus arrhythmic-TMS, e.g. retro-cue probe right trials that received alpha-TMS to MFG minus retro-cue probe right trials that received arrhythmic-TMS to MFG. These differences scores were used for all statistical analyses. This procedure also controls for differences in set size across subjects.
To maximize statistical power, the TMS sessions had a fixed set size and only retro-cues. Subjects completed two TMS sessions: one session for each TMS site randomized and counterbalanced for order. Each TMS session contained eight blocks of 48 trials each with six conditions (theta TMS probe-right, alpha-TMS probe-right, arrhythmic-TMS probe-right, theta-TMS probe-left, alpha TMS probe-left, and arrhythmic-TMS probe-left). Overall, each subject completed 384 trials in each TMS session (768 trials across both TMS sessions) for a total of 64 trials in every experimental condition.
QUANTIFICATION AND STATISTICAL ANALYSIS
Primary Data Analysis
To control for differences in set size and given that we used the full memory array for our probe, we calculated performance using Pashler’s metric for capacity [50]. Pashler’s capacity is calculated as the memory load multiplied by the hit rate (correct responses during match trials) multiplied by the false alarm rate (incorrect responses during non-match trials) divided by one minus the false alarm rate.
Our primary analysis was to test for frequency specific effects of TMS for conditions in which we expected theta and alpha oscillation to be driven by the retro-cue. For left MFG TMS, we used conditions with a retro-cue probe right (contralateral). In this condition, information presented in the contralateral visual field must be prioritized. For left IPS TMS, we used conditions with a retro-cue probe left (ipsilateral). In this condition, information presented in the contralateral visual field must be suppressed. We performed a two by two (TMS site by TMS frequency) repeated-measures analysis of variance (ANOVA) for capacity and response time. Our experimental design was optimized such that a single test could be used to assess the impact of TMS on behavior. We hypothesized an interaction between TMS site and TMS frequency such that TMS frequency matched to the TMS site (theta for MFG, and alpha for IPS) would increase performance relative to when the TMS frequency was mismatched to the TMS site (alpha for MFG, and theta for IPS).
As an exploratory control analysis, we tested for a TMS site by TMS frequency interaction for the task condition without task-driven theta and alpha oscillation in the targeted regions. For left MFG TMS with retro-cue probe left, stimulation was ipsilateral to the prioritized visual field and there was no task-driven activity in this region (Figure S1A). For left IPS TMS with retro-cue probe right, stimulation was ipsilateral to the suppressed visual field and there was no task-driven activity in this region (Figure S1B). While arrhythmic-TMS controlled for non-specific effects of TMS, the conditions in which theta and alpha oscillations are not driven by the retro-cue in the targeted region serve as a control for our cognitive manipulation.
Brain-Behavior Correlation Analyses
To assess ROI activity for each condition, we first defined MFG and IPS ROIs for each subject by creating a sphere of radius eight mm centered around the TMS target coordinates for each subject. We then took the mean of the parameter estimates (beta value) across the ROI for each condition in the GLM. These mean values were then used to create two contrasts for correlation analyses. For the MFG ROI, we contrasted the retro-cue probe right condition minus the neutral-cue probe right condition. For the IPS ROI, we contrasted the retro-cue probe left condition minus the neutral-cue probe left condition. Each of these contrasts differs on the feature of interest (retro-cue) but controls for visual stimulation and the hemifield of the test probe. One subject had activity more than three standard deviations below the mean for the MFG ROI contrast and was thus omitted from both brain-behavior correlations. These measures of brain activity were then correlated with specific TMS effects: activity in the MFG ROI was correlated with the behavioral effects of theta-TMS to MFG for retro-cue probe right minus alpha-TMS to MFG for retro-cue probe right. Activity in the IPS ROI was correlated with alpha-TMS to IPS for retro-cue probe left minus theta frequency TMS to IPS for retro-cue probe left. The ROIs were defined based on an independent contrast of all task conditions versus baseline. Thus, differences in the signal to noise ratio within the regions of interest could not explain the hypothesized inverse relationships.
As a control for the brain behavior analysis, we correlated brain activity in the MFG ROI for retro-cue probe left minus neutral-cue probe left to the behavioral effects of theta-TMS to MFG with retro-cue probe left minus alpha-TMS to MFG with retro-cue probe left. For IPS, we correlated BOLD signal in the IPS ROI for retro-cue probe right minus neutral-cues probe right to the behavioral effects of alpha-TMS to IPS with retro-cue probe right minus alpha-TMS to IPS with retro-cue probe right. These are the same control conditions used in the behavioral analysis that account for non-specific effects unrelated to our cognitive manipulation.
DATA AND CODE AVAILABILITY
All analyses were run using custom code in MATLAB, the Statistical Parametric Mapping 12 (SPM12) toolbox, Analysis of Functional Neuroimaging toolbox (AFNI). Code and processed data used for the final analyses are available at https://osf.io/ufz56/. The raw data for this study are available upon request to the Lead Contact. The authors declare that all requests within reason will be fulfilled.
Supplementary Material
HIGHLIGHTS
Impact of rhythmic TMS on working memory capacity was frequency and site dependent
Frontal theta oscillations play a causal role in prioritizing WM representations
Parietal alpha oscillations play a causal role in suppressing WM representations
Individual differences in task-evoked BOLD signal predicts behavioral impact of TMS
ACKNOWLEDGEMENTS
We would like to thank Anastasia Kiyonaga for key discussion early in the development of this project. This work was supported by National Institutes of Health grants R01 MH111737 and R01 MH063901 awarded to M.D. and National Science Foundation grant DGE 1106400 awarded to J.R.
Footnotes
Publisher's Disclaimer: This is a PDF file of an unedited manuscript that has been accepted for publication. As a service to our customers we are providing this early version of the manuscript. The manuscript will undergo copyediting, typesetting, and review of the resulting proof before it is published in its final form. Please note that during the production process errors may be discovered which could affect the content, and all legal disclaimers that apply to the journal pertain.
DELCATION OF INTERESTS
The authors declare no competing interests.
REFERENCES
- 1.Gazzaley A, and Nobre AC (2012). Top-down modulation: bridging selective attention and working memory. Trends in Cognitive. 16, 128–34. [DOI] [PMC free article] [PubMed] [Google Scholar]
- 2.D’Esposito M, and Postle BR (2015). The cognitive neuroscience of working memory. Annu. Rev. Psychol 66, 115–42. [DOI] [PMC free article] [PubMed] [Google Scholar]
- 3.Wallis G, Stokes M, Cousijn H, Woolrich M, and Nobre AC (2015) Frontoparietal and cingulo-opercular networks play dissociable roles in control of working memory. Journal of Cognitive Neuroscience. 27, 2019–34. [DOI] [PubMed] [Google Scholar]
- 4.Chao LL, and Knight RT (1995) Human prefrontal lesions increase distractibility to irrelevant sensory inputs. Neuroreport. 6,1605–10. [DOI] [PubMed] [Google Scholar]
- 5.Knight RT, Staines WR, Swick D, and Chao LL (1999) Prefrontal cortex regulates inhibition and excitation in distributed neural networks. Acta. Psychologica 101, 159–78. [DOI] [PubMed] [Google Scholar]
- 6.Desimone R, and Duncan J (1995) Neural mechanisms of selective visual attention. Annu. Rev. Neurosci 18, 193–222. [DOI] [PubMed] [Google Scholar]
- 7.Chatham CH, Frank MJ, and Badre D (2014) Corticostriatal output gating during selection from working memory. Neuron. 81, 930–42. [DOI] [PMC free article] [PubMed] [Google Scholar]
- 8.Chatham CH, and Badre D (2015) Multiple gates on working memory. Current Opinion in Behavioral Sciences. 1, 23–31. [DOI] [PMC free article] [PubMed] [Google Scholar]
- 9.Bhandari A, and Badre D (2016) A nimble working memory. Neuron. 91, 503–5. [DOI] [PubMed] [Google Scholar]
- 10.Myers NE, Stokes MG, and Nobre AC (2017) Prioritizing information during working memory: beyond sustained internal attention. Trends in Cognitive Sciences. 21, 449–61. [DOI] [PMC free article] [PubMed] [Google Scholar]
- 11.De Vries IEJ, van Direl J, Karacaoglu M, and Olivers CNL (2018) Priority switches in visual working memory are supported by frontal delta and posterior alpha interactions. Cerebral Cortex. 26, 1513–5. [DOI] [PMC free article] [PubMed] [Google Scholar]
- 12.Quentin R, King J-R, Sallard E, Fishman N, Thompson R, Buch E, Cohen L (2019) Differential brain mechanisms of selection and maintenance of information during working memory. Journal of Neuroscience. 39, 3728–40. [DOI] [PMC free article] [PubMed] [Google Scholar]
- 13.Sauseng P, Klimesch W, Heise KF, Gruber WR, Holz E, Karim AA, Glennon M, Gerloff C, Birbaumer N, and Hummel FC (2009) Brain oscillatory substrates of visual short-term memory capacity. Current Biology. 19, 1846–52. [DOI] [PubMed] [Google Scholar]
- 14.van Ede F (2017) Mnemonic and attentional roles for states of attenuated alpha oscillations in perceptual working memory: a review. European Journal of Neuroscience. 48, 2509–15. [DOI] [PMC free article] [PubMed] [Google Scholar]
- 15.van Ede F, Niklaus M, and Nobre AC (2017) Temporal expectations guide dynamic prioritization in visual working memory through attenuated α oscillations. Journal of Neuroscience. 37, 437–45. [DOI] [PMC free article] [PubMed] [Google Scholar]
- 16.Schneider D, Göddertz A, Haase H, Hickey C, and Wascher E (2019) Hemispheric asymmetries in EEG alpha oscillations indicate active inhibition during attentional orienting within working memory. Behavioural Brain Research. 359, 38–46. [DOI] [PubMed] [Google Scholar]
- 17.Borghini G, Candini M, Filannino C, Hussain M, Walsh V, Romei V, Zokaei N, Cappelletti M (2018) Alpha oscillations are causally linked to inhibitory abilities in ageing. Journal of Neuroscience. 38, 4418–29. [DOI] [PMC free article] [PubMed] [Google Scholar]
- 18.Hanslmayr S, Axmacher N, and Inman CS (2019) Modulating human memory via entrainment of brain oscillations. Trends in Neurosciences. 42, 485–99. [DOI] [PubMed] [Google Scholar]
- 19.Thut G, Veniero D, Romei V, Miniussi C, Schyns P, and Gross J (2011) Rhythmic TMS causes local entrainment of natural oscillatory signatures. Current Biology. 21, 1176–85. [DOI] [PMC free article] [PubMed] [Google Scholar]
- 20.Albouy P, Weiss A, Baillet S, and Zatorre RJ (2017) Selective entrainment of theta oscillations in the dorsal stream causally enhances auditory working memory performance. Neuron. 94, 193–206. [DOI] [PubMed] [Google Scholar]
- 21.Romei V, Driver J, Schyns PG, and Thut G (2011) Rhythmic TMS over parietal cortex links distinct brain frequencies to global versus local visual processing. Current Biology 21; 334–7. [DOI] [PMC free article] [PubMed] [Google Scholar]
- 22.Chanes L, Quentin R, Tallon-Baudry C, and Valero-Cabre A (2013) Causal frequency-specific contributions of frontal spatiotemporal patterns induced by noninvasive neurostimulation to human visual performance. Journal of Neuroscience. 33, 5000–5. [DOI] [PMC free article] [PubMed] [Google Scholar]
- 23.Hanslmayr S, Matuschek J, and Fellner M-C. (2014) Entrainment of prefrontal beta oscillations induces an endogenous echo and impairs memory formation. Current Biology 24, 904–9. [DOI] [PubMed] [Google Scholar]
- 24.Riddle J, Hwang K, Cellier D, Dhanani S, and D’Esposito M (2019) Causal evidence for the role of neuronal oscillations in top–down and bottom–up attention. Journal of Cognitive Neuroscience. 77, 768–79. [DOI] [PMC free article] [PubMed] [Google Scholar]
- 25.Souza AS, and Oberauer K (2016) In search of the focus of attention in working memory: 13 years of the retro-cue effect. Attention, Perception, & Psychophysics. 78; 1839–60. [DOI] [PubMed] [Google Scholar]
- 26.Klimesch W (1999) EEG alpha and theta oscillations reflect cognitive and memory performance: a review and analysis. Brain Research Reviews. 29, 169–95. [DOI] [PubMed] [Google Scholar]
- 27.Roux F, and Uhlhaas PJ (2014) Working memory and neural oscillations: alpha–gamma versus theta–gamma codes for distinct WM information? Trends in Cognitive Sciences. 18, 16–25. [DOI] [PubMed] [Google Scholar]
- 28.Romei V, Thut G, and Silvanto J (2016) Information-based approaches of noninvasive transcranial brain stimulation. Trends in Neurosciences. 39, 782–95. [DOI] [PubMed] [Google Scholar]
- 29.Todd JJ, Marois R. (2004) Capacity limit of visual short-term memory in human posterior parietal cortex. Nature. 428, 751–4. [DOI] [PubMed] [Google Scholar]
- 30.Xu Y, and Chun MM (2006) Dissociable neural mechanisms supporting visual short-term memory for objects. Nature. 440, 91–5. [DOI] [PubMed] [Google Scholar]
- 31.Todd JJ, and Marois R (2005) Posterior parietal cortex activity predicts individual differences in visual short-term memory capacity. Cogn. Affect. Behav. Neurosci 5, 144–55. [DOI] [PubMed] [Google Scholar]
- 32.Vogel EK, McCollough AW, and Machizawa MG (2005) Neural measures reveal individual differences in controlling access to working memory. Nature. 438, 500–3. [DOI] [PubMed] [Google Scholar]
- 33.Lepsien J, Thornton I, and Nobre AC (2011) Modulation of working-memory maintenance by directed attention. Neuropsychologia. 49, 1569–77. [DOI] [PubMed] [Google Scholar]
- 34.Killebrew K, Mruczek R, and Berryhill ME (2015) Intraparietal regions play a material general role in working memory: evidence supporting an internal attentional role. Neuropsychologia. 73, 12–24. [DOI] [PMC free article] [PubMed] [Google Scholar]
- 35.Goldman RI, Stern JM, Engel J Jr., and Cohen MS (2002) Simultaneous EEG and fMRI of the alpha rhythm. Neuroreport. 13, 2487–92. [DOI] [PMC free article] [PubMed] [Google Scholar]
- 36.Laufs H, Krakow K, Sterzer P, Eger E, Beyerle A, Salek-Haddadi A, and Kleinschmidt A (2003) Electroencephalographic signatures of attentional and cognitive default modes in spontaneous brain activity fluctuations at rest. Proceedings of the National Academy of Sciences. 100, 11053–8. [DOI] [PMC free article] [PubMed] [Google Scholar]
- 37.Moosmann M, Ritter P, Krastel I, Brink A, Thees S, Blankenburg F, Taskin B, Obrig H, and Villringer A (2003) Correlates of alpha rhythm in functional magnetic resonance imaging and near infrared spectroscopy. NeuroImage. 20, 145–58. [DOI] [PubMed] [Google Scholar]
- 38.Hazy TE, Frank MJ, and O’Reilly RC (2007) Towards an executive without a homunculus: computational models of the prefrontal cortex/basal ganglia system. Philosophical Transactions of the Royal Society B: Biological Sciences. 362, 1601–13. [DOI] [PMC free article] [PubMed] [Google Scholar]
- 39.Lisman J (2005) The theta/gamma discrete phase code occuring during the hippocampal phase precession may be a more general brain coding scheme. Hippocampus. 15, 913–22. [DOI] [PubMed] [Google Scholar]
- 40.Johnson EL, Dewar CD, Solbakk A-K, Endestad T, Meling TR, and Knight RT (2017) Bidirectional frontoparietal oscillatory systems support working memory. Current Biology. 27, 1829–35 [DOI] [PMC free article] [PubMed] [Google Scholar]
- 41.Busch N, and VanRullen R (2010). Spontaneous EEG oscillations reveal periodic sampling of visual attention. Proceedings of the National Academy of Sciences. 37, 10648–6053. [DOI] [PMC free article] [PubMed] [Google Scholar]
- 42.Voytek B, Kayser AS, Badre D, Fegen D, Chang EF, Crone NE, Parvizi J, Knight RT, and D’Esposito M (20150 Oscillatory dynamics coordinating human frontal networks in support of goal maintenance. Nat. Neurosci 18, 1318–24. [DOI] [PMC free article] [PubMed] [Google Scholar]
- 43.Helfrich RF, Huang M, Wilson G, and Knight RT (2017) Prefrontal cortex modulates posterior alpha oscillations during top-down guided visual perception. Proceedings of the National Academy of Sciences. 114, 9457–62 [DOI] [PMC free article] [PubMed] [Google Scholar]
- 44.Reinhart RMG, and Nguyen JA (2019) Working memory revived in older adults by synchronizing rhythmic brain circuits. Nature Publishing Group. 22, 820–7. [DOI] [PMC free article] [PubMed] [Google Scholar]
- 45.Scimeca J, Kiyonaga A, and D’Esposito M (2018) Reaffirming the Sensory Recruitment Account of Working Memory. Trends in Cognitive Sciences. 22, 190–2. [DOI] [PubMed] [Google Scholar]
- 46.Mazaheri A, Fassbender C, Coffey-Corina S, Hartanto TA, Schweitzer JB, and Mangun GR (2014) Differential oscillatory electroencephalogram between attention-deficit/hyperactivity disorder subtypes and typically developing adolescents. Biological Psychiatry. 76, 422–9. [DOI] [PMC free article] [PubMed] [Google Scholar]
- 47.Stitt I, Zhou ZC, Radtke-Schuller S, and Fröhlich F (2018) Arousal dependent modulation of thalamo-cortical functional interaction. Nat. Comms 9, 2455. [DOI] [PMC free article] [PubMed] [Google Scholar]
- 48.Shu Y, Hasenstaub A, and McCormick DA (2003) Turning on and off recurrent balanced cortical activity. Nature. 423, 288–93. [DOI] [PubMed] [Google Scholar]
- 49.Thielscher A, Opitz A, and Windhoff M (2011) Impact of the gyral geometry on the electric field induced by transcranial magnetic stimulation. NeuroImage. 54, 234–43. [DOI] [PubMed] [Google Scholar]
- 50.Rouder JN, Morey RD, Morey CC, and Cowan N (2011) How to measure working memory capacity in the change detection paradigm. Psychon. Bull. Rev 18, 324–30. [DOI] [PMC free article] [PubMed] [Google Scholar]
- 51.Brainard DH (1997) The psychophysics toolbox. Spatial Vision. 10, 433–6. [PubMed] [Google Scholar]
- 52.Pelli DG (1997) The videotoolbox software for visual psychophysics: transforming numbers into movies. Spatial Vision. 10, 437–42. [PubMed] [Google Scholar]
- 53.Kleiner M, Brainard D, Pelli D, Ingling A, Murray R, and Broussard C (2007) What’s new in psychtoolbox-3. Perception. 36, 1–16. [Google Scholar]
Associated Data
This section collects any data citations, data availability statements, or supplementary materials included in this article.
Supplementary Materials
Data Availability Statement
All analyses were run using custom code in MATLAB, the Statistical Parametric Mapping 12 (SPM12) toolbox, Analysis of Functional Neuroimaging toolbox (AFNI). Code and processed data used for the final analyses are available at https://osf.io/ufz56/. The raw data for this study are available upon request to the Lead Contact. The authors declare that all requests within reason will be fulfilled.