Abstract
The standard for diagnosing metopic craniosynostosis (CS) utilizes CT imaging and physical exam, but there is no standardized method for determining disease severity. Previous studies using interfrontal angles have evaluated differences in specific skull landmarks; however, these measurements are difficult to readily ascertain in clinical practice and fail to assess the complete skull contour. This pilot project employs machine learning algorithms to combine statistical shape information with expert ratings to generate a novel objective method of measuring the severity of metopic craniosynostosis.
Expert ratings of normal and metopic skull CT images were collected. Skull-shape analysis was conducted using ShapeWorks software. Machine-learning was used to combine the expert ratings with our shape analysis model to predict the severity of metopic CS using CT images. Our model was then compared to the gold standard using interfrontal angles.
17 metopic skull CT images of patients 5-15 months old were assigned a severity by 18 craniofacial surgeons, and 65 non-affected controls were included with a zero severity. Our model accurately correlated the level of skull deformity with severity (p<0.10) and predicted the severity of metopic CS more often than models using interfrontal angles (χ2=5.46, p=0.019).
This is the first study that combines shape information with expert ratings to generate an objective measure of severity for metopic craniosynostosis. This method may help clinicians easily quantify the severity and perform robust longitudinal assessments of the condition.
Keywords: metopic craniosynostosis, machine learning, craniosynostosis severity, interfrontal angle
Introduction
Metopic craniosynostosis (MC) refers to early fusion of the metopic suture and affects approximately 1 in every 6,000 children born in the United States. Unlike other forms of craniosynostosis, MC represents a diagnostic challenge, especially in more moderate cases, because the metopic suture normally closes well before one year of age.(1, 2) While both physical examination and CT imaging are used to detect MC, the primary indicator of disease is the presence of an abnormal head shape, referred to as trigonocephaly. In this condition, the head is characterized by an abnormal triangular shape with bifrontal narrowing, biparietal widening, a metopic ridge, as well as lateral supra-orbital rim retrusion and hypotelorism.(3)
There is a wide variation in surgical approaches to patients with metopic craniosynostosis depending on the severity of the deformity and the age of the patient. Currently determining the extent of disease and timing of operative intervention is largely dependent on a qualitative evaluation of the degree of deformity. The subjective nature of this method can result in significant practice variation across different treatment centers and within centers from patient to patient. This is especially true in mild cases of MC where subtle differences in head shape may not result in a clearly stigmatizing deformity. This has created an opportunity in the literature to identify objective measures of severity for metopic craniosynostosis. While many attempts have been made to quantify the deformity in the past, most studies rely on measurements taken in two-dimensions even though metopic craniosynostosis is inherently a three-dimensional deformity. In this study, we generate a 3D shape model to describe the severity of the deformity in patients with metopic craniosynostosis. We then compare this three-dimensional model to the predictive accuracy of the widely utilized interfrontal angle introduced by Kellog et. al.(4) This novel model will ultimately help eliminate subjectivity when determining the severity of MC and provide a unified platform for further outcome studies between different surgeons and institutions.
Materials and Methods
Cases and Controls
This was an IRB approved multi-institutional pilot study. CT scans were obtained for subjects 5-15 months old seen at the University of Pittsburgh Medical Center Children’s Hospital between 2002-2016. All images were obtained using a General Electric VCT 64 Slice CT scanner (General Electric, Fairfield, Conn) with a standard low dose fine cut (0.25mm) protocol. Patients with MC were diagnosed in clinic by a board-certified craniofacial plastic surgeon using CT imaging and physical exam. Controls were chosen from patients presenting to the hospital for trauma with no abnormalities on CT imaging. Descriptive statistics were calculated using Stata/SE version 15.1.
Expert Rater System
An expert panel of 10 craniofacial plastic surgeons and 8 pediatric neurosurgeons from the Synostosis Research Group (SynRG) were individually e-mailed the link to a web-based application called CranioRate to assign ratings to 3D metopic head shapes remotely (Figure 1). Raters were able to rotate and manipulate the 3D reconstructed CT scan in any direction for visualization and assessment in any preferred viewpoint. Ratings were assigned on a 10-point Likert scale (1-least severe, 10-most severe). Normal controls were assumed to have a uniform severity rating of zero. Intra-class correlation (ICC) was performed to quantify the level of agreement among surgeon scores.
Figure 1:
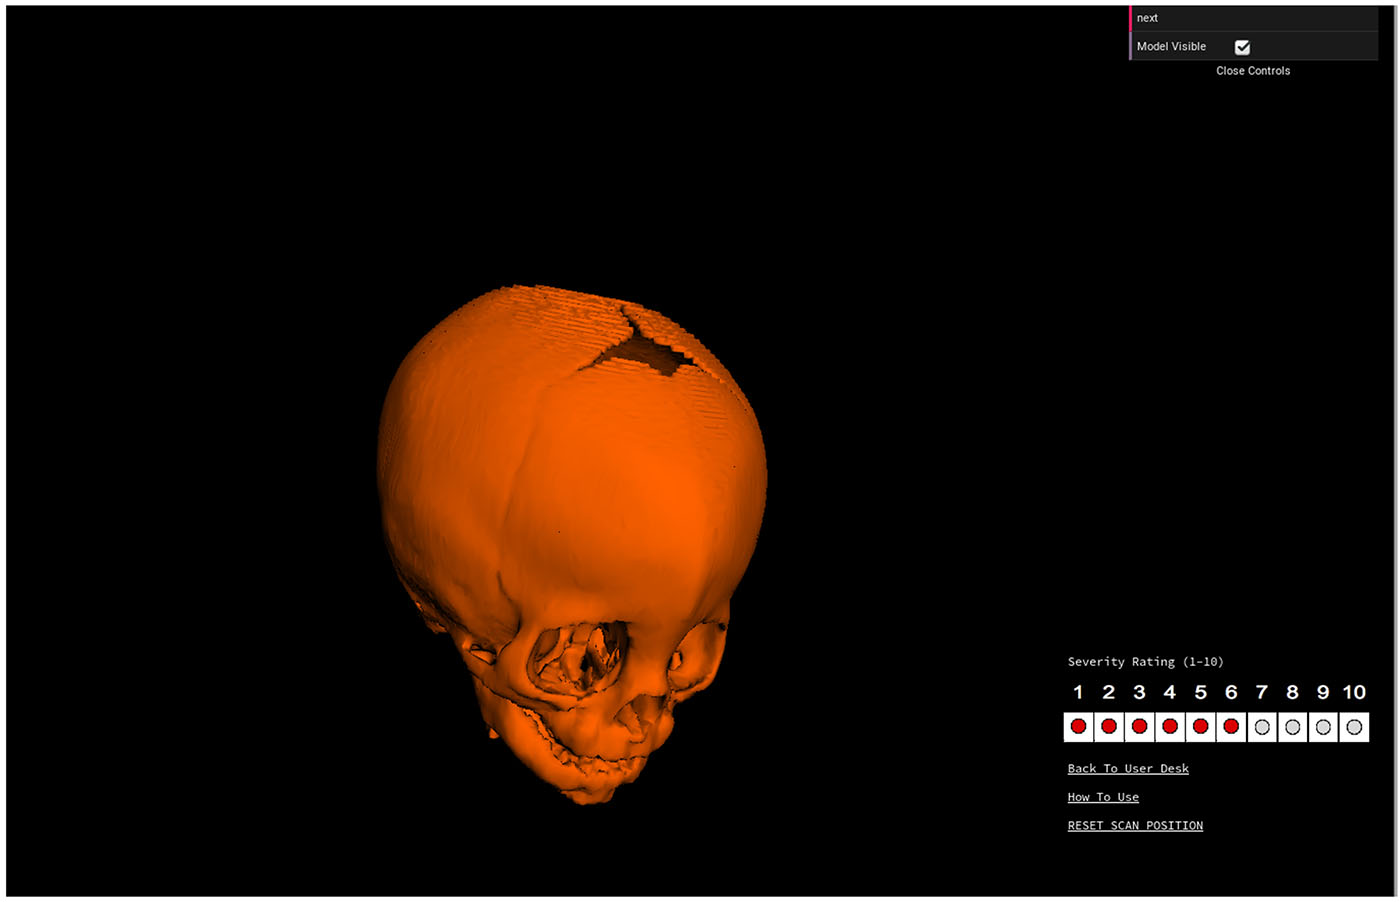
Example of a 3D skull shape sent to expert raters in the CranioRate application. Experts could rotate the 3D reconstruction in any direction to view the entirety of the skull, and then click on a number to record a severity rating.
3D Shape Modeling and Analysis
CT processing is summarized in Figure 2. Three dimensional skull CT’s were cut parallel to the Frankfort Horizontal plane at the level of the zygomatic-frontal suture(5, 6) in preparation for analysis by the ShapeWorks software.(7) ShapeWorks is an open-source software created by the University of Utah, Scientific Computing and Imaging Institute that utilizes an algorithm to automatically identify and place thousands of consistent 3D points (correspondences) on a cohort of shapes (Figure 2). Principal Component Analysis (PCA) was used to reduce the 3D point representation for each skull into 8 dimensions (which capture the essence of the entire 3D skull shape) so that each skull could be quantified by a single shape descriptor xi (Figure 3).
Figure 2:
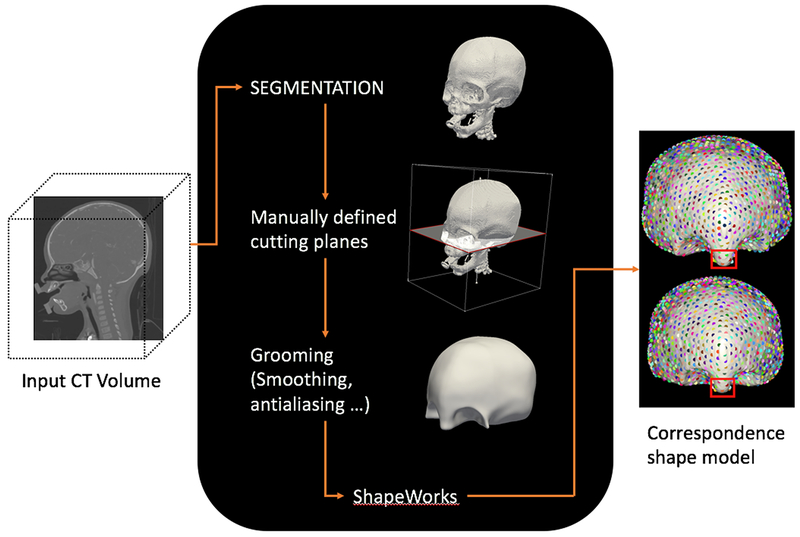
Computational process to prepare CT for processing by the Shapeworks Software. CTs were segmented into 3D models and manually cropped at previously identified planes. Models underwent advanced computational processing (smoothing and antialiasing) before being automatically converted into correspondence shape models (correspondence region depicted by the highlighted red box).
Figure 3:
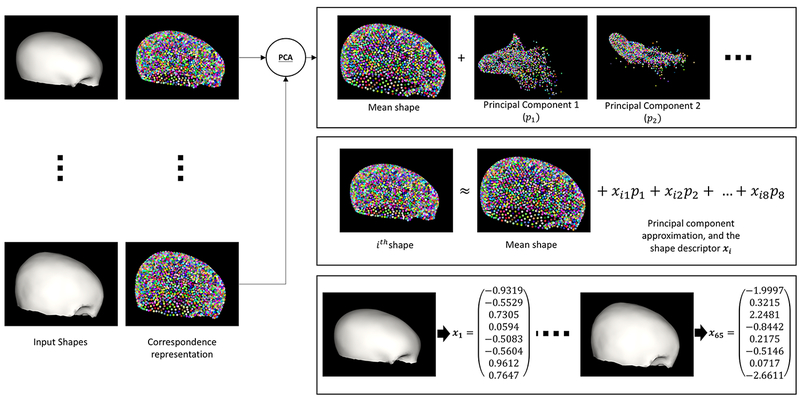
Process of principal component analysis. Each 3D skull was input into the ShapeWorks software, mapped with thousands of different points, and statistically analyzed in several different planes to generate a shape descriptor (xi) which identifies the geometric variations in each skull. Each scan is then represented using 8 scalar values and these form the proposed shape descriptor.
It was assumed that each skull had a latent severity measure (li) which represents the actual severity of the pathology, and was dependent on the shape of the skull (shape descriptor xi) and a regression coefficient (βj) in a linear manner as given by . Rasch Modeling(8–10) was used with the expert ratings to account for the internal bias of each rater with the latent severity of the scan (Figure 4). Rater biases (θj) based on individual biases in the survey were incorporated into the model.
Figure 4:

Representative top-down view of patients with varying degrees of metopic craniosynostosis severity.
MPLUS software was used to create a Maximum Likihood Estimation machine learning algorithm(11) with data collected from the expert ratings and shape descriptors in Shapeworks in order to approximate the unknowns: latent severity measure (li), rater biases (θj), and regression coefficients (βj). A Pearson’s correlation was conducted to assess the accuracy of fit of the model with significance set at α = 0.05. These regression values were used to generate a severity for each scan.
Validation and comparison to the Interfrontal Angle
The efficacy of the shape descriptor was validated by comparison with the interfrontal angle (IFA), a widely adopted shape descriptor. The same machine learning algorithm was applied to predict severity with IFA in place of the shape descriptor. Severity ratings for each CT scan were then reconstructed using our new 3D model and the IFA model, as previously described in the literature.(3, 4) Newly reconstructed ratings were compared with the ratings assigned by the experts using a Pearson Chi-squared test. A leave-one-out analysis(12) was performed after removing a single CT scan from the statistical model and after removing the ratings of a single expert to determine the influence of each additional rater on the model. The average error was estimated by mean squares difference between the latent severity prediction from the original model with that from the leave-one-out-analysis using MPLUS software.
Results
Patients and Expert Ratings
A total of 17 metopic skull CT images and 65 non-affected skull CT’s were included (Table S1). Each of the 18 experts assigned a severity ranking to the 17 metopic skull CTs for a total of 306 rankings. The calculated intraclass correlation coefficient was 0.716 (95% CI 0.57 −0.86), indicating a high level of agreement among surgeon rankings (values closer to 1 indicate more agreement).
3D Shape Modeling and Severity Calculation
A total of 2048 3D correspondence points were analyzed for each skull. The correlation coefficient constants (β) for the skull shapes were calculated by the machine learning algorithm. There was a significant relationship between latent severity and the shape descriptor in seven of the eight dimensions of analysis (p<0.05) (Table S2). In the non-statistically significant dimension, p-value was 0.056. The calculated regression coefficients from above and the results of the principal component analysis were used to generate a map indicating the anticipated malformations as severity of metopic craniosynostosis increases (Figure 5).
Figure 5:
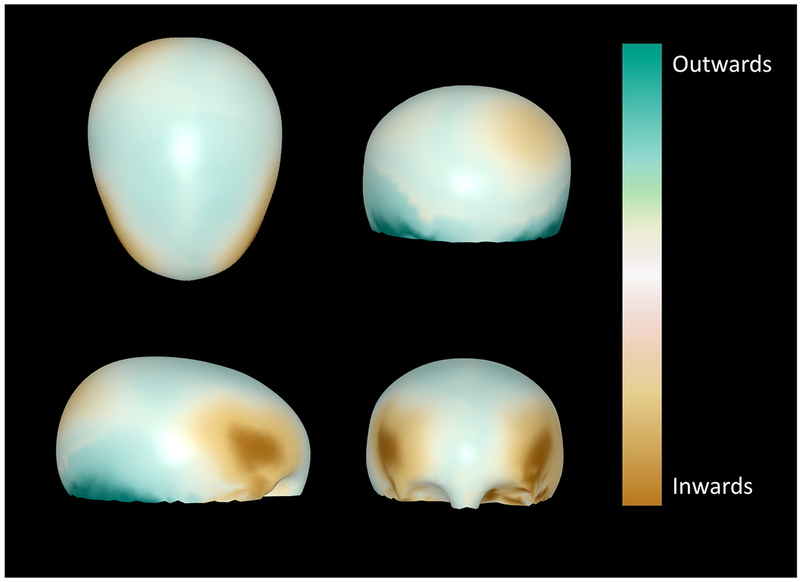
Normal skull with colorimetric overlay generated through the statistical model indicating the regions of malformation in the metopic CS skull, with color intensity proportional to severity.
Relationship to Interfrontal Angle
TThe recreated severity rankings from the new model and relationship to the interfrontal angle model are shown in Figure 6. The number of times the reconstructed ratings differed from the expert ratings, the sum of these values, and the relative average of the differences between the two methods are displayed in Table S3. A Pearson Chi-squared test statistic revealed a statistically significant lower proportion of misclassifications in the method using this newly proposed 3D model versus the interfrontal angle model (χ2=5.46, p=0.019).
Figure 6:
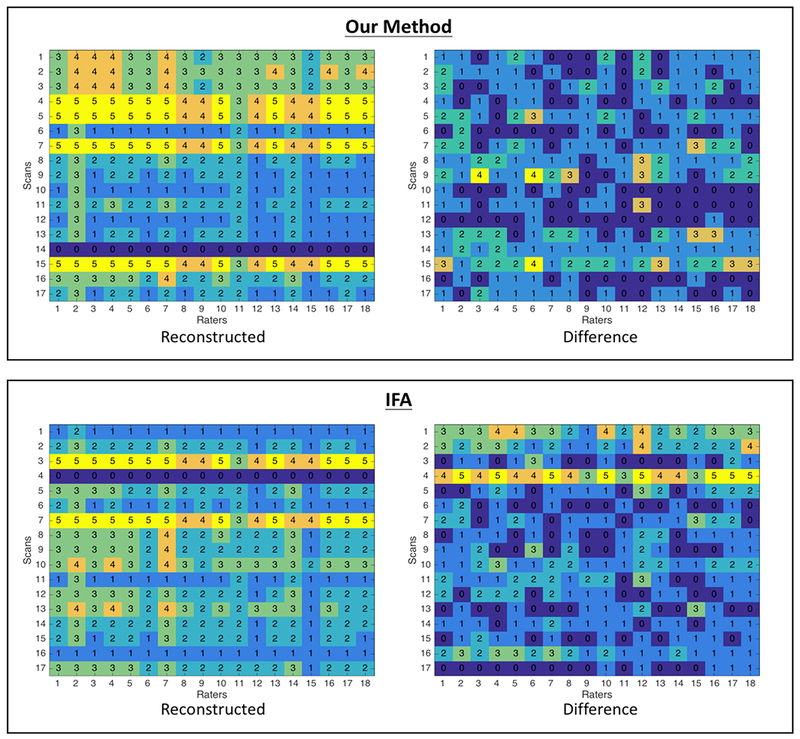
Comparison of our model to traditional IFA model of severity. Top Left: The ratings of each skull were constructed using our hypothesized statistical method (using a down sampled Likert scale range 1 to 5 and using the estimated latent severity and the rater bias to bin into the categorical values). Top Right: These recreated ratings were then compared to the ratings for the skulls provided by the experts to determine the accuracy of our model. Bottom Left: The ratings of each skull were constructed using the measured interfrontal angles. Bottom Right: These recreated ratings were then compared to the ratings for the skulls provided by the experts to determine the accuracy of the interfrontal angle model. The regression coefficient (λ) relating the latent severity measure (li) with the interfrontal angle (Ai) was calculated to be −0.496 in the relationship li = λ Ai.
Model Strength Evaluation
A leave-one-out analysis was performed after removing a single CT scan from this model, yielding a leave one out error of 9.61, variance of 87.37, and predicted r2 of 89%. Similarly, the leave-one-out analysis after removing a single rater yielded a leave one out error of 2.81, variance of 87.37, and predicted r2 of 97%. These errors and variances are on the unitless latent severity scale and represent how robustly the statistical model describes the given set of CT scans and raters respectively.
Discussion
Assessing the severity of patients with metopic craniosynostosis is a critical but underappreciated facet of the care of these complex patients. Traditional methods to gauge severity include plain radiographs, physical exam, and CT imaging; however, each of these modalities ultimately rely on the subjective assessment of the treating physician. This can introduce unintended treatment variability and inconsistency between patients, surgeons, and treatment centers and highlights a need for objective measures of severity for MC. Such a measure should be reproducible and lead to meaningful stratification. Ultimately, such measures could dictate the ideal circumstances for operative intervention, aid in predicting patients with poor post-operative outcomes (intracranial hypertension or aesthetic concerns), help compare longitudinal outcomes of metopic craniosynostosis between differing institutions and surgeons, and even inform patient-specific interventions.
The effort to define objective measures to quantify the severity of craniosynostosis has been a long undertaking among craniofacial surgeons. Perhaps the most obvious indication of severe craniosynostosis (and clear indication for surgery) are signs or symptoms of intracranial hypertension. Indeed, papilledema has been shown to be a highly specific (98%) measurable marker for intracranial pathology in patients with craniosynostosis.(13) Other signs such as headaches, and vision changes may also indicate the need for operative intervention. However, such physical symptoms are unreliable since the incidence of intracranial hypertension is exceedingly low at presentation and the vast majority of patients are asymptomatic initially.(14–16) Indeed, the indication for surgery is rarely to treat elevated pressure. Rather, surgery is performed both to minimize the potential for future intracranial hypertension and to normalize the head shape, and much study is focused on anthropometric measurements and skull landmarks to represent skull variations in metopic CS patients.
The trigonocephalic head shape present in metopic CS results from bilateral constriction of the frontal bones with an associated parieto-occipital bossing.(17) Weinzweig et. al(2) recently observed an endocranial metopic notch in 97% of metopic synostosis patients, helping to distinguish abnormal from normal suture fusion. While helpful as a diagnostic marker, the presence of an endocranial notch provides limited information on the exact timing of fusion and potential contribution of such a fusion on the degree of skull dysmorphology. Therefore, the effort to define objective measures for identifying the presence and severity of metopic craniosynostosis has evolved to the study of trigonocephalic components using anthropometric measurements. For example, Bottero et. al(18) measured the ratio of the interparietal to intercoronal distance to describe the degree of frontal stenosis present. Similar methods to associate trigonocephalic severity with skull measurements have been conducted using the interfrontal angle, angle of the nasopterion,(3) interobital distance and bitemporal width,(19) intercanthal distance to midfacial width ratio and endocranial bifrontal angle,(20) interzygomaticofrontal suture and interdacryon distance,(21) and a trigonocephaly severity index calculated from outlined cranial shapes (Table S4).(22)
While these measurements have proven helpful in describing the differences in trigonocephalic head shapes from normal, their influence over clinical decision making has been relatively limited. For example, many of these studies determined the influence of these variables on functional outcomes rather than morphological properties.(3, 18) Similarly, much of the data from these studies shows a great amount of overlap between control and metopic groups. Beckett et al.(21) found a significant degree of overlap in the endocranial bifrontal angle between metopic and control patients where angles in metopic patients ranged from 100 to 148 degrees and normal controls ranged from 134 to 160 degrees. Despite these factors, perhaps the biggest limitation of these studies is that they rely on measurements taken in two-dimensions when metopic craniosynostosis is inherently a 3-dimensional deformity. With the advent of modern advanced analytical software and machine learning, the subtleties of the 3D head shape changes in craniosynostosis no longer need to be ignored so that the shape can be distilled into simple angles and dimensions which are measured by hand. More powerful 3D analytical techniques can evaluate magnitudes more data and help identify patterns which would otherwise be overlooked by simpler methods. This factor advocates strongly for our method of analysis using principal component analysis and the Shapeworks Software. Our methodology analyzed the geometric relationships of 2048 different points on the 3D skull capturing 95% of the variability in head shapes. To our knowledge, there has been no other study that has been able to describe the morphologic aberrations in metopic head shapes using such a complete 3D map of the skull.
In the described model, we hypothesized that the severity seen on a CT scan of the skull could be predicted by the shape descriptor variable, generated from an analysis of the thousands of correspondence points located on the 3D skull, and correlated with the expert ratings from 18 craniofacial and neurosurgeons. The values from this analysis were then utilized in a modernized, machine learning algorithm called maximum likelihood estimation to calculate unknown parameters in our model that would complete the predicted severity for each skull.
To our knowledge, machine learning has never been applied to predict the severity of metopic craniosynostosis using 3D head shapes. The technique originates from advancements in computer science describing the ability of a computer to improve performance of a task without explicit programming for that task, essentially “learning” by pattern recognition and data. In our model, machine learning was utilized to provide more accurate predictions for severity after understanding the patterns and assigned rankings from expert raters. The effectiveness of this methodology is summarized by the correlation coefficients of our model, which were statistically significant at the 0.05 level in seven of the eight dimensions of analysis (with p-value of the eighth approaching significance at 0.056). A leave-one-out analysis yielded strong positive correlations after correction (r2=.89 and .97 respectively) and indicate that the shape descriptor utilized in this model was accurately predictive of a linear relationship to the overall severity of each CT scan.
While the majority of surgeons (95.3%) still rely heavily on the clinical assessment and results from CT imaging to determine the degree of trigonocephaly,(14) the interfrontal angle (IFA) has recently been utilized in conjunction with these modalities to help determine severity. The IFA measures the angle formed when two lines are connected from the coronal sutures to the most anterior portion of the mid-line forehead on axial CT imaging.(23) This objective measurement was validated in 2012 by Kellogg et. al(4) who observed a significantly more narrow angle in metopic head shapes vs. normal controls (117.78 vs. 144.8 degrees, p<0.0001). Anolik et. al(24) later built upon this model by using IFAs with expert rankings to classify the severity of metopic craniosynostosis. “Severe” synostosis corresponded to a ranking of 4 on the Likert scale with angles between 92.3 and 114.3 degrees, while normal head shapes corresponded to a median score of 1 with angles between 136.1 to 140.6 degrees. The authors found a significant level of agreement (p<0.0001) among expert ratings for head shapes falling into the severe and minor strata; however, expert ratings varied significantly for IFAs between 114.3-136.1 degrees. Ultimately, the authors concluded that the IFA could help as an operative threshold, especially for angles greater than 118.2 degrees. As part of our analysis, the IFA was calculated for the 17 metopic skull shapes and then compared to our model. When compared to the severities assigned by our 18 craniofacial experts, our model misclassified the severity rankings of trigonocephalic head shapes statistically significantly less than the model utilizing IFA (p=0.019). These results indicate that our model, built from an aggregate of the entire 3D skull, may more accurately predict the severity of metopic head shapes than previously utilized models, including the widely adopted IFA.
One of the limitations of this study includes the relatively small sample size for both metopic and normal control CT images. Furthermore, our model relied upon the ratings of craniofacial experts from both neurosurgical and plastic surgery disciplines potentially attributing to differences in the ratings assigned by each surgeon. Also, the 10-point Likert scale used by the surgeons in our Craniorate application was downsampled to a 5-point scale mathematically. Our analysis assumes that experts would rate skulls equally given a smaller scale, although this may not be accurate in practice. Another limitation arises from our assumption that the interfrontal angle was linearly predictive of head shape severity; however, it is possible that the relationship between IFA and head shape is correlated but not totally linear. It should also be noted that our correlation coefficient was not statistically significant (p=0.056) in one of the eight dimensions. This undoubtedly skews the impact of our analysis and accuracy of our model. Similarly, the use of expert raters may re-introduce subjectivity into the severity ratings. Finally, the machine learning tool used for this study may not be easily usable in clinical practice as it requires powerful machinery and skilled personnel. Currently, work is underway to expand our dataset to validate our results and to develop an easy to use, automated interface to take advantage of this novel tool as well as to use deep machine learning without the use of expert raters.
Objective determination of the severity of metopic CS may help clinicians chose when to operate and when to manage the condition conservatively, determine predictors of poor surgical outcomes including the development of intracranial hypertension and aesthetic deformities, and allow investigators to compare outcomes for metopic craniosynostosis between institutions and surgeons. We present a new model for predicting metopic craniosynostosis severity, built using guided machine learning, incorporating shape models visualizing the entire 3D skull with ratings correlation from 18 expert craniofacial surgeons. This is the first study that has adopted machine learning techniques to enhance the predictive ability of a severity stratification model in metopic craniosynostosis, and the results indicate that such a model can potentially predict the severity of metopic craniosynostosis more accurately than previously adopted methods. These results will serve as the infrastructure on which a user-friendly technical application can be built for clinicians to use in the clinical and non-clinical setting for determining the severity of metopic craniosynostosis.
Supplementary Material
Acknowledgments
Financial Disclosures: The authors have nothing to disclose. No funding was received for this article.
Footnotes
Presented at the Robert H. Ivy Society 2018 Plastic Surgery meeting and The Ohio Valley Society of Plastic Surgeons 2018 Meeting.
Accepted to the 18th Congress of International Society of Craniofacial Surgery for presentation September 16-19th, 2019 in Paris, France.
References
- 1.Cornelissen M, Ottelander B, Rizopoulos D, et al. Increase of prevalence of craniosynostosis. Journal of cranio-maxillo-facial surgery : official publication of the European Association for Cranio-Maxillo-Facial Surgery 2016;44:1273–1279. [DOI] [PubMed] [Google Scholar]
- 2.Weinzweig J, Kirschner RE, Farley A, et al. Metopic synostosis: Defining the temporal sequence of normal suture fusion and differentiating it from synostosis on the basis of computed tomography images. Plast Reconstr Surg 2003;112:1211–1218. [DOI] [PubMed] [Google Scholar]
- 3.Oi S, Matsumoto S Trigonocephaly (metopic synostosis). Clinical, surgical and anatomical concepts. Childs Nerv Syst 1987;3:259–265. [DOI] [PubMed] [Google Scholar]
- 4.Kellogg R, Allori AC, Rogers GF, Marcus JR Interfrontal angle for characterization of trigonocephaly: part 1: development and validation of a tool for diagnosis of metopic synostosis. J Craniofac Surg 2012;23:799–804. [DOI] [PubMed] [Google Scholar]
- 5.Bayome M, Park JH, Kook Y-A New three-dimensional cephalometric analyses among adults with a skeletal Class I pattern and normal occlusion. Korean J Orthod 2013;43:62–73. [DOI] [PMC free article] [PubMed] [Google Scholar]
- 6.Lonic D, Sundoro A, Lin H-H, Lin P-J, Lo L-J Selection of a horizontal reference plane in 3D evaluation: Identifying facial asymmetry and occlusal cant in orthognathic surgery planning. Scientific Reports 2017;7:2157. [DOI] [PMC free article] [PubMed] [Google Scholar]
- 7.Cates J, Fletcher TP, Martin S, Shenton M, Whitaker R Shape modeling and analysis with entropy-based particle systems. In Information Processing in Medical Imaging, -2007. [DOI] [PMC free article] [PubMed] [Google Scholar]
- 8.Rasch G Probabilistic Models for Some Intelligence and Attainment Tests. -: Danmarks: Paedagogiske Institut; 1960. [Google Scholar]
- 9.Uebersax JS, Grove WM A latent trait finite mixture model for the analysis of rating agreement. Biometrics 1993:823–835. [PubMed] [Google Scholar]
- 10.Lord FM, Novick MR, Brinbum A Statistical Theories of Mental Test Scores. England: : Addison-Wesley: Oxford; 1968. [Google Scholar]
- 11.Muthén LK, Muthén BO Mplus. Statistical Analysis with Latent Variables 2007;V3. [Google Scholar]
- 12.James G, Witten D, Hastie T, Tibshirani R An Introduction to Statistical Learning: With Applications in R: Springer Publishing Company, Incorporated; 2014. [Google Scholar]
- 13.Tuite GF, Chong WK, Evanson J, et al. The effectiveness of papilledema as an indicator of raised intracranial pressure in children with craniosynostosis. Neurosurgery 1996;38:272–278. [DOI] [PubMed] [Google Scholar]
- 14.Yee ST, Fearon JA, Gosain AK, Timbang MR, Papay FA, Doumit G Classification and Management of Metopic Craniosynostosis. J Craniofac Surg 2015;26:1812–1817. [DOI] [PubMed] [Google Scholar]
- 15.Renier D, Sainte-Rose C, Marchac D, Hirsch JF Intracranial pressure in craniostenosis. J Neurosurg 1982;57:370–377. [DOI] [PubMed] [Google Scholar]
- 16.Cornelissen MJ, Loudon SE, van Doorn FE, Muller RP, van Veelen MC, Mathijssen IM Very Low Prevalence of Intracranial Hypertension in Trigonocephaly. Plast Reconstr Surg 2017;139:97e–104e. [DOI] [PubMed] [Google Scholar]
- 17.Kim HJ, Roh HG, Lee IW Craniosynostosis : Updates in Radiologic Diagnosis. J Korean Neurosurg Soc 2016;59:219–226. [DOI] [PMC free article] [PubMed] [Google Scholar]
- 18.Bottero L, Lajeunie E, Arnaud E, Marchac D, Renier D Functional outcome after surgery for trigonocephaly. Plast Reconstr Surg 1998;102:952–958; discussion 959-960. [PubMed] [Google Scholar]
- 19.Posnick JC, Lin KY, Chen P, Armstrong D Metopic synostosis: quantitative assessment of presenting deformity and surgical results based on CT scans. Plast Reconstr Surg 1994;93:16–24. [PubMed] [Google Scholar]
- 20.Diluna ML, Steinbacher DM Simulated fronto-orbital advancement achieves reproducible results in metopic synostosis. J Craniofac Surg 2012;23:e231–234. [DOI] [PubMed] [Google Scholar]
- 21.Beckett JS, Chadha P, Persing JA, Steinbacher DM Classification of trigonocephaly in metopic synostosis. Plast Reconstr Surg 2012;130:442e–447e. [DOI] [PubMed] [Google Scholar]
- 22.Ruiz-Correa S, Starr JR, Lin HJ, et al. New severity indices for quantifying single-suture metopic craniosynostosis. Neurosurgery 2008;63:318–324; discussion 324-315. [DOI] [PMC free article] [PubMed] [Google Scholar]
- 23.Wood BC, Mendoza CS, Oh AK, et al. What’s in a Name? Accurately Diagnosing Metopic Craniosynostosis Using a Computational Approach. Plast Reconstr Surg 2016;137:205–213. [DOI] [PubMed] [Google Scholar]
- 24.Anolik RA, Allori AC, Pourtaheri N, Rogers GF, Marcus JR Objective Assessment of the Interfrontal Angle for Severity Grading and Operative Decision-Making in Metopic Synostosis. Plast Reconstr Surg 2016;137:1548–1555. [DOI] [PubMed] [Google Scholar]
Associated Data
This section collects any data citations, data availability statements, or supplementary materials included in this article.


