Abstract
The genomic platform that informs evolution of microRNA cascades remains unknown. Here we capitalised on the recent evolutionary trajectory of hominin-specific miRNA-4673, encoded in intron 4 of notch-1, to uncover the identity of one such precursor genomic element and the selective forces acting upon it. The miRNA targets genes that regulate Wnt/β-catenin signalling cascade. Primary sequence of the microRNA and its target region in Wnt modulating genes evolved from homologous signatures mapped to homotypic cis-clusters recognised by TCF3/4 and TFAP2A/B/C families. Integration of homologous TFAP2A/B/C cis-clusters (short range inhibitor of β-catenin) into the transcriptional landscape of Wnt cascade genes can reduce noise in gene expression. Probabilistic adoption of miRNA secondary structure by one such cis-signature in notch-1 reflected selection for superhelical curvature symmetry of precursor DNA to localise a nucleosome that overlapped the latter cis-cluster. By replicating the cis-cluster signature, non-random interactions of the miRNA with key Wnt modulator genes expanded the transcriptional noise buffering capacity via a coherent feed-forward loop mechanism. In consequence, an autonomous transcriptional noise dampener (the cis-cluster/nucleosome) evolved into a post-transcriptional one (the miRNA). The findings suggest a latent potential for remodelling of transcriptional landscape by miRNAs that capitalise on non-random distribution of genomic cis-signatures.
Subject terms: Genetic interaction, Origin of life, Cellular noise
Introduction
Genetic noise refers to cell–cell variability of gene expression that is measured based on the coefficient of variation of a signal across a population1. Buffering of transcriptional noise2,3 and its amplification4 are evolutionary mechanisms that improve phenotypic stability by canalisation5 or induce somatic heterogeneity, respectively. MicroRNAs stabilise the evolutionary interface of genotype and phenotype by canalisation of development6,7 and improving the heritability of novel traits5. To regulate genetic noise, miRNAs hybridise to transcripts that encode complementary “seed” sequences and uncouple the subsequent translation of the mRNAs or trigger the endonucleolytic cleavage of targeted transcripts8. As such, genic distribution of the “seed” sequences is a major factor that determines the potential interactions of miRNAs and the system-level manifestations of the interactions.
Random distribution of the seed region in various genes (1 in 46 bp for 6-mer seed regions) and a large-scale mutational drift subsequent to evolution of an individual miRNA can potentially adjust the specificity of the putative interactome to the estimated ≈100 target sites9 per miRNA. The latter view, however, conflicts with several major lines of evidence. Unlike 3′-untranslated regions (3′-UTR), sequences in the coding regions10 are highly conserved and not easily removed by mutational drift from the potential interactome of a newly evolved miRNA. Further, small genes such as those encoding olfactory receptors are not negatively biased against microRNA regulation11 despite lexical simplicity. Finally, emerging evidence suggests the importance of base pairing beyond the seed region in order to improve the specificity of targeting by miRNAs12. A plausible explanation for complementarity between miRNA-targets is that homologous regions evolve independently and yet simultaneously and are eventually co-opted by evolving miRNAs. In the current paper, we probe the former two propositions, co-option versus de novo evolution, by exploring the evolutionary trajectory of miR-467313,14 that is encoded in the notch-1 locus.
Recent work in our laboratory demonstrated that miR-4673 can efficiently reprogramme the population dynamics of proliferating cells by stimulating a synchronised mode of cycling13,14 that remarkably reduces cell–cell variability of the population. Mechanistically, this occurs by miR4673-mediated induction of autophagy13 that alters the balance of competition between Notch-1 and β-catenin15,16 in favour of the latter protein14. The competition between Notch-1 and β-catenin codes a bistable developmental switch15 that integrates system-level signalling inputs into a binary outcome. Resolution of the proliferation/differentiation dichotomy under instruction from the Wnt/β-Catenin pathway15 is an example of the binarization activity of the cascade. It therefore is not surprising that altered binarization threshold of the Wnt/β-catenin signalling cascade leads to profound morphological novelties. In the nervous system, for example, enhanced activity of Wnt cascade propels significant expansion of the cerebral cortex17. As such, fluctuations (noise) in the level of free cytoplasmic β-catenin are buffered by multiple parallel post-translational mechanisms18. Yet, unless transcriptional noise is controlled, fluctuations in post-translational modulators of β-catenin lead to an altered binarization threshold of the Wnt/β-catenin signalling cascade. Here, we provide evidence for the evolution of miR-4673 and the interacting homologous regions by co-option of transcriptional noise dampeners in notch-115,16 and other post-translational noise modulators of the Wnt/β-catenin signalling cascade.
Results
Structural features of miR-4673 were instructed by an intragenic enhancer of notch-1
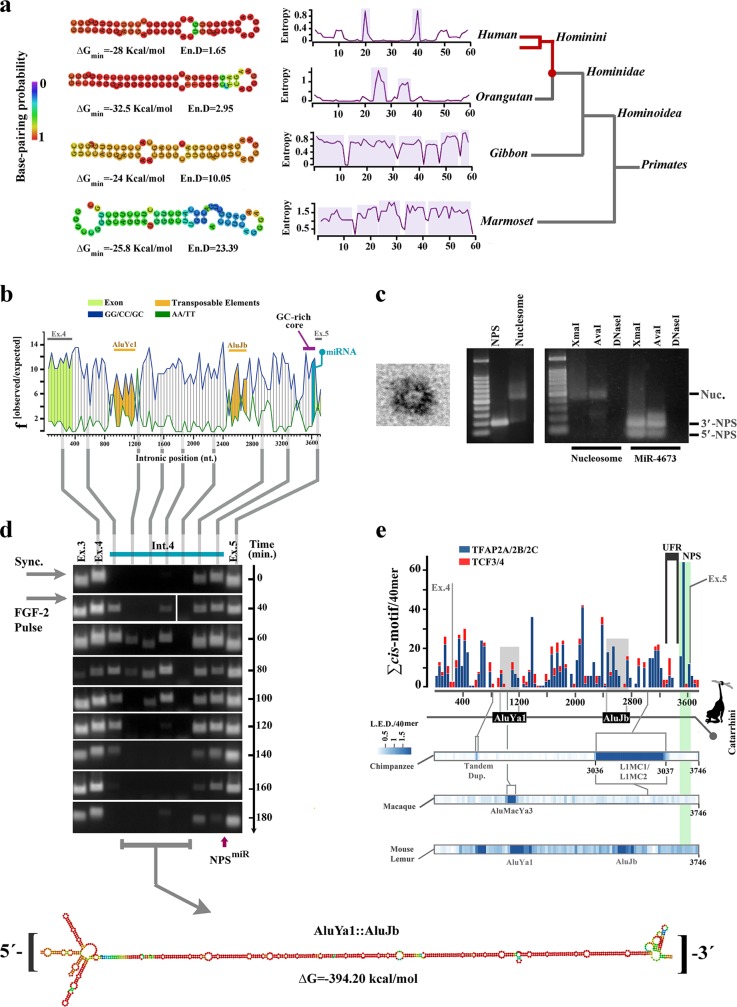
Pre-miRNAs are characterised by a secondary structure (imperfect stem loop) that licences processing by dicer19 and a primary sequence that instructs the specificity of targeting. We began by addressing evolutionary forces that informed secondary structure of the miRNA in Hominins (Fig. 1a). The primary sequence of miR-4673 intronic precursor in notch-1 had a bendable G/C-rich core and inflexible A/T-rich flanking regions (Fig. 1b). This arrangement is consistent with stringent human nucleosome positioning sequences (NPS) that predict well-positioned nucleosomes in vivo20. The propensity of miR-4673 intronic precursor to communicate with histones was validated experimentally. In vitro, a synthetic NPS corresponding to miR-4673 and immediate flanking sequences (NPSmiR: 5′-[A]4TGA[T]2C[T]3…TGA[G]2[A]4TAT-3′) readily reconstituted a stable nucleosome assembly with recombinant human H2A/H2B/H3.1/H4 histone octamers (Fig. 1c). It is known that an additional signature of a high affinity NPS is the palindromic nature of NPS primary sequence that generates superhelical curvature symmetry and accommodates twofold dyad symmetry of histone octamers21. This feature improves the translational (i.e. positional) stability of nucleosomes. We reasoned that evolution of the pre-miRNA hairpin might in part reflect structural adaptation of the NPSmiR for stable translational localisation of a nucleosome through palindromic superhelical symmetry. As translational stability is critical for nucleosomes that protect and regulate access to enhancers22, we investigated the enhancer activity of intron 4.
Fig. 1. Intronic precursor of miR-4673 in notch-1 codes an active enhancer.
a Structural analysis shows improved thermodynamic stability of the RNA hairpin in the primate lineage culminating in structural maturation of the miR-4673 hairpin in Hominins. b Nucleosome-favouring dinucleotide usage map of human notch-1 intron 4. c Transmission electron micrograph of a nucleosome formed by NPSmiR (left). Gel retardation (middle) and restriction enzyme digestion assays (right) provided further confirmation for nucleosome formation by NPSmiR. d The temporal profile of enhancer-RNAs (eRNAs) that originate from notch-1 intron-4 (full blots are provided in Supplementary Fig. 4). Vertical lines show the location of eRNAs with reference to the dinucleotide usage map. In order to access the eRNA profile, cells were synchronised at G0 and released into G1 by application of a single pulse of FGF-2. Note the temporal stability of 3′-eRNA from a region that corresponds to NPSmiR (see Supplementary Fig. 5). This region is positioned at the 3′-terminus of a stable RNA palindrome formed by two Alu elements. e Histogram shows cumulative distribution of TCF3/4 and TFAP2A/B/C cis-motifs in the intron 4 of human notch-1. At the bottom, Levenshtein distance (L.E.D) as a measure of intronic change is aligned to the enhancer map. Sequences that belong to AluJb and AluYa1 insertions in all Simians are in grey. Species-specific transpositional events are marked in LED heat maps.
Using primary human neural progenitor cells, high-resolution nascent RNA-based temporal fingerprinting of enhancer RNA22 was employed to access active intra-genic enhancers23,24 in intron 4 of notch-1. An active enhancer was identified in intron 4 of notch-1 (Fig. 1d). The most active 3′-terminus of the enhancer in intron 4 was mapped to the NPSmiR and the upstream flanking region of NPSmiR (UFRmiR: 5′-[C]2[TG]2[GA]2CA…AGT[C]2TGT[C]2-3′). The 3′-enhancer encoded a combinatorial cis-module25 characterised by TCF3/4 binding clusters in UFRmiR and TFAP2A/B/C binding motifs in NPSmiR (Fig. 1e, detailed in Supplementary Table 1). TFAP2A/B/C family members act as short-range repressors of flanking TCF3/426. The NPSmiR, on the other hand, can position a +1 nucleosome27 (referenced to the enhancer) that stalls RNA polymerase-II (RNAP-II)28 and delays transcriptional elongation. Both these features (short-range repressor and +1 positioned nucleosome) can reduce notch-1 transcriptional noise29 by increasing the activation threshold of the enhancer. Corroborating this notion, we observed more stable and consistent activity (Fig. 1d) of the 3′-terminus of the enhancer (corresponding to UFRmiR + NPSmiR) compared to the 5′-terminus (exon4-intron4 junction) of the enhancer (Fig. 1d).
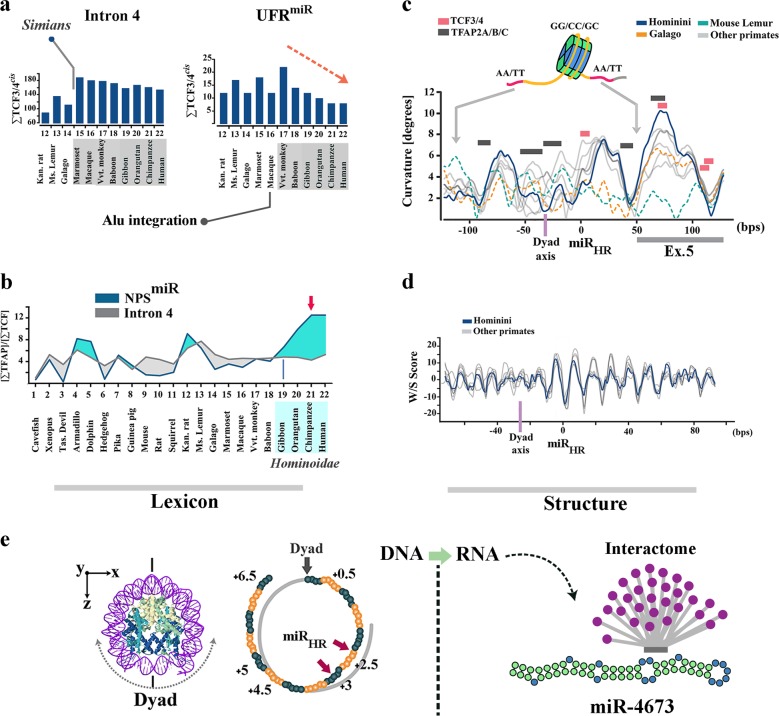
Enrichment of TCF3/4 cis-cluster in the intron 4 of notch-1 occurred prior to divergence of Simians (Fig. 2a). Thereafter, selection of structural features that could instruct noiseless Wnt-mediated activation of Notch-1 gained significant momentum in the common ancestor of Hominoidae (Fig. 2b, c). One such feature was significant enrichment of binding motifs for TFAP2A/B/C family members (short-range repressors of β-catenin26) (Fig. 2b). In Hominins, another structural change in the region that corresponds to NPSmiR was selection for more stringent histone-independent translational positioning of +1 nucleosome through enhanced superhelical curvature symmetry30 (Fig. 2c). Notably, mutational selection for superhelical symmetry of NPSmiR did not compromise the rotational nucleosome positioning that relies upon periodic W/S dinucleotide oscillations of the anisotropic NPS31 (Fig. 2d). Based on the evidence provided, we suggest the following plausible scenario for evolution of miRNA-4673. It is likely that structural evolution of the miRNA was as a bystander outcome that reflected selection for the improved superhelical symmetry of the NPSmiR with a primary lexicon inherited from the associated cis-cluster (Fig. 2e). We also suggest that natural selection of the miRNA could be due to reconfiguration of the competitive interface of notch-1 and β-catenin in favour of the latter protein (Fig. 3) leading to a further reduction of Notch-1 variability. We next probed the putative evolutionary scenarios for selectivity of targeting by miR-4673 (evolution of the interactome).
Fig. 2. Evolutionary trajectory of the structural features of notch-1 intronic enhancer is aligned to structural maturation of the miR-4673.
a TCF3/4 recognition motifs in intron 4 were reduced in higher primates. Depletion of TCF3/4 recognition motifs was more obvious in the upstream flanking region of NPSmiR (UFRmiR) (arrow shows the depletion trend of motifs). b TFAP2A/B/C binding motifs were enriched in NPSmiR toward the higher primates. Lines demonstrate [TFAP2A/B/C]:[TCF3/4] ratio in various mammalian species. c In primate lineage, tendency of NPSmiR to curve symmetrically gradually increased towards Hominins (top diagram, note the increased symmetry of the blue line with reference to the dyad region). This change can improve the translational stability of the nucleosome positioning sequence. d DNA anisotropy evidenced by W/S dinucleotide oscillations did not change significantly in the primate lineage. e The miRHR occupies superhelical locations +2.5 and +3 in the NPS with the palindromic sequence at superhelical locations +4.5 and +5 (middle). The superhelical symmetry accommodates twofold dyad symmetry of the nucleosome core particle and associated DNA (left, PDB ID: 3REI). In the transcribed RNA, superhelical positions +1 to +6.5 (65 bp) code pre-miR-4673.
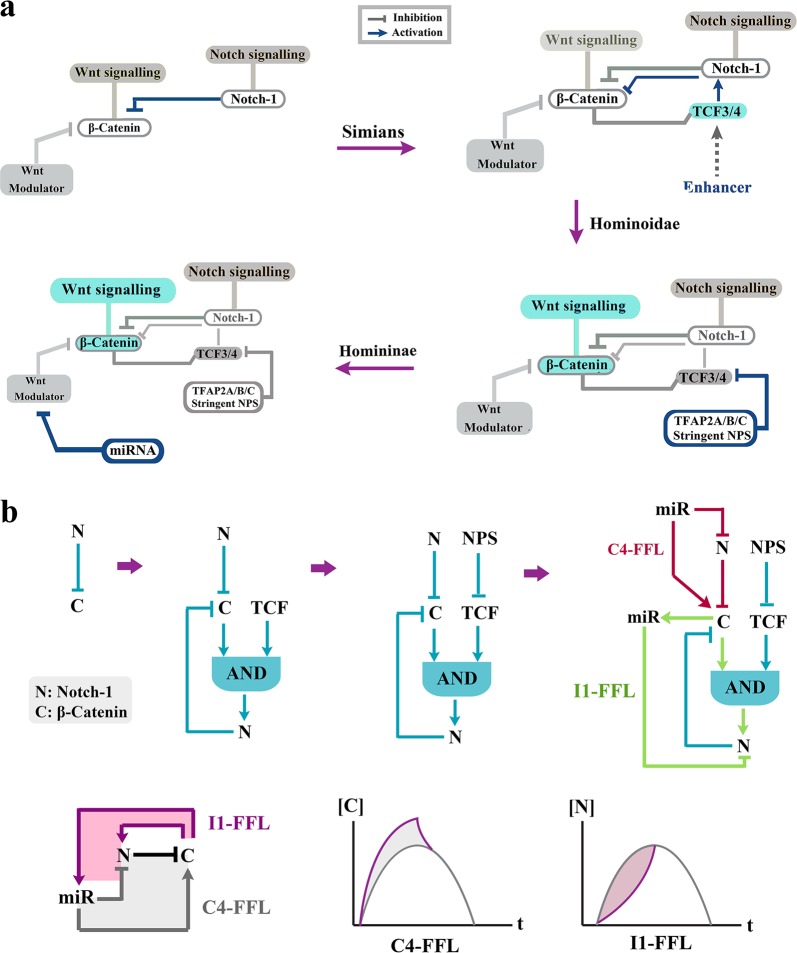
Fig. 3. Evolution of network topology of Notch-1/β-catenin in the primate lineage.
a Schematic diagrams demonstrate gradual evolution of network topology of the Notch-1/β-catenin axis in prosimians, simians, Hominoidae and Homininae. Note that sophistication of the topology parallels enhances signalling activity of the Wnt/β-catenin in higher primates. b Schematic diagrams (top) demonstrate gradual evolution of the network topology by recruitment of additional network motifs76,77 into the existing circuitry of Notch-1/β-catenin axis. Evolution of the microRNA radically alters78 the existing genetic network. Evolution of miRNA-4673 in Homininae generates a type-4 coherent feed-forward loop (C4-FFL) that amplifies activity of the Wnt/β-catenin (bottom). Simultaneously, inclusion of Notch-1 in a type-1 incoherent feed-forward loop (I1-FFL) formed by the miRNA reduces the signalling activity of the notch signalling pathway (bottom).
Evolutionary trajectory of miR-4673 targets mirrors structural maturation of the miRNA
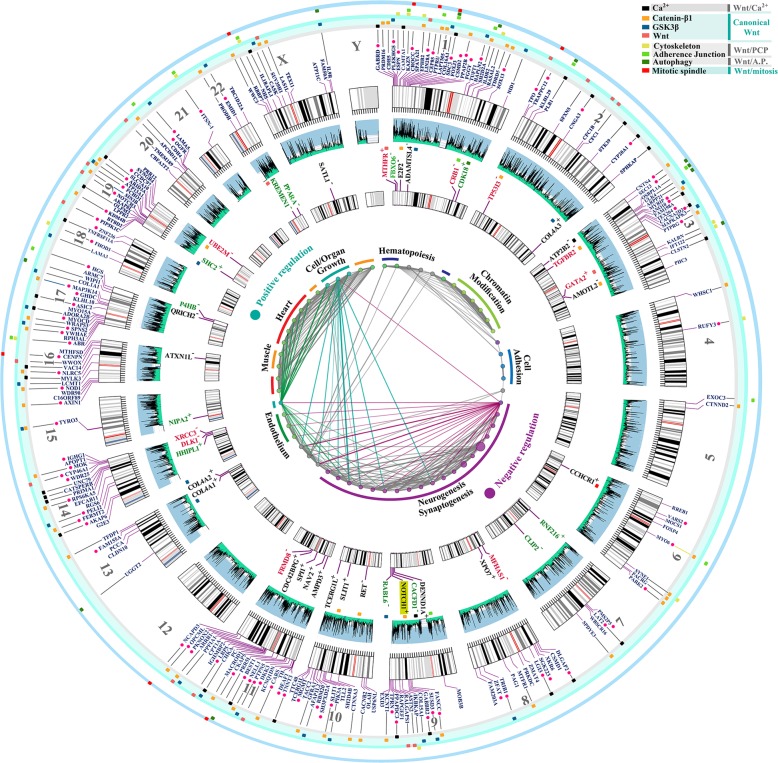
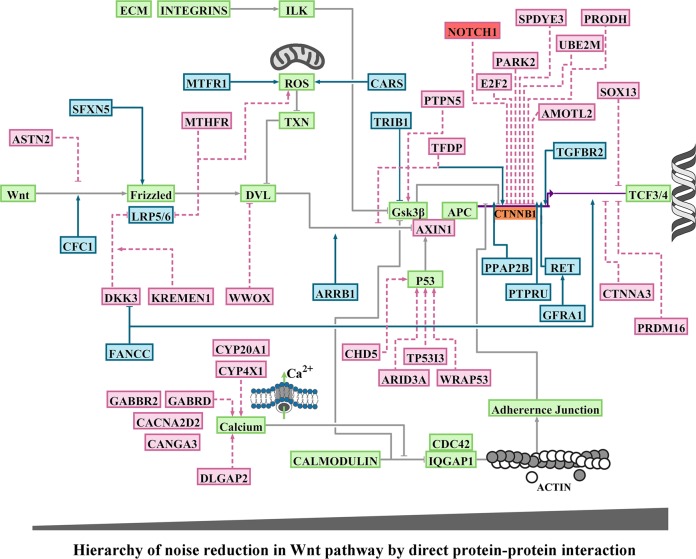
To resolve evolutionary trajectory of the miRNA targets, we decided to expand the homology requirement beyond the established 6-mer seed region12. We also expanded the homology region criteria to sequences that are positioned within the intronic, coding and the 5′-untranslated regions10. The miR-4673 homology regions (miRHR) were defined based on sequence homology to miR-4673 (Homologymin > 68%), conserved [5′-GGCTCCTGCC-3′] consensus sequence (± strand) and [miR–miRHR]ΔG < −36 kcal/mol [see Methods]. The choice of consensus sequence [5′-GGCTCCTGCC-3′] was based on previous experiments that determined high affinity targets of miR-467313. To trace global chromosomal coordinates of putative targets, we used BLAST analysis of miRHR against human genomic sequences (GRCh38). The analysis revealed non-random distribution of miRHR in dense gene clusters associated with GC-rich H3+ (GC > 52%) isochores (Fig. 4). Homology regions were identified in coding sequences (CDS), untranslated exonic regions (5′ and 3′e-UTRs) and introns (i-UTR) of human miRHR-coding genes in sense (miRHR+) or anti-sense (miRHR−) strands (Fig. 4). Genes signified by miRHR modulated canonical and non-canonical Wnt signalling cascades32 (Fig. 5) as detailed in Supplementary Discussion 1. We concluded that miRHR is a signature of a genic cluster whose protein products regulate the cytoplasmic availability of β-catenin as the main determinant of noise in the Wnt pathway (Fig. 5).
Fig. 4. Spatial and functional clustering of homology to miR-4673.
Genomic distribution of miR-4673 interactome shows distinct gene clusters localised to H3+ isochores (middle circular diagram). The miRNA homology regions (miRHR) were scattered in coding sequences (inner karyogram genes in black), 5′e-UTRs (inner karyogram genes in red), 3′e-UTRs (inner karyogram genes in green) and i-UTRs of human genes (outer karyogram). Sense and anti-sense directionality of (miRHR) in the inner karyogram is designated as + and −. In the outer karyogram red circles indicate the genes with miRHR in antisense direction to miR-4673. Genes with miRHR signature are involved in regulating development of cardiovascular and nervous systems (inner diagram). These genes act as calibrators (tissue-specific modulators) of Wnt signalling by fine-tuning canonical and non-canonical modules of the cascade (see Supplementary Discussion 1 for detailed elaboration). The outer colour-coded layer designates the interactome genes to canonical Wnt and non-canonical Wnt/Ca2+, Wnt/PCP (planar cell polarity), Wnt/Autophagy (A.P.) and Wnt/Mitosis cascades.
Fig. 5. Functional mapping of genes bearing homology to miR-4673.
BioTapestry visualisation of the Wnt/β-catenin pathway and the associated modulators. Green boxes demonstrate genes that comprise the backbone of the Wnt/β-catenin pathway and that do not code miRHR. The blue and red boxes are miRHR-coding positive and negative regulators of β-catenin, respectively (detailed in Supplementary Discussion 1). Genes that code miRHR are mainly involved in direct regulation of β-catenin. Indirect regulation of β-catenin occurs by modulating the stability of Cadherin-based junctions that in turn recruit β-catenin. Another major cluster of genes orchestrate calcium flux and hence the stability of cadherin-based junctions.
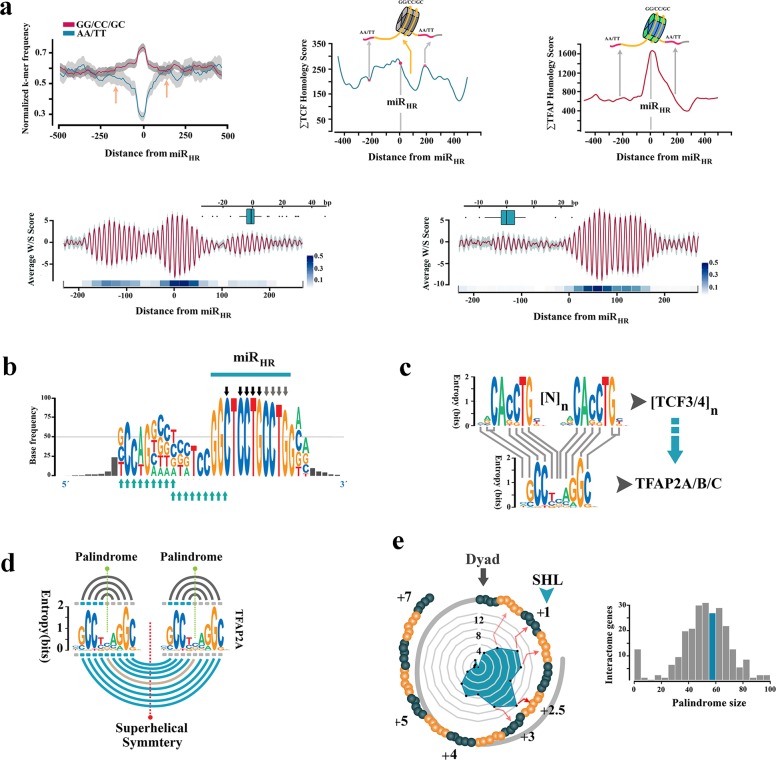
To unfold the genomic context of homology regions, all miRNA target regions were symmetrized to miRHR prior to structural analysis (Fig. 6a). The aligned sequences demonstrated a G/C-rich central core and inflexible A/T-rich boundary sequences similar to NPSmiR (Fig. 6a, left). Symmetrisation to miRHR also polarised the aligned sequences into homotypic TCF3/4 cis-clusters positioned upstream to miRHR and TFAP2A/B/C cis-clusters that flanked miRHR downstream to it in a W/S dinucleotide oscillatory background (Fig. 6a). The latter cis-anatomy closely replicated that of the NPSmiR in notch-1 intron-4 as described previously. Based on this observation, a plausible scenario is that targets and the miRNA embarked upon parallel evolutionary trajectories prior to maturation of a functional miRNA. The journey culminated at establishment of bipartite cis-clusters that can coordinate input into Wnt modulator genes by β-catenin (via TCF3/4 module) in a noise-free manner (by TFAP2A/B/C activity and the associated NPS). The miRHR is a chimeric junctional signature of the latter cis-modules (Fig. 6b); a contention bolstered by symmetrisation of cis-clusters to the miRHR (Fig. 6a). Notably, genomic regions specialised to recognise TCF3/4 clusters with high affinity can also be recognised by TFAP2A/B/C due to the similarity of the cis-lexicon (Fig. 6c). The latter observation in part explains diminished randomness in evolution of the described bipartite cis-clusters where functional hierarchy in Wnt cascade is aligned to the enrichment of TCF3/4 cis-clusters that in turn facilitates evolution of TFAP2A/B/C cis-clusters. Enrichment of TFAP2A/B/C cis-clusters not only can reduce TCF-dependent transcriptional noise but also improves superhelical symmetry of the underlying NPS (Fig. 6d, e). Therefore, selection for transcriptional noise buffering by enrichment of TFAP2A/B/C cis-motifs and superhelical symmetry of NPS in the DNA world could potentially empower a parallel and yet dormant journey towards palindromic symmetry in the RNA world (Figs. 6e and 7a). We interpreted the parallel structural maturation of the miRNA and the targets as a ‘competition’ for transcriptional noise reduction. After final maturation of miRNA structural signature by notch-1 NPSmiR, homologous regions in CDS, 5′ and 3′ e-UTRs of the competing genes were co-opted by the miRNA as its interactome (Fig. 4, inner karyogram). To that end, autonomous transcriptional noise filtering capacity of NPS in target genes was amplified and temporally tuned to transcriptional activity of the miRNA and its host gene notch-1. However, conservation of NPSmiR in the intronic regions that are not targeted prior to evolution of the miRNA indicates the importance of autonomous transcriptional noise filtering activity of NPS in the target genes.
Fig. 6. Adaptive evolution of miRHR enhancers in target genes.
a Average dinucleotide usage map in target genes after symmetrisation to miRHR (left; arrows indicate AA/TT-rich boundaries). Enrichment of TCF3/4 upstream and TFAP2A/B/C downstream to miRHR in symmetrised sequences (middle, right). Background W/S dinucleotide oscillations (bottom) overlapped the TCF3/4 cis-clusters (left; n = 101) or TFAP2A/B/C clusters (right, n = 86) (red line: mean, grey margin: bootstrapped confidence interval). Box plots show phase offset between oscillations symmetrised to miRHR (linear heat map; see methods). The linear heat maps demonstrate the average value for pair-wise cross-correlation of 20-mer fragments in structurally aligned NPS sequences. b Consensus motif for the miRNA hybridisation region (in RNA world) is chimeric with TCF3/4 cis-motifs (black and grey arrows) in miRHR and TFAP2A/B/C binding motifs (turquoise arrows) upstream to it. c Mutational revision of tandem TCF3/4 cis-motifs ([N]n: gap between tandem repeats) can generate TFAP2A/B/C recognition motif. d Tandem repeats of palindromic TFAP2A/B/C cis-motifs (grey lines) coerce a supersymmetry in the underlying DNA (turquoise lines). e SymCurv analysis of targets with peak TFAP2A/B/C values in the miRHR region (n = 46 genes) localised the signature to the superhelical locations (SHL) + 2.5 and +3 analogous to the miRNA in Fig. 2e (left). The right diagram shows hairpin size that is formed by miR-4673 target regions in the interactome genes (Supplementary Fig. 3).
Fig. 7. MiR-4673 targets are dormant immature pre-miRNAs.
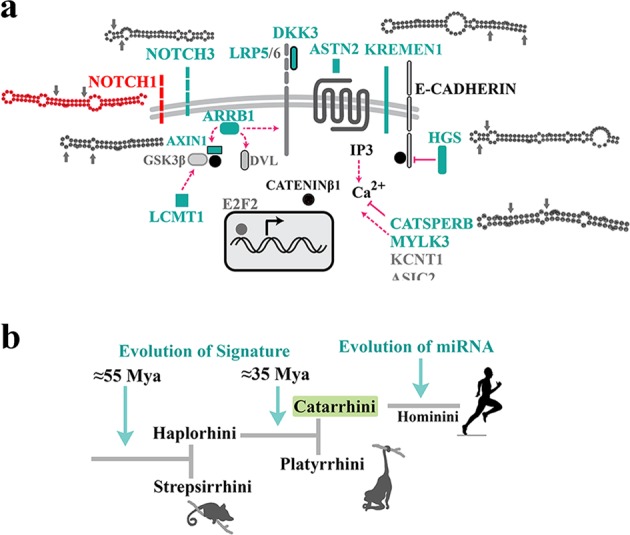
a Near-perfect RNA stem-loops were identified in key modulators of Wnt cascade that are targeted by the miRNA. Selection for structural features of DNA that improve nucleosome positioning propels a parallel journey in the RNA world to superimpose a stem loop signature in the miRHR region of most targets similar to miR-4673 secondary structure. Arrows designate miRHR in the hairpins. b Co-option of transposable elements into cis-clusters expanded the extant cis-clusters during the Eocene epoch prior to divergence of Catarrhini. Afterwards, a period of dormancy culminated in the evolution of the miRNA.
Reduction of noise in the transcriptional landscape of Wnt modulator genes by recruitment of bipartite enhancers occurred during the Eocene epoch and prior to divergence of Platyrrhine (≈56-33.9 Mya) by mutational remodelling of the extant genomic landscape or integration of transposable elements (Fig. 7b, Supplementary Table 2). This phase ceased before divergence of AluY transposable elements33 in Simians (Fig. 7b, Supplementary Table 2). Thereafter concurrent with the Eocene–Oligocene extinction event (~34 Mya)34 progressive selection of features that enhance translational stability of nucleosomes, e.g. superhelical symmetry and AA/TT boundary constraints, occurred. To uncover the selective advantage that stabilised miR-4673 in hominins after Pliocene, we investigated post-transcriptional reduction of genetic noise at a high temporal resolution.
Activity of miR-4673 temporally complements the noise-filtering capacity of notch-1
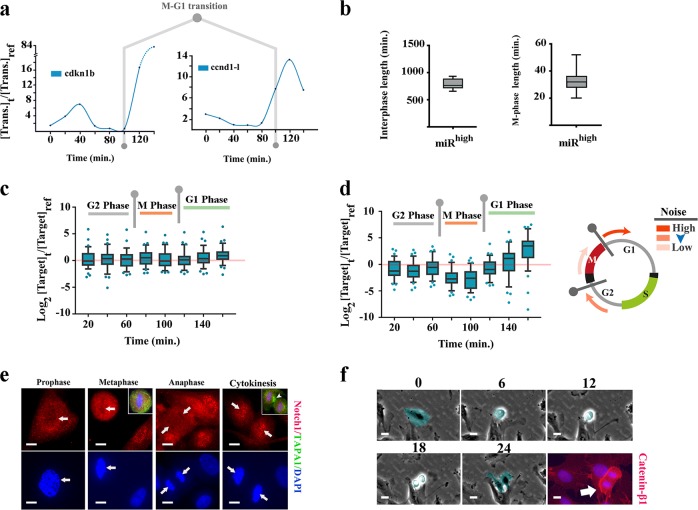
We inferred the impact of miR-4673 on transcriptional noise based on relative temporal availability of the targeted transcripts with reference to cell cycle in the control and the transfected cells. The transcriptional activity of genes that encoded miRHR in coding sequences and untranslated 5′ and 3′-exonic regions (genes of inner karyogram in Fig. 4) was measured using real-time quantitative polymerase chain reaction (qPCR). Preliminary experiments demonstrated relative synchronisation of the population-level cell cycle after 20 h at G0 phase of cycle13. Based on preliminary experiments, the first measurement (t0) was carried out 19 h after electroporation of the cells with naked miR-4673 (200 nM/106 cells). Thereafter, transcriptional activity was measured at regular intervals every 20 min for the next three hours. Transcriptional activity of cyclin-dependent kinase-1b (cdkn1b) and cyclin-D1 long isoform (ccnd-1l) was measured to fingerprint the phases of cell cycle precisely (Fig. 8a). Cyclin-D1 is required for progress from G1 to S phase35 and cdkn1b (p27) regulates the assembly and activation of CDK4 and Cyclin D136. Therefore the transcriptional activity of these two genes increases immediately after M phase to propel progress in G1 phase. We noted a significant boost in the activity of ccnd1l and cdkn1b at t100 (fifth time point or t = 100 min) and t120 (t = 120 min) (Fig. 8a). This transcriptional fingerprint was consistent with population-level transition from M to G1 phase of cell cycle at t100. On the other hand, completion of M phase required ≈30 min as measured by high-frequency single cell tracking of proliferating cells (Fig. 8b). Hence, the temporal window from t80 to t100 corresponded to an M phase-rich period in the population of cycling cells. The temporal points prior to t80 and after t100 were mapped to G2-rich and G1-rich windows, respectively.
Fig. 8. Cell cycle-specific modulation of transcriptional noise by miR-4673.
a Transcriptional fingerprint of cyclin-dependent kinase-1b (cdkn1b) and cyclin-D1-long isoform (ccnd1-l) was used as a proxy for cell cycle profile of the dividing population. The rising levels of ccnd1-l transcript at t120 is consistent with M–G1 transitional phase. b The length of M phase and interphase was measured using single-cell live imaging analysis of dividing cells (n = 20 cells). Based on the average length of M phase, t80 and t100 temporal windows accommodate the transcriptional profile of M phase. c Each box plot demonstrates the pooled expression levels of miR-4673 targets (n = 43 inner karyogram genes of Fig. 4) at specific time points ([Target]t) normalised to the expression levels of the same genes at time zero ([target]ref). Note that in the absence of exogenous miR-4673 the temporal expression profile shows a slight depression at t100 followed by an increase at t160. d Application of exogenous miR-4673 amplifies the temporal transcriptional signature of miR-4673 targets. Amplified suppression of the transcriptional profile prior to t120 anticipates the marked increase in the expression level of targets at t140 and t160. e Notch-1 fingerprinting shows absence of the activated protein in the nuclear compartment during M phase and the re-emergence concurrent with cytokinesis (top left). Cell surface glycoprotein, TAPA-1, demarcates the contractile ring formed during cytokinesis (Scale bars: 5μm). f Single-cell tracking of proliferating cells demonstrated increased level of cytoplasmic β-catenin after mitotic cell rounding and prior to cytokinesis (numbers: time points in min.) (Scale bars: phase contrast images 3 μm, bottom right micrograph 5 μm).
Following the amplification of miR-4673 (miRhigh cells), we noted a bimodal reprogramming of the transcriptional landscape of the targets (Fig. 8c, d). Amplification of the miRNA suppressed the transcript availability of target genes particularly at t80 and t100 (Fig. 8d, detailed in Supplementary Fig. 1). Hence, maximum transcriptional suppression by miR-4673 of the targets occurred during M phase of cell cycle (t80 to t100). The enhanced efficiency of miRNA-mediated suppression during M phase could be a reflection of differential activity of the RNA interference machinery in various phases of cell cycle with an increasing demand during M phase37,38. The transcriptional silencing by miR-4673 would reduce the standard deviation of targeted transcripts (i.e., transcriptional noise) by confining the upper limit of transcript variability3. For a single gene, standard deviation (S) of a transcript copy number (xi) in a population of cells would have an upper limit if the maximum copy numbers for that gene in individual cells converge towards the central value in population
| 1 |
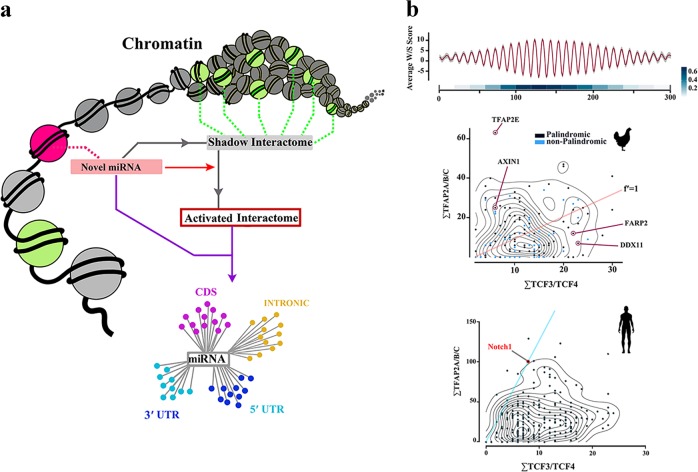
In other words, the upper limit (max xi) is maintained by miRNA-mediated buffering of transcriptional bursts. Therefore, miR-4673 reduces the upper limit of variability of the targeted transcripts by ≈55% at t80 and ≈65% at t100 (M phase). Notably, concurrent with entry into early G1, we noted enhanced transcriptional activity of the targets in the miRhigh cells (Fig. 8d). This finding is consistent with the reported cell cycle-dependent switching of miRNA activity from being a silencer to an activator39. The maximum noise buffering by miR-4673 that occurs during M–G1 transition compensates for the absence of noise reduction by notch-1 (miR-4673 host gene) during mitosis (Fig. 8e). Concurrent with mitotic exit, the cytoplasmic level of β-catenin protein suddenly increases (Fig. 8f). This is partly due to suppression of β-TrCP1-Skp1 complex during M–G1 transition40 that enhances the level of β-catenin to propel cell cycle progression41. If the binary threshold for β-catenin availability is surpassed during the M–G1 transition, the cell commits to the next mitotic cycle by progress into G1. Therefore, noise buffering activity of miR-4673 during this phase could potentially impact upon proliferative capacity of the cycling cells by modulation of the activation threshold of Wnt/β-catenin pathway. We sought experimental proof for this notion by identification of an interactome in other species that encodes the miRHR but is not yet targeted by any known miRNAs. Such a “shadow interactome” would anticipate and become active after structural maturation of a dormant miRNA and may accelerate acquisition of novel adaptive phenotypes at times of environmental crisis (Fig. 9a).
Fig. 9. ‘Shadow interactome’ and rewiring of genomic connectivity.
a Schematic demonstration of a shadow interactome evolved in a genomic context and in the absence of a functional miRNA. Members of the shadow interactome may complete their structural maturation towards a hairpin that is recognisable by Dicer and co-opt the other members as an activated interactome. b Genomic features of a ‘shadow interactome’ in Gallus gallus with sequence homology to human miR-4673. The miR-4673 homology region in Gallus gallus (gga-miRHR) showed W/S dinucleotide oscillations characteristic of anisotropic NPS (top; red line: mean, grey margin: bootstrapped confidence interval). The linear heat map demonstrates pair-wise cross-correlation of 20-mer fragments in structurally aligned NPS. Bottom left scatterplot/contour map shows distribution of TFAP2A/B/C and TCF3/4 cis-motifs in gga-miRHR gene cluster compared to human miR-4673 interactome. Note that enrichment of TFAP2A/B/C parallels generation of palindromic symmetry (black dots as opposed to blue dots clustered in the vicinity of red line). Also the lower TFAP2/TCF3/4 ratio in gga-miRHR compared to human miRHR suggests less stringent requirement for genetic noise reduction in chicken (red line: equal TFAP2/TCF3/4 ratio).
Activation of a dormant interactome by miR-4673 reduces developmental noise in chicken embryogenesis
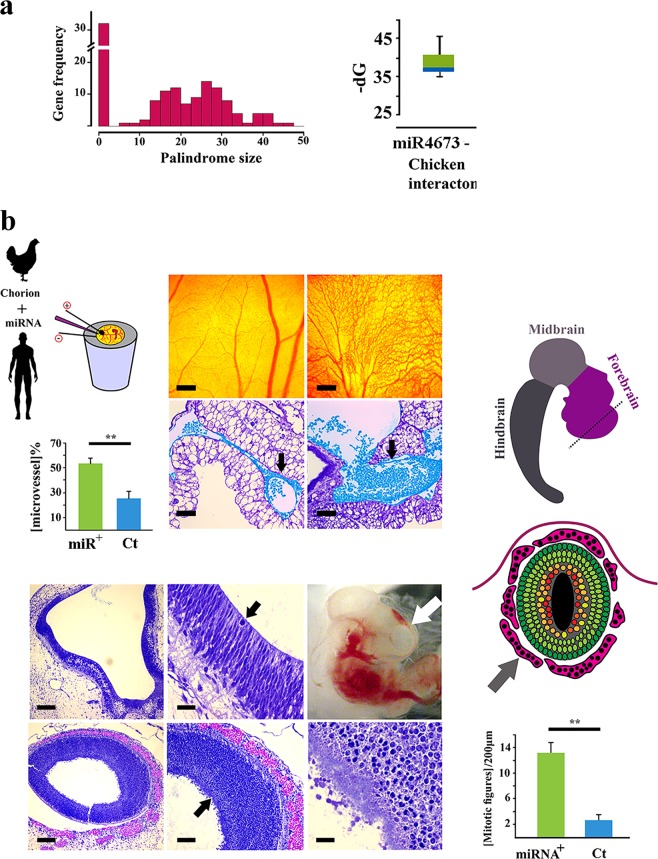
The miRHR was targeted in Mus musculus by mmu-miR-3104-5p (Supplementary Fig. 2). Hence, Gallus gallus (gga) was chosen as an accessible, distant endothermic species with distinct GC-rich isochores. An orthologous chicken-specific shadow interactome with miRHR NPS signature embedded in a simple W/S dinucleotide oscillatory background was identified that was not targeted by any known gga-miRNAs (Fig. 9b). An interactome map was generated to analyse targets of miR-4673 in chicken (Fig. 10, Supplementary Discussion 2). The gga-specific targets were also identified as modulators of Wnt cascade noise (Fig. 10, Supplementary Discussion 2). In ovo electroporation of human miR-4673 into chorio-allantoic membrane (CAM) of chicken embryo (HH16) triggered remarkable expansion of CAM vasculature (Fig. 11). Similarly, experimental application of miR-4673 to lateral ventricles of chicken embryo HH 23–25 (E4–4.5) followed by in ovo electroporation, triggered extensive synchronised and yet aberrant expansion of neural and hematopoietic precursors (Fig. 11). The enhanced mitotic activity was consistent with altered activity of Wnt/β-catenin pathway that is known to increase proliferative activity during organogenesis17. The cycle-independent application of the miR-4673 suffers from a lack of temporal fine-tuning due to the constant availability of the miRNA. The experiment, therefore, demonstrates the critical role of microRNA host genes in regulating the temporal dimension of miRNA-target interactions. We concluded that the dormant capacity of a shadow interactome can be accessed at times of evolutionary crisis by evolving miRNAs to propel remarkable evolutionary adaptations.
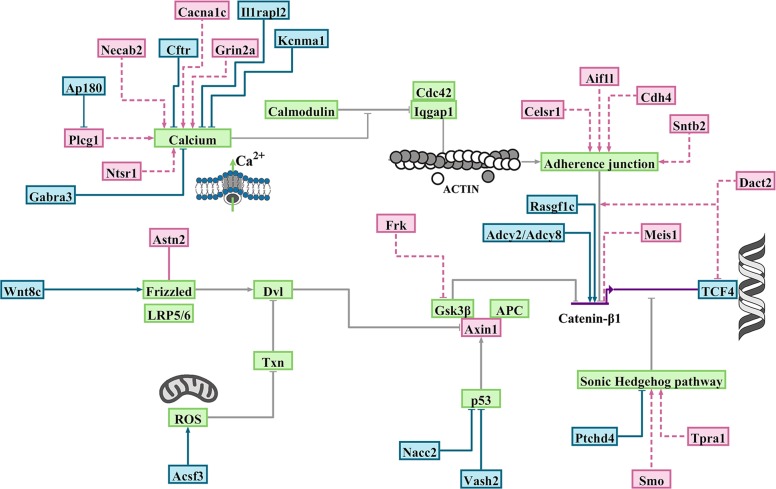
Fig. 10. Functional mapping of Gallus gallus gene bearing homology to miR-4673.
BioTapestry visualisation of Wnt/β-catenin pathway and the associated modulators. Green boxes demonstrate genes that comprise the backbone of the Wnt/Β-catenin pathway and that do not code miRHR. The blue and red boxes are miRHR-coding positive and negative regulators of β-catenin, respectively (Detailed in Supplementary Discussion 2). Some of the gga-genes that code miRHR are involved in direct regulation of β-catenin. Most gga-interactome genes are indirect regulators of Β-catenin activity. Indirect regulation of β-catenin occurs by modulating the stability of Cadherin-based junctions that in turn recruit β-catenin. Another major cluster of genes orchestrate calcium flux and hence the stability of cadherin-based junctions. A small cluster of miRHR-bearing gga-genes communicate with sonic hedgehog cascade, a major antagonist of Wnt/β-catenin, to regulate the activity of the latter pathway.
Fig. 11. Experimental activation of “shadow interactome” in Gallus gallus.
a Histogram (top left) shows the distribution of palindrome size in gga-miRHR region. Box plot (top right) shows ΔG for miR-4673/gga-miRHR hybridisation. The gga-miRHR genes are central to several developmental signalling networks interfacing at Wnt cascade. Amongst gga-miRHR genes several NPS from the Wnt cascade nearly achieved structural features of functional miRNAs. b Application of miR-4673 and activation of the identified gga-miRHR shadow interactome boosted angiogenic activity in chorio-allantoic membrane (top). Blue pseudo-colourised elements demonstrate expansion of microvessels (black arrow) along with increased hematopoiesis. The miRNA also amplified hematopoiesis (red pseudo-colour) and neurogenesis (black arrows) in the explanted embryo (frontal cortex: white arrow) (error bars: s.d; ** indicates p < 0.01).
Discussion
Our findings provide evidence for the evolutionary trajectory of miR-4673 by co-option (as opposed to de novo evolution) of genomic elements that operate to reduce transcriptional noise in the Wnt pathway. The proposed model suggests two major steps for the evolution of miR-4673. In the first stage and in the absence of the mature miRNA, selection of intragenic enhancers in Wnt cascade modulator genes seeded homologous primary sequences in a functional cluster of related genes. Throughout the next stage, competition for the reduction of transcriptional noise in Wnt cascade modulator genes (enrichment of TFAP2-binding motifs and palindromic symmetry) propelled structural maturation of miR-4673 in notch-1 while the other competing enhancers partially completed the journey.
Our findings regarding the evolution of pre-miR-4673 genomic sequence from a nucleosome positioning sequence are in agreement demonstrated enrichment of a positioned nucleosome on pre-miRNA genomic sequences42,43. Also in the light of the evidence for co-evolution of miRNA-target pairs44, it is surprising that the targets of miR-4673 demonstrate similar nucleosome positioning features. The co-evolution of miRNA-target pairs from homologous genomic structures predicts a degree of sequence homology that exceeds the reported 6-mer seed region criterion in animals. In a drastic contrast, plant miRNAs often demonstrate near-perfect complementarity to the targeted mRNAs45,46. While evidence is emerging regarding the importance of miRNA base-pairing beyond the conventional seed region in animal cells12,47, we believe that the dichotomy (seed region length) may in part result from the dynamic evolutionary landscape of plants compared to animals. Unlike animals, plants are stationary and hence rely on constant evolutionary adaptations by genomic innovations48. The rapid evolutionary rate of plant genes could provide a more accurate overview of miRNA-target homology for several reasons. The newly evolving microRNAs may exhibit near-perfect homology to the targets due to insufficient time required for mutational drift of the homology region. On the other hand, the redundant drifting miRNA-target interactions that generate the illusion of ‘seed region’ will be eliminated due to the rapid turnover rate of the genetic pool. This line of reasoning fits our observation of the near-perfect complementarity between miR-4673 and some of the targets that leads to the degradation of the targeted transcript, e.g., cdk-1813. We suggest that the recent evolutionary history of miR-4673 leaves insufficient time for mutational drift of the targets thereby replicating the hybridisation dynamics of plant microRNAs. In this scenario, the conventional 6-mer-based interactions are less important and belong to the drifting targets under instruction from other genomic forces. The latter hypothesis remains to be validated.
The findings reported herein attest to a remarkable potential for accelerated reprogramming of genomic connectivity through cis-regulatory elements concealed in non-coding DNA. Major evolutionary adaptations may be generated by subtle modulation of the transcriptional temporal domains (enhancers) that propel evolution of microRNAs. Findings of the present study may have broader implications for understanding the role of non-coding DNA in the evolution of complex metazoans.
Methods
Nucleosome positioning signature identification
An R script was written to calculate NPS of genomic sequences based on flexible GG/CC/GC-rich sequences and inflexible AA/TT-rich regions20. In order to construct the diagram shown in Fig. 1b of the main text, changes in NPS-favouring dinucleotide usage frequency in consecutive 40 mers of miR-4673 intronic precursor (5′-[A]4TGA[T]2C[T]3…[A]2CTGTGAGG[A]4TAT-3′] in Notch-1) were plotted according to the formula
| 2 |
| 3 |
where, fϕex. is the expected frequency of each dinucleotide and i is the dinucleotide position in each 40-mer (imax = 20). The top line in Fig. 1b represents ∑(fϕob./fϕex.)|ϕ∈(GG,CC,CG) and the bottom line is ∑(fϕob./fϕex.)|ϕ∈(AA,TT).
SymCurv analysis
SymCurv prediction of nucleosome positioning was performed as detailed elsewhere30,49. Briefly, curvature values of the sequence were calculated using BENDS50, through a sliding (1 bp) window of 30 bp, centred on each nucleotide. From the putative dyads defined as a local curvature minimum, highest SymCurv score, calculated based on the following equations, was selected as the putative dyad of choice
| 4 |
| 5 |
| 6 |
Distance from the putative dyad region (n for SymCurv(n,m) = Max) to miRHR was calculated and the two flanking superhelical regions (SHL) accommodating the miRHR were given a score of 1. All other SHL for that particular sequence were given a score of 0. Final score for each SHL was calculated as a sum of individual scores and shown as a radial line graph in Fig. 6e.
Analysis of DNA anisotropy
Analysis of DNA anisotropy was accomplished using nuMap software51. The analysis is based on periodic occurrence of AT-containing (WW) and GC-containing dinucleotides (SS) in minor and major grooves and shown to favour rotational nucleosome positioning31,52,53. Briefly, W/S score is calculated as a moving average score centred at position n based on the following equation:
| 7 |
The W/S dinucleotide oscillation plots were generated as sliding window of 1 bp.
Structural alignment of DNA anisotropy plots
Structural alignment of the W/S dinucleotide oscillations was performed in two steps. Pairwise cross-correlation analysis (see next subheading) of sequences symmetrised to miRHR provided a measure of phase offset which was subsequently curated manually for maximal cross-correlation of oscillations. The distribution of offset values (bps) was presented as a box plot in Fig. 6a. The aligned oscillations were subsequently presented as an averaged value (red line, Fig. 6a) and bootstrapped confidence interval (grey margin) using ggplot2 library of R platform.
Cross-correlation analysis
To analyse the cross-correlation of W/S dinucleotide oscillations, structurally aligned W/S oscillations (see previous section) were divided into 20-mers using R platform. Pairwise normalised cross-correlation of the 20-mer was then carried out using the R platform based on the following formula:
| 8 |
Calculated pair-wise cross-correlation values in each position (each 20-mer) were presented as a linear heat map using ggplot2 library of R.
PCR amplification of NPSmiR
Human genomic DNA was isolated from primary human brain progenitors using Qiagen® DNeasyTM Blood & Tissue kit. The DNA fragment corresponding to miR-4673 intronic precursor was amplified using the forward primer TCTTTCAAGCAGGGCGTGTCC and the reverse primer CTCACAGTTCTGGCCGGTGAA and PhusionTM High-Fidelity DNA Polymerase (New England BioLabs®). PCR reaction comprised 2 μL of gDNA, 1 μL of 5 μM forward/reverse primers, 4 μL of 5× Phusion HF Buffer and 1 μL of 10 mM dNTPs, DMSO (final concentration: 2%), 0.25 μL of Phusion DNA Polymerase, and 10.25 μL of PCR-grade water.
Nucleosome reconstitution
Recombinant human histone H2A/H2B dimer and recombinant human histone H3.1/H4 tetramer were purchased from NEB. Nucleosome was assembled with the salt dilution method as described elsewhere54. Briefly, recombinant histones (100 pmol of 20 μM H2A/H2B dimer, 50 pmol of 10 μM H3.1/H4 tetramer) were mixed with the amplified NPSmiR (50 pmol, 1:1 octamer to DNA ratio) and adjusted to 2 M NaCl and incubated at room temperature for 30 min. The reaction was serially diluted to 1.48, 1, 0.6 and 0.25 M NaCl by adding 10 mM Tris EDTA with 30-min incubations at room temperature in each dilution step.
Gel mobility shift assay
The mobility shift assay was performed as described elsewhere55. Briefly, 10 µl of each sample (reconstituted nucleosome and DNA alone) was mixed with 2 µl of 100% glycerol. A 1% agarose gel was prepared using TB buffer (45 mM Tris, 45 mM boric acid). The agarose gel was run at 10 V/cm for 30 min at room temperature. All gels derive from the same experiment and they were processed in parallel.
Restriction enzyme protection assay
A restriction map of the NPSmiR was prepared using NEB cutter. Two single cutter restriction enzymes (XmaI and AvaI from NEB) and DNAse-I (Life technologies, AM2222) were used to assess the protection of NPSmiR by histone in reconstituted nucleosome. The enzymatic digestion was accomplished in a solution comprised of 4 µl of reconstituted nucleosome, 1 µl of restriction enzyme, 1 µl of CutSmart® Buffer and 4 µl of Milli-Q water for 45 min at 37 °C. Digestion with DNAase-I was carried out in a solution comprised of 4 µl of reconstituted nucleosome, 1 μL DNase I (2 U), 1 μL DNase I Buffer, 4 µl of Milli-Q water for 30 min at 37 °C.
Electron microscopy
Ultrastructural validation of nucleosome reconstitution was achieved by using transmission electron microscopy56. Special grids were prepared by carbon evaporation onto a collodion film supported by a carbon film. The solution containing reconstituted nucleosomes was applied to the positively charged collodion-carbon coated grids for 3 min and then stained with 2% uranyl acetate (in water), rinsed 3–4 times in milli-Q water, and dried on filter paper. The grids were then shadowed with platinum from 2 perpendicular directions under an angle of 7–10°. Samples were visualised using a Philips CM120 BioTWIN electron microscope.
Cell culture
Human neural progenitors57 were purchased from ScienCell® (Carlsbad, CA). DMEM/F12 supplemented with 10% foetal calf serum (FCS), recombinant human FGF-2 (20 ng/ml, R&D Systems) and Antibiotic-Antimycotic® (100×, Life Technologies) was used for culturing the cells.
Enhancer RNA fingerprinting
Several specific short primers were designed to fingerprint the enhancer activity based on the nascent RNA as per Supplementary Table 3 and purchased from IDTDNA®. The primers avoided two Alu transposable elements in the intron 4 of notch-1 to achieve maximum stringency and specificity. The enhancer region was analysed by mfold platform58 to confirm lack of significant secondary structure that could hinder binding of designed primers. Post-synchronisation at G0, cells were pulsed with FGF-2 (20 ng/ml) in fresh media and RNA was isolated to fingerprint the enhancer59.
Reverse transcription and PCR
After DNase treatment, reverse transcription of extracted RNA was carried out using SuperScript-III reverse transcriptase and T4 gene 32 protein60 (Roche). PCR reactions (35 cycles) were then performed using the primers listed in Supplementary Table 4.
Cis-motif profiling
PWMs from JASPAR 201661 were used to identify the TFAP2A/B/C and TCF3/4 cis-motifs. A custom R script based on matchPWM function of Biostrings library was written to extract the cis-motifs of interest (homology threshold = 80%). A histogram was next generated to summarise the frequency of cis-motifs. Resolution of the histogram was optimised by adjusting bin width based on the method proposed by Shimazaki and Shinomoto62.
Identification of transposable elements
Two platforms were used to identify and cross-check primate-specific transposable elements in sequences of interest; RAPBASE (Genetic Information Research Institute) and Dfam 2.063.
Palindromic symmetry
CoFold platform64 was utilised to simulate co-transcriptional folding of sequences of interest. In this platform, the global algorithm of choice for simulating RNA secondary structure was based on thermodynamic parameters proposed by Turner et al.65.
Karyogram
Circos platform66 was used to generate the circular diagram of Fig. 4 of the main text. Isochore map corresponding to each chromosome was also generated using Circos platform by importing the results from GC-profile platform as explained in the following section.
Isochore mapping of human chromosomes
GC composition of chromosomal segments was calculated using GC-profile platform67. For segmentation of DNA68 the halting parameter (t0) of 100 and minimum length of 3000 were selected. The output files were subsequently imported into Circos platform to generate the circular isochore maps of Fig. 4 in the main text.
Identification of miRHR signature
To identify the miRHR signature, pre-miR-4673 sequence was blasted against the reference library (Homo sapiens all assemblies [GCF_000001405.33 GCF_000306695.2] chromosomes plus unplaced and unlocalized scaffolds in Annotation Release 108). The results were filtered based on defined homology criteria of sequence homology to mir-4673 (Homologymin > 68%, no gaps allowed), conserved [5′-GGCTCCTG-3′] consensus sequence in ±strand and [miR4673- miRHR]ΔG < −36 kcal/mol [miR4673- miRHR]ΔG was determined using RNAhybrid platform69 (BiBiServ2, Bielefeld University Bioinformatics Server).
Cytoscape for functional analysis
Cytoscape 3.3.0 was used for gene ontology and functional analysis of miR-4673 interactome genes. ClueGo application was utilised to analyse the identified interactome genes (Fig. 4 in the main text, inner circle).
Analysis of shadow gga-interactome
Shadow interactome of Gallus gallus were identified based on the same algorithms, criteria and stringency detailed for human genome. Go analysis of chicken interactome was performed using String 10.0 database70, The Gene Ontology Consortium Database71, KEGG database72 and PANTHER database73.
Ex ovo cultivation of chicken embryos
Fertilised Rhode Island Red eggs were obtained from a local hatchery. The method for ex ovo cultivation of chicken embryos is described elsewhere with slight modifications74. Briefly, fertilised eggs were incubated at 37 °C with constant rotation for three days before explantation. After this period the eggs were transferred to a shell-less culture system comprised of transparent plastic cup, clear polyethylene film and rubber bands to fix the film. The eggs were cracked and contents transferred to the shell-less system and covered by a bacterial agar plate. The system was then incubated at a temperature of 37 °C and relative humidity of 70%. Experiments were performed on cultivated embryos at stages HH-16 (51–56 h)75.
Ex ovo electroporation of chorioallantoic membrane
ECM 830 electroporator (Harvard Apparatus®) was used to generate square-wave electric pulses. The solution (20 mM HEPES, 135 mM KCl, 2 mM MgCl2, 0.5% Ficoll 400, 2 mM ATP/5 mM glutathione) containing the pGeneClip-miRNA plasmid (20 ng/μl) was loaded on top of the chorioallantoic membrane and gold-plated Genetrodes (3 mm L-Shape, Harvard Apparatus®) were placed on either side of the folded membrane. Electroporation was carried out at 62.5 V/cm, 50 ms, 2 pulses at 1-s intervals. The electroporated embryos were then incubated for 24 h at 37 °C before capturing the photograph followed by harvesting the membrane for histological processing.
Ex ovo electroporation of embryos
ECM 830 electroporator (Harvard Apparatus®) was used to generate square-wave electric pulses. The head of the embryo was exposed by cutting the chorionic membrane. A solution (20 mM HEPES, 135 mM KCl, 2 mM MgCl2, 0.5% Ficoll 400, 2 mM ATP/5 mM glutathione) containing the pGeneClip-miRNA plasmid (20 ng/μl) was injected into the canal of the neural tube under illumination in a surgical microscope (Leica M320). Platinum Tweezertrodes (5 mm, Harvard Apparatus®) were carefully positioned bilaterally around the embryo’s head and 4 mm apart. Parameters for ex ovo electroporation of chicken embryos were adapted from Sauka–Spengler et al. Electroporation was carried out at 62.5 V/cm, 50 ms, 5 pulses at 1-s intervals. The electroporated embryos were then incubated for 24 h at 37 °C before harvesting for histological processing.
Supplementary information
Acknowledgements
This study was supported by NIDCR grant R01 DE015272 and Australian National Health and Medical Research Council grant 512524.3.
Author contributions
R.M.F. conceived, designed, and performed the experiments, analysed and interpreted data, and wrote the paper. S.R.L. performed the experiments and contributed to design of experiments and analysis of data. N.H. conceived experiments, contributed to interpretation of the data, and contributed to the writing the paper.
Data availability
The authors declare that all data generated or analysed during this study are included within the article and its Supplementary information files.
Competing interests
The authors declare no competing interests.
Footnotes
Publisher’s note Springer Nature remains neutral with regard to jurisdictional claims in published maps and institutional affiliations.
Supplementary information
Supplementary information is available for this paper at 10.1038/s41540-020-0131-2.
References
- 1.Elowitz MB, Levine AJ, Siggia ED, Swain PS. Stochastic gene expression in a single cell. Science. 2002;297:1183–1186. doi: 10.1126/science.1070919. [DOI] [PubMed] [Google Scholar]
- 2.Raser JM, O’Shea EK. Noise in gene expression: origins, consequences, and control. Science. 2005;309:2010–2013. doi: 10.1126/science.1105891. [DOI] [PMC free article] [PubMed] [Google Scholar]
- 3.Rezaei-Lotfi S, Hunter N, Farahani RM. beta-Catenin: a metazoan filter for biological noise? Front. Genet. 2019;10:1004. doi: 10.3389/fgene.2019.01004. [DOI] [PMC free article] [PubMed] [Google Scholar]
- 4.Vujovic F, Hunter N, Farahani RM. Notch pathway: a bistable inducer of biological noise? Cell Commun. Signal. 2019;17:133. doi: 10.1186/s12964-019-0453-0. [DOI] [PMC free article] [PubMed] [Google Scholar]
- 5.Peterson KJ, Dietrich MR, McPeek MA. MicroRNAs and metazoan macroevolution: insights into canalization, complexity, and the Cambrian explosion. Bioessays. 2009;31:736–747. doi: 10.1002/bies.200900033. [DOI] [PubMed] [Google Scholar]
- 6.Hornstein E, Shomron N. Canalization of development by microRNAs. Nat. Genet. 2006;38(Suppl):S20–S24. doi: 10.1038/ng1803. [DOI] [PubMed] [Google Scholar]
- 7.Waddington CH. Canalization of development and genetic assimilation of acquired characters. Nature. 1959;183:1654–1655. doi: 10.1038/1831654a0. [DOI] [PubMed] [Google Scholar]
- 8.Brodersen P, Voinnet O. Revisiting the principles of microRNA target recognition and mode of action. Nat. Rev. Mol. Cell Biol. 2009;10:141–148. doi: 10.1038/nrm2619. [DOI] [PubMed] [Google Scholar]
- 9.Brennecke J, Stark A, Russell RB, Cohen SM. Principles of microRNA-target recognition. PLoS Biol. 2005;3:e85. doi: 10.1371/journal.pbio.0030085. [DOI] [PMC free article] [PubMed] [Google Scholar]
- 10.Brummer A, Hausser J. MicroRNA binding sites in the coding region of mRNAs: extending the repertoire of post-transcriptional gene regulation. Bioessays. 2014;36:617–626. doi: 10.1002/bies.201300104. [DOI] [PubMed] [Google Scholar]
- 11.Choi PS, et al. Members of the miRNA-200 family regulate olfactory neurogenesis. Neuron. 2008;57:41–55. doi: 10.1016/j.neuron.2007.11.018. [DOI] [PMC free article] [PubMed] [Google Scholar]
- 12.Broughton JP, Lovci MT, Huang JL, Yeo GW, Pasquinelli AE. Pairing beyond the seed supports microRNA targeting specificity. Mol. Cell. 2016;64:320–333. doi: 10.1016/j.molcel.2016.09.004. [DOI] [PMC free article] [PubMed] [Google Scholar]
- 13.Dokumcu K, Simonian M, Farahani RM. miR4673 improves fitness profile of neoplastic cells by induction of autophagy. Cell Death Dis. 2018;9:1068. doi: 10.1038/s41419-018-1088-6. [DOI] [PMC free article] [PubMed] [Google Scholar]
- 14.Farahani, R., Rezaei-Lotfi, S., Simonian, M. & Hunter, N. Bi-modal reprogramming of cell cycle by MiRNA-4673 amplifies human neurogenic capacity. Cell Cycle10.1080/15384101.2019.1595873 (2019). [DOI] [PMC free article] [PubMed]
- 15.Hayward P, Kalmar T, Arias AM. Wnt/Notch signalling and information processing during development. Development. 2008;135:411–424. doi: 10.1242/dev.000505. [DOI] [PubMed] [Google Scholar]
- 16.Kwon C, et al. Notch post-translationally regulates beta-catenin protein in stem and progenitor cells. Nat. Cell Biol. 2011;13:1244–1251. doi: 10.1038/ncb2313. [DOI] [PMC free article] [PubMed] [Google Scholar]
- 17.Chenn A, Walsh CA. Regulation of cerebral cortical size by control of cell cycle exit in neural precursors. Science. 2002;297:365–369. doi: 10.1126/science.1074192. [DOI] [PubMed] [Google Scholar]
- 18.Huber AH, Stewart DB, Laurents DV, Nelson WJ, Weis WI. The cadherin cytoplasmic domain is unstructured in the absence of beta-catenin. A possible mechanism for regulating cadherin turnover. J. Biol. Chem. 2001;276:12301–12309. doi: 10.1074/jbc.M010377200. [DOI] [PubMed] [Google Scholar]
- 19.MacRae IJ, Zhou K, Doudna JA. Structural determinants of RNA recognition and cleavage by Dicer. Nat. Struct. Mol. Biol. 2007;14:934–940. doi: 10.1038/nsmb1293. [DOI] [PubMed] [Google Scholar]
- 20.Valouev A, et al. Determinants of nucleosome organization in primary human cells. Nature. 2011;474:516–520. doi: 10.1038/nature10002. [DOI] [PMC free article] [PubMed] [Google Scholar]
- 21.Thastrom A, Bingham LM, Widom J. Nucleosomal locations of dominant DNA sequence motifs for histone-DNA interactions and nucleosome positioning. J. Mol. Biol. 2004;338:695–709. doi: 10.1016/j.jmb.2004.03.032. [DOI] [PubMed] [Google Scholar]
- 22.He HH, et al. Nucleosome dynamics define transcriptional enhancers. Nat. Genet. 2010;42:343–347. doi: 10.1038/ng.545. [DOI] [PMC free article] [PubMed] [Google Scholar]
- 23.Arner E, et al. Transcribed enhancers lead waves of coordinated transcription in transitioning mammalian cells. Science. 2015;347:1010–1014. doi: 10.1126/science.1259418. [DOI] [PMC free article] [PubMed] [Google Scholar]
- 24.Kim TK, et al. Widespread transcription at neuronal activity-regulated enhancers. Nature. 2010;465:182–187. doi: 10.1038/nature09033. [DOI] [PMC free article] [PubMed] [Google Scholar]
- 25.Rothbacher U, Bertrand V, Lamy C, Lemaire P. A combinatorial code of maternal GATA, Ets and beta-catenin-TCF transcription factors specifies and patterns the early ascidian ectoderm. Development. 2007;134:4023–4032. doi: 10.1242/dev.010850. [DOI] [PubMed] [Google Scholar]
- 26.Li Q, Dashwood RH. Activator protein 2alpha associates with adenomatous polyposis coli/beta-catenin and Inhibits beta-catenin/T-cell factor transcriptional activity in colorectal cancer cells. J. Biol. Chem. 2004;279:45669–45675. doi: 10.1074/jbc.M405025200. [DOI] [PMC free article] [PubMed] [Google Scholar]
- 27.Jimeno-Gonzalez S, Ceballos-Chavez M, Reyes JC. A positioned +1 nucleosome enhances promoter-proximal pausing. Nucleic Acids Res. 2015;43:3068–3078. doi: 10.1093/nar/gkv149. [DOI] [PMC free article] [PubMed] [Google Scholar]
- 28.Studitsky, V. M., Nizovtseva, E. V., Shaytan, A. K. & Luse, D. S. Nucleosomal barrier to transcription: structural determinants and changes in chromatin structure. Biochem. Mol. Biol. J.2, 8 (2016). [DOI] [PMC free article] [PubMed]
- 29.Blake WJ, M KA, Cantor CR, Collins JJ. Noise in eukaryotic gene expression. Nature. 2003;422:633–637. doi: 10.1038/nature01546. [DOI] [PubMed] [Google Scholar]
- 30.Nikolaou C, Althammer S, Beato M, Guigo R. Structural constraints revealed in consistent nucleosome positions in the genome of S. cerevisiae. Epigenet. Chromatin. 2010;3:20. doi: 10.1186/1756-8935-3-20. [DOI] [PMC free article] [PubMed] [Google Scholar]
- 31.Albert I, et al. Translational and rotational settings of H2A.Z nucleosomes across the Saccharomyces cerevisiae genome. Nature. 2007;446:572–576. doi: 10.1038/nature05632. [DOI] [PubMed] [Google Scholar]
- 32.Komiya Y, Habas R. Wnt signal transduction pathways. Organogenesis. 2008;4:68–75. doi: 10.4161/org.4.2.5851. [DOI] [PMC free article] [PubMed] [Google Scholar]
- 33.Batzer MA, Deininger PL. Alu repeats and human genomic diversity. Nat. Rev. Genet. 2002;3:370–379. doi: 10.1038/nrg798. [DOI] [PubMed] [Google Scholar]
- 34.Ivany LC, Patterson WP, Lohmann KC. Cooler winters as a possible cause of mass extinctions at the Eocene/Oligocene boundary. Nature. 2000;407:887–890. doi: 10.1038/35038044. [DOI] [PubMed] [Google Scholar]
- 35.Ezhevsky SA, et al. Hypo-phosphorylation of the retinoblastoma protein (pRb) by cyclin D:Cdk4/6 complexes results in active pRb. Proc. Natl Acad. Sci. USA. 1997;94:10699–10704. doi: 10.1073/pnas.94.20.10699. [DOI] [PMC free article] [PubMed] [Google Scholar]
- 36.Larrea MD, et al. Phosphorylation of p27Kip1 regulates assembly and activation of cyclin D1-Cdk4. Mol. Cell Biol. 2008;28:6462–6472. doi: 10.1128/MCB.02300-07. [DOI] [PMC free article] [PubMed] [Google Scholar]
- 37.Hall IM, Noma K, Grewal SI. RNA interference machinery regulates chromosome dynamics during mitosis and meiosis in fission yeast. Proc. Natl Acad. Sci. USA. 2003;100:193–198. doi: 10.1073/pnas.232688099. [DOI] [PMC free article] [PubMed] [Google Scholar]
- 38.Huang C, Wang X, Liu X, Cao S, Shan G. RNAi pathway participates in chromosome segregation in mammalian cells. Cell Discov. 2015;1:15029. doi: 10.1038/celldisc.2015.29. [DOI] [PMC free article] [PubMed] [Google Scholar]
- 39.Vasudevan S, Tong Y, Steitz JA. Switching from repression to activation: microRNAs can up-regulate translation. Science. 2007;318:1931–1934. doi: 10.1126/science.1149460. [DOI] [PubMed] [Google Scholar]
- 40.Wu G, et al. Structure of a beta-TrCP1-Skp1-beta-catenin complex: destruction motif binding and lysine specificity of the SCF(beta-TrCP1) ubiquitin ligase. Mol. Cell. 2003;11:1445–1456. doi: 10.1016/s1097-2765(03)00234-x. [DOI] [PubMed] [Google Scholar]
- 41.Shtutman M, et al. The cyclin D1 gene is a target of the beta-catenin/LEF-1 pathway. Proc. Natl Acad. Sci. USA. 1999;96:5522–5527. doi: 10.1073/pnas.96.10.5522. [DOI] [PMC free article] [PubMed] [Google Scholar]
- 42.Zhu S, et al. Chromatin structure characteristics of pre-miRNA genomic sequences. BMC Genomics. 2011;12:329. doi: 10.1186/1471-2164-12-329. [DOI] [PMC free article] [PubMed] [Google Scholar]
- 43.Ozsolak F, et al. Chromatin structure analyses identify miRNA promoters. Genes Dev. 2008;22:3172–3183. doi: 10.1101/gad.1706508. [DOI] [PMC free article] [PubMed] [Google Scholar]
- 44.Liu T, et al. Global investigation of the co-evolution of MIRNA genes and microRNA targets during soybean domestication. Plant J. 2016;85:396–409. doi: 10.1111/tpj.13113. [DOI] [PubMed] [Google Scholar]
- 45.Jones-Rhoades MW, Bartel DP. Computational identification of plant MicroRNAs and their targets, including a stress-induced miRNA. Mol. Cell. 2004;14:787–799. doi: 10.1016/j.molcel.2004.05.027. [DOI] [PubMed] [Google Scholar]
- 46.Rhoades MW, et al. Prediction of plant microRNA targets. Cell. 2002;110:513–520. doi: 10.1016/s0092-8674(02)00863-2. [DOI] [PubMed] [Google Scholar]
- 47.Hutvagner G, Zamore PD. A microRNA in a multiple-turnover RNAi enzyme complex. Science. 2002;297:2056–2060. doi: 10.1126/science.1073827. [DOI] [PubMed] [Google Scholar]
- 48.Traverse, A. Plant evolution dances to a different beat. Hist. Biol.1, 277–301 (2009).
- 49.Tilgner H, et al. Nucleosome positioning as a determinant of exon recognition. Nat. Struct. Mol. Biol. 2009;16:996–1001. doi: 10.1038/nsmb.1658. [DOI] [PubMed] [Google Scholar]
- 50.Goodsell DS, Dickerson RE. Bending and curvature calculations in B-DNA. Nucleic Acids Res. 1994;22:5497–5503. doi: 10.1093/nar/22.24.5497. [DOI] [PMC free article] [PubMed] [Google Scholar]
- 51.Alharbi BA, Alshammari TH, Felton NL, Zhurkin VB, Cui F. nuMap: a web platform for accurate prediction of nucleosome positioning. Genomics Proteom. Bioinform. 2014;12:249–253. doi: 10.1016/j.gpb.2014.08.001. [DOI] [PMC free article] [PubMed] [Google Scholar]
- 52.Satchwell SC, Drew HR, Travers AA. Sequence periodicities in chicken nucleosome core DNA. J. Mol. Biol. 1986;191:659–675. doi: 10.1016/0022-2836(86)90452-3. [DOI] [PubMed] [Google Scholar]
- 53.Segal E, et al. A genomic code for nucleosome positioning. Nature. 2006;442:772–778. doi: 10.1038/nature04979. [DOI] [PMC free article] [PubMed] [Google Scholar]
- 54.Steger DJ, Workman JL. Transcriptional analysis of purified histone acetyltransferase complexes. Methods. 1999;19:410–416. doi: 10.1006/meth.1999.0877. [DOI] [PubMed] [Google Scholar]
- 55.Ream JA, Lewis LK, Lewis KA. Rapid agarose gel electrophoretic mobility shift assay for quantitating protein: RNA interactions. Anal. Biochem. 2016;511:36–41. doi: 10.1016/j.ab.2016.07.027. [DOI] [PMC free article] [PubMed] [Google Scholar]
- 56.Dubochet J, Ducommun M, Zollinger M, Kellenberger E. A new preparation method for dark-field electron microscopy of biomacromolecules. J. Ultrastruct. Res. 1971;35:147–167. doi: 10.1016/s0022-5320(71)80148-x. [DOI] [PubMed] [Google Scholar]
- 57.Farahani RM, Rezaei-Lotfi S, Simonian M, Xaymardan M, Hunter N. Neural microvascular pericytes contribute to human adult neurogenesis. J. Comp. Neurol. 2019;527:780–796. doi: 10.1002/cne.24565. [DOI] [PubMed] [Google Scholar]
- 58.Zuker M. Mfold web server for nucleic acid folding and hybridization prediction. Nucleic Acids Res. 2003;31:3406–3415. doi: 10.1093/nar/gkg595. [DOI] [PMC free article] [PubMed] [Google Scholar]
- 59.Klur S, Toy K, Williams MP, Certa U. Evaluation of procedures for amplification of small-size samples for hybridization on microarrays. Genomics. 2004;83:508–517. doi: 10.1016/j.ygeno.2003.09.005. [DOI] [PubMed] [Google Scholar]
- 60.Villalva C, et al. Increased yield of PCR products by addition of T4 gene 32 protein to the SMART PCR cDNA synthesis system. Biotechniques. 2001;31(81–83):86. doi: 10.2144/01311st04. [DOI] [PubMed] [Google Scholar]
- 61.Mathelier A, et al. JASPAR 2016: a major expansion and update of the open-access database of transcription factor binding profiles. Nucleic Acids Res. 2016;44:D110–D115. doi: 10.1093/nar/gkv1176. [DOI] [PMC free article] [PubMed] [Google Scholar]
- 62.Shimazaki H, Shinomoto S. A method for selecting the bin size of a time histogram. Neural Comput. 2007;19:1503–1527. doi: 10.1162/neco.2007.19.6.1503. [DOI] [PubMed] [Google Scholar]
- 63.Hubley R, et al. The Dfam database of repetitive DNA families. Nucleic Acids Res. 2016;44:D81–D89. doi: 10.1093/nar/gkv1272. [DOI] [PMC free article] [PubMed] [Google Scholar]
- 64.Proctor JR, Meyer IM. COFOLD: an RNA secondary structure prediction method that takes co-transcriptional folding into account. Nucleic Acids Res. 2013;41:e102. doi: 10.1093/nar/gkt174. [DOI] [PMC free article] [PubMed] [Google Scholar]
- 65.Mathews DH, Sabina J, Zuker M, Turner DH. Expanded sequence dependence of thermodynamic parameters improves prediction of RNA secondary structure. J. Mol. Biol. 1999;288:911–940. doi: 10.1006/jmbi.1999.2700. [DOI] [PubMed] [Google Scholar]
- 66.Krzywinski M, et al. Circos: an information aesthetic for comparative genomics. Genome Res. 2009;19:1639–1645. doi: 10.1101/gr.092759.109. [DOI] [PMC free article] [PubMed] [Google Scholar]
- 67.Gao F, Zhang CT. GC-Profile: a web-based tool for visualizing and analyzing the variation of GC content in genomic sequences. Nucleic Acids Res. 2006;34:W686–W691. doi: 10.1093/nar/gkl040. [DOI] [PMC free article] [PubMed] [Google Scholar]
- 68.Zhang CT, Gao F, Zhang R. Segmentation algorithm for DNA sequences. Phys. Rev. E. 2005;72:041917. doi: 10.1103/PhysRevE.72.041917. [DOI] [PubMed] [Google Scholar]
- 69.Kruger J, Rehmsmeier M. RNAhybrid: microRNA target prediction easy, fast and flexible. Nucleic Acids Res. 2006;34:W451–W454. doi: 10.1093/nar/gkl243. [DOI] [PMC free article] [PubMed] [Google Scholar]
- 70.Jensen LJ, et al. STRING 8-a global view on proteins and their functional interactions in 630 organisms. Nucleic Acids Res. 2009;37:D412–D416. doi: 10.1093/nar/gkn760. [DOI] [PMC free article] [PubMed] [Google Scholar]
- 71.Gene Ontology C. Gene Ontology Consortium: going forward. Nucleic Acids Res. 2015;43:D1049–D1056. doi: 10.1093/nar/gku1179. [DOI] [PMC free article] [PubMed] [Google Scholar]
- 72.Kanehisa M, Furumichi M, Tanabe M, Sato Y, Morishima K. KEGG: new perspectives on genomes, pathways, diseases and drugs. Nucleic Acids Res. 2017;45:D353–D361. doi: 10.1093/nar/gkw1092. [DOI] [PMC free article] [PubMed] [Google Scholar]
- 73.Thomas PD, et al. PANTHER: a library of protein families and subfamilies indexed by function. Genome Res. 2003;13:2129–2141. doi: 10.1101/gr.772403. [DOI] [PMC free article] [PubMed] [Google Scholar]
- 74.Auerbach R, Kubai L, Knighton D, Folkman J. A simple procedure for the long-term cultivation of chicken embryos. Dev. Biol. 1974;41:391–394. doi: 10.1016/0012-1606(74)90316-9. [DOI] [PubMed] [Google Scholar]
- 75.Hamburger V, Hamilton HL. A series of normal stages in the development of the chick embryo. 1951. Dev. Dyn. 1992;195:231–272. doi: 10.1002/aja.1001950404. [DOI] [PubMed] [Google Scholar]
- 76.Alon U. Network motifs: theory and experimental approaches. Nat. Rev. Genet. 2007;8:450–461. doi: 10.1038/nrg2102. [DOI] [PubMed] [Google Scholar]
- 77.Mangan S, Alon U. Structure and function of the feed-forward loop network motif. Proc. Natl Acad. Sci. USA. 2003;100:11980–11985. doi: 10.1073/pnas.2133841100. [DOI] [PMC free article] [PubMed] [Google Scholar]
- 78.Quarton T, et al. Mapping the operational landscape of microRNAs in synthetic gene circuits. NPJ Syst. Biol. Appl. 2018;4:6. doi: 10.1038/s41540-017-0043-y. [DOI] [PMC free article] [PubMed] [Google Scholar]
Associated Data
This section collects any data citations, data availability statements, or supplementary materials included in this article.
Supplementary Materials
Data Availability Statement
The authors declare that all data generated or analysed during this study are included within the article and its Supplementary information files.


