Abstract
In this paper, the experimental design methodology was employed for modeling and optimizing the operational parameters of the photocatalytic degradation of a binary dye solution using a fixed photocatalytic compound. The compound used was modified graphite electrode (GE) with graphene oxide (GO) on which TiO2 nanoparticles were immobilized. GO nanoparticle was deposited on graphite electrode (GO-GE) using electrochemical approach. TiO2 nanoparticles were immobilized on GO-GE by solvent evaporation method. A binary solution containing mixture of methylene blue (MB) and acid red 14 (AR14) was chosen as dye model. The degradation intermediates were detected and analyzed using gas chromatography. Effect of different factors on the photocatalytic decolorization efficiency was investigated and optimized using response surface methodology (RSM). The obtained results indicated that the prepared TiO2-GO-CE can decolorize MB with high efficiency (93.43%) at pH 11, dye concentration of 10 mg/L and 0.04 g of immobilized TiO2 on the GO fabricated plates after 120 min of photocatalytic process. It was demonstrated that by modifying GE with GO the stability of the electrode was remarkably enhanced. The ANOVA results (R2 = 0.97 and P value <0.0001 for MB, R2 = 0.96 and P value <0.0001 for AR14) and numerical optimization showed that it is possible to make good prediction on decoloration behavior and save time and energy with less number of experiments using design of experiments (DoE) like the RSM.
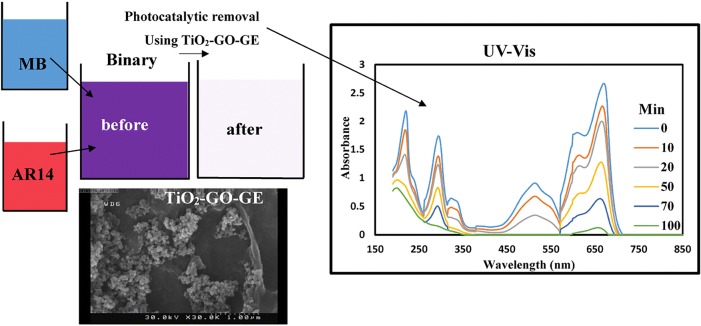
Graphical abstract Wastewater treatment process.
Wastewater treatment process
Keywords: Modified graphite electrode, Binary dye solution, RSM optimization, Wastewater, Photocatalytic dye degradation
Introduction
Nowadays, the pollution of groundwater resources is one of the most important global issues (1). The water streams can be contaminated by discharging of colored wastewaters from various industries such as textile, paper, food, printing, cosmetics, pharmaceutical, etc., which causes an eco-toxic dangerous situation and threat human health by causing allergies, tumors and cancers (2, 3). Consequently, it is necessary to remove dyes from wastewaters before releasing them into water streams.
Photocatalysis technique is one of the advanced oxidation processes (AOPs) that can degrade various organic pollutants especially dyes (4–6). Semiconductors are the most interested materials as photocatalysts due to their effectiveness in UV region. In this regard, TiO2 is a popular semiconductor material because of its outstanding features such as cheap price, abundance, biocompatibility, chemical stability, non-toxicity, high bandgap energy (3.2 eV for anatase) (7–9). In photocatalysis phenomenon, semiconductor produces an electron-hole pair which can migrate to the photocatalyst surface and participate in the oxidation-reduction reactions via producing free radicals (Eqs. 1–4) (10).
| 1 |
| 2 |
| 3 |
| 4 |
Separation and recycling of dispersed photocatalyst nanoparticles are costly, difficult and need extra time. Besides, the existence of these nanoparticles in solution may cause secondary pollution since complete recycling is impossible (11). Therefore, an efficient solution to overcome this problem is needed to immobilize the photocatalyst nanoparticles on suitable substrate by proper methods such as thermal treatment (12), membrane (13) and electro-spinning method (14).
To overcome shortcomings such as time-consuming of conventional and empirical methods RSM approach can be used. RSM is mathematical and statistical modeling approach which is used to examine the effect of independent working factors on the response and also is used to optimize the factors value with a low number of experiments to reach desirable responses (15). RSM uses a second order polynomial model to predict optimum condition to get best response (16).
A good selection of design and optimization model makes it possible to simultaneously evaluate the variables contribution (main and interaction) on photocatalytic process which in present study was obtained by experimental design (17, 18). In this study, a new and simple photocatalytic discoloration of binary system using immobilized TiO2 on graphene oxide (GO) substrate (GE-GO-TiO2) is reported. A real colored wastewater (industrial wastewater) usually consists of the mixture of dyes along with other additives such as salts, surfactants etc. (19). Thus, the removal of the mixture of dyes from industrial wastewater is too important. Performance of photocatalytic activity depends on the number of pollutants present in the solution and their concentration (20, 21). To date, the number of literature on adsorption processes for simultaneous dye and heavy metal ions removal from water in multicomponent systems is rather limited (22). To simulate real wastewater a binary system was chosen which was consisted of two different dyes with an anionic dye (AR 14) and a cationic dye (MB). The photocatalytic effect of the immobilized composite and effects of pH, initial dye concentration and photocatalyst dosage on binary discoloration efficiency were studied and optimized using RSM. ANOVA table and numerical optimization were performed to confirm validity of the model.
Material and method
Chemicals
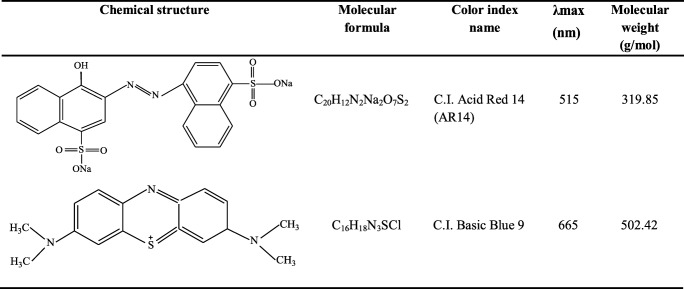
Graphite powder (purity >95%, length 10–20 μm and diameter 30–50 nm) was purchased from Seraj Co. Titania nanoparticle (Degussa P25) was used as the photocatalyst (average particle size: 30 nm, purity >97% with 80:20 anatase to rutile). A 9 watt UV lamp (Philips, 9 W (UV-c), Poland) was used as a light source and was jacketed with a Pyrex tube. The dyes were purchased from Ciba Co. and their information are shown in Table 1. The other chemicals were prepared from Merck Co.
Table 1.
Characteristics of treated dyes
Preparation of GO-GE-TiO2
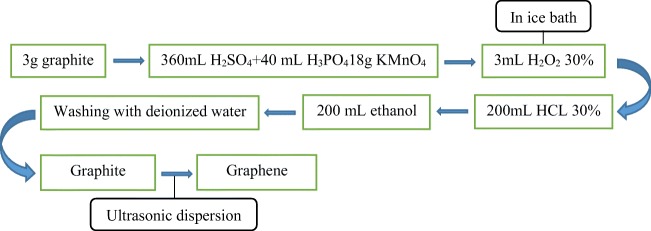
GO was synthesized by the modified Hummer’s method. The synthesis steps are schematically shown in Fig. 1. In brief, graphite powder (3 g) was added in a solution of H2SO4 (360 mL), H3PO4 (40 mL) and KMnO4 (18 g). Then, H2O2 (30%, 3 mL) was dispersed in the prepared solution at room temperature and filtered by a nylon filter. The solid material was washed with 200 mL HCL 30% and ethanol, respectively. The resulting solid was graphite oxide and in order to obtain graphene oxide, the solution was dispersed using ultrasonic bath for 1 h (23).
Fig. 1.
The synthesis of GO by modified Hummer’s method
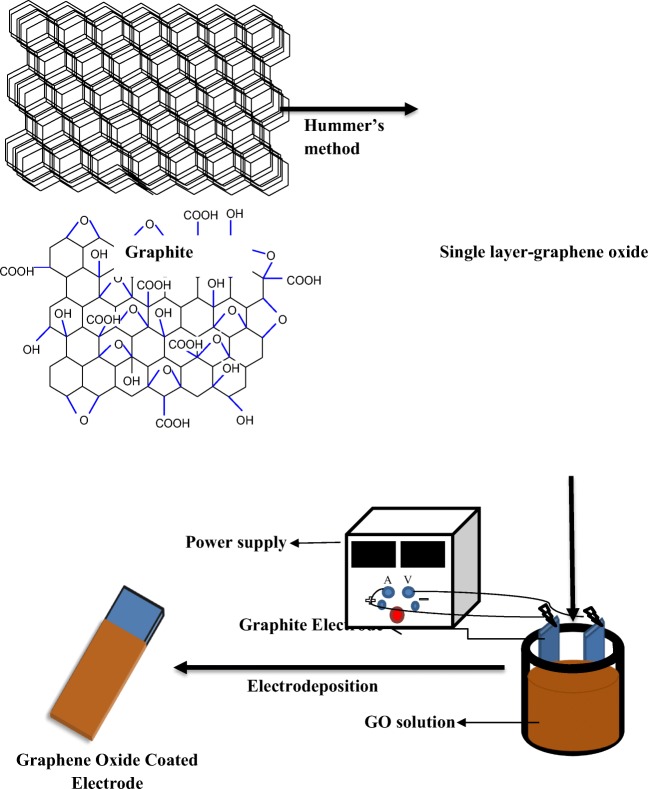
Fabrication of GO on graphite electrode (with the dimension of 3 × 50 × 110 mm3) was done with GO (0.2 g/L) and CTAB (1.3 g/L) dispersed in water using Delta D68H ultrasonic at room temperature. Direct current (DC) with the voltage of 25 V were applied by ESCORT power supply (3060 TD Dual Tracking, Taiwan) to the solution containing GO and CTAB for 20 min (Fig. 2). Dispersion with the cationic surfactant (CTAB), makes the GO sheets positively charged, which will move them toward the cathode in the deposition process.
Fig. 2.
Fabrication of graphite electrode by GO
In a typical experiment, TiO2 (0.005 g) nanoparticles were dispersed in 10 mL of distilled water. The solution was placed in ultrasonic instrument to form a homogeneous mixture. Then this mixture was poured gradually on the surface of GO fabricated electrodes which had been placed in an oven at 120 °C for 1 h. It can be described that a lasting physical bonding could take place between GO-GE and TiO2 nanoparticles.
Characterization techniques
The morphology of the synthesized GO, GO-GE and TiO2-GO-GE was studied using a field emission scanning electron microscope ((FESEM) JSM-6700F, JEOL, Japan)).
The Fourier transform infrared (FTIR) spectra of all materials were recorded by a Thermo Nicolet Avatar 360 FTIR Spectrometer in the 500–4000 cm−1 region with the resolution of 4 cm−1. X-ray diffraction (XRD) analysis was carried out by (EQuinox 3000) X-ray diffractometer using (Cu K∝) X-ray source (λ= 1.5418) the operating conditions (generator voltage 40 kV and generator current 30 mA) were in the scanning range from (10∘ to 110∘) at rate of (2°/min). Degradation products were analyzed using GC-MS (SHIMADZU QP2010 gas chromatography coupled with JEOL JMS-700 mass spectrometry). The carrier gas was helium and the flow rate of elute was 2.11 ml min−1. A capillary column Terra C-18 (5μm × 100 mm length) was used for separation of product intermediates.
Photocatalytic wastewater treatment
The photocatalytic reactions were carried out in a cylindrical glass batch (CGB) with the total volume of 500 mL which was placed in a dark chamber. Two TiO2-GO-GEs were fixed at the inner wall of CGB, 8 cm away from each other and each GO-GE was contained 0.01 g TiO2 nanoparticles. Aeration operation was exerted at the center bottom of the CGB using an air pump. The UV lamp was placed at the center top of the reactor. A starting solution containing initial dye concentrations of 10–50 mg.L−1 for both blue and red dyes were fed to the reactor chamber. Samples were collected at time intervals that will be discussed later in statistical studies. The initial dye concentration for both dyes were same in the binary system. The dye concentration of the dye was evaluated using Beer-Lambert law; absorbance of the dye solution is measured at maximum wavelength and the dye concentration can be calculated by the following equation:
| 6 |
Where, Aλi is the absorbance of the sample at maximum wavelength of sample, C is dye concentration in solution (mol L−1) and ελi is coefficient of molar attenuation (molar absorptivity (L mol−1 cm−1)).
For binary system, absorbance of the binary sample was measured at maximum wavelengths of blue and red dye separately using UNICO 2100 spectrophotometer. The dye concentration can be calculated using two sets of linear equations (Eq. 7), each of those corresponds to absorbance at maximum wavelengths for blue and red dyes.
| 7 |
Where, B and R lowercases are representative for blue and red dyes, and two wavelengths were indicated with prime uppercase.
The initial dye concentrations are known (C0) and the final dye concentrations at time t (Ct) were calculated using Eq. 7. The removal efficiency for each dye was measured by Eq.8 (24).
| 8 |
Statistical studies
In the present study the TiO2-GO-GE was used for binary dye solution photocatalytic treatment as a simulated real wastewater in a reactor which contains two different dyes (methylene blue (MB) and acid red 14 (AR14)). Response surface methodology (RSM) was used for evaluating and optimizing the photocatalytic activity of the immobilized TiO2. According to the earlier articles it has been reported that the pH of the solution, initial dye concentration, TiO2 loading and reaction time were the most significant water treatment factors. In this work these parameters were taken as independent variables at five levels which are shown in Table 2. Since the final goal of the water treatment process is the extent of decoloration, the dye removals (%) were considered as dependent variables. Design Expert 7.0 software were used for experiment design and statistical analysis.
Table 2.
Experimental Range and Levels of the Independent Variables
| variables | code | ranges and levels | ||||
|---|---|---|---|---|---|---|
| −2 | −1 | 0 | +1 | +2 | ||
| pH | A | 3 | 5 | 7 | 9 | 11 |
| initial dye concentration (mg/L) | B | 10 | 20 | 30 | 40 | 50 |
| TiO2 concentration(g/L) | C | 0.01 | 0.02 | 0.03 | 0.04 | 0.05 |
| time(min) | D | 40 | 50 | 60 | 70 | 80 |
Result and discussion
GO, GE-GO and GE-GO-TiO2 characterization
FT-IR spectra of GO and graphite is shown in Fig. 3a. The spectrum of graphite showed a main peak at 1623 cm-1 and 3400 cm-1 which are due to C=C and OH, respectively.in case of GO, the presence of bands at 1732 cm−1 (C=O stretching), 1397 cm−1 (C-OH stretching), 1223 cm−1 (C-O-C (epoxy)) and 1627 cm−1 (C=C stretching) clearly proved the presence of oxygenated groups which suggested synthesis of GO (25). In addition, broad peak 2400–3600 cm−1 is because of formation of carboxylic acid (COOH) on graphite surface which cannot be seen on graphite or graphene surface.
Fig. 3.
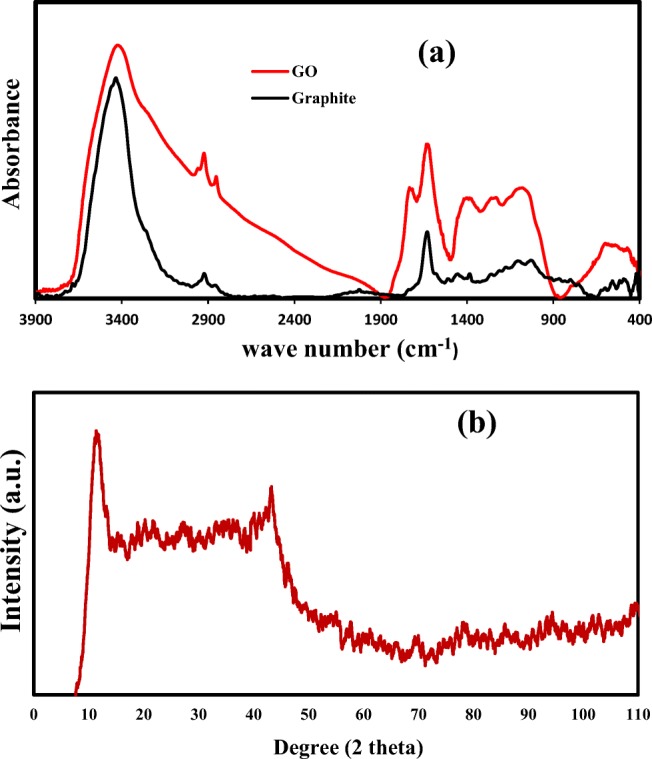
Characterization of GO: a FTIR, and b XRD
The results of XRD test are shown in Fig. 3b. The peak existed at 2θ = 11.8∘ (d-spacing = 7.8 Å with plane of (002) indicated formation of GO sheets (26). The peak at 2θ = 43.3may be due to the turbostatic band of the disordered carbon materials (27).
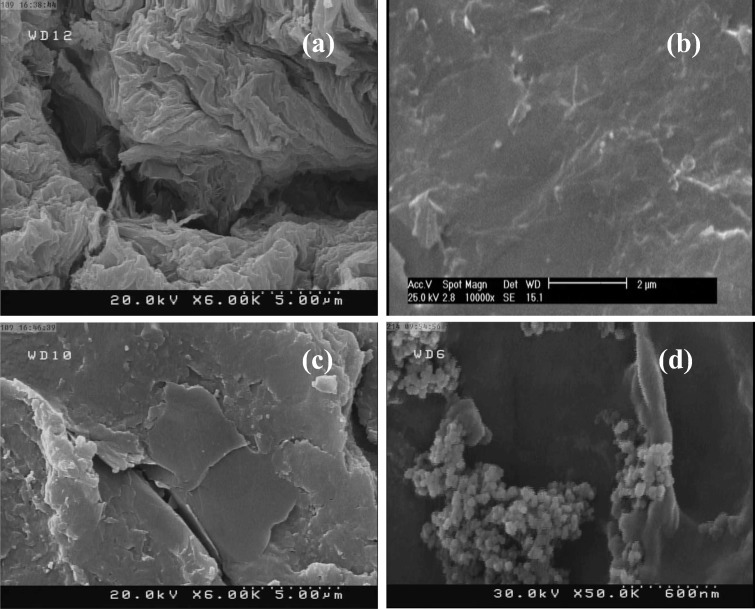
Figure 4 exhibits the morphology of GO powder (a), polished graphite electrode surface (b), GOGE (c), and TiO2–GO-GE (d). The FESEM images display that the GO sheets are stacked together. Moreover, it is indicated that TiO2 nanoparticles are attached to bare and modified electrode surface.
Fig. 4.
FESEM images of GO powder (a), polished graphite electrode surface (b), GO-GE (c), and TiO2–GO-GE (d)
Water treatment statistical analysis
Design Expert 7.0 suggested 30 sets of random experiments using central composite design (CCD) algorithm which are shown in Table 3. Moreover, the final dye removal for each dye as calculated using the equations given in the experimental section and a summary of them are reported in Table 3.
Table 3.
Design of experiment suggested by CCD algorithm and final removal of blue and red dyes
| Run | independent variable | dependent variable | ||||
|---|---|---|---|---|---|---|
| A | B | C | D | AR14 removal (%) | MB Removal (%) | |
| 1 | 0 | −2 | 0 | 0 | 72.78 | 74.02 |
| 2 | 0 | 0 | 0 | 0 | 55.85 | 32.57 |
| 3 | 1 | −1 | −1 | −1 | 49.72 | 55.74 |
| 4 | −1 | −1 | −1 | −1 | 45.66 | 30.78 |
| 5 | 2 | 0 | 0 | 0 | 81.89 | 54.27 |
| 6 | −1 | −1 | 1 | −1 | 72.02 | 32.33 |
| 7 | 0 | 0 | 2 | 0 | 61.35 | 45.37 |
| 8 | 1 | −1 | 1 | −1 | 60.68 | 67.24 |
| 9 | 0 | 0 | 0 | −2 | 40.48 | 27.11 |
| 10 | 0 | 0 | 0 | 0 | 54.96 | 33.62 |
| 11 | 0 | 0 | 0 | 2 | 57.01 | 39.78 |
| 12 | −1 | 1 | −1 | −1 | 50.00 | 17.45 |
| 13 | −1 | −1 | 1 | 1 | 79.44 | 41.62 |
| 14 | 0 | 2 | 0 | 0 | 49.79 | 27.32 |
| 15 | 0 | 0 | −2 | 0 | 41.75 | 31.64 |
| 16 | 1 | 1 | 1 | −1 | 51.86 | 27.59 |
| 17 | −1 | 1 | 1 | 1 | 57.34 | 18.77 |
| 18 | −1 | −1 | −1 | 1 | 54.13 | 40.61 |
| 19 | 0 | 0 | 0 | 0 | 55.23 | 32.45 |
| 20 | 0 | 0 | 0 | 0 | 56.09 | 34.18 |
| 21 | 0 | 0 | 0 | 0 | 55.12 | 31.89 |
| 22 | 1 | 1 | 1 | 1 | 59.00 | 36.13 |
| 23 | −2 | 0 | 0 | 0 | 70.27 | 25.89 |
| 24 | 0 | 0 | 0 | 0 | 54.42 | 37.29 |
| 25 | −1 | 1 | 1 | −1 | 54.63 | 15.86 |
| 26 | 1 | 1 | −1 | 1 | 56.44 | 29.59 |
| 27 | 1 | 1 | −1 | −1 | 47.32 | 29.38 |
| 28 | 1 | −1 | 1 | 1 | 76.97 | 78.52 |
| 29 | 1 | −1 | −1 | 1 | 68.01 | 72.01 |
| 30 | −1 | 1 | −1 | 1 | 51.56 | 19.87 |
Two sets of second order polynomial equations by Design Expert 7.0 based on the theory of multiple regression analysis. These models predict the final dye removal according to the experimental results (28), which are shown in Eq. 9 and 10.
| 9 |
| 10 |
The analysis of variance (ANOVA) and R2 (coefficient of regression) were also reported to analyze significance and adequacy of the models. According to low P values (P < 0.05), the models can sufficiently predict the experimental data. Also, high R2 values shows great fitness of proposed models with experiment results (29–31).
Regarding Tables 4 and 5 it can be seen that all corresponding factors significantly affected the photocatalytic degradation of both red and blue dyes in binary solution at 95% confidence level (31, 32).
Table 4.
ANOVA for MB removal Response Surface Quadratic Model
| Source | df | Mean square | F-values | P value | R2 |
|---|---|---|---|---|---|
| A | 1 | 2315.949 | 158.4084 | < 0.0001 | – |
| B | 1 | 4205.554 | 287.6554 | < 0.0001 | – |
| C | 1 | 104.918 | 7.17628 | 0.0172 | – |
| D | 1 | 308.1667 | 21.07827 | 0.0004 | – |
| AB | 1 | 373.8422 | 25.57041 | 0.0001 | – |
| AC | 1 | 32.49 | 2.222281 | 0.1568 | – |
| AD | 1 | 8.910225 | 0.60945 | 0.4471 | – |
| BC | 1 | 21.20602 | 1.450469 | 0.2471 | – |
| BD | 1 | 66.7489 | 4.565554 | 0.0495 | – |
| CD | 1 | 0.714025 | 0.048839 | 0.8281 | – |
| A2 | 1 | 40.40747 | 2.763828 | 0.1172 | – |
| B2 | 1 | 408.9395 | 27.97102 | < 0.0001 | – |
| C2 | 1 | 18.44297 | 1.26148 | 0.2790 | – |
| D2 | 1 | 5.431543 | 0.371512 | 0.5513 | – |
| Model | 14 | 563.9673 | 38.57476 | < 0.0001 | 97% |
Table 5.
ANOVA for AR14 removal Response Surface Quadratic Model
| Source | df | Mean square | F-values | P value | R2 |
|---|---|---|---|---|---|
| A | 1 | 33.74882 | 4.856967 | 0.0436 | – |
| B | 1 | 645.4288 | 92.88701 | < 0.0001 | – |
| C | 1 | 685.8704 | 98.70717 | < 0.0001 | – |
| D | 1 | 451.1868 | 64.93264 | < 0.0001 | – |
| AB | 1 | 0.5776 | 0.083125 | 0.7771 | – |
| AC | 1 | 76.82523 | 11.05632 | 0.0046 | – |
| AD | 1 | 58.8289 | 8.466373 | 0.0108 | – |
| BC | 1 | 182.7904 | 26.30632 | 0.0001 | – |
| BD | 1 | 56.02523 | 8.062881 | 0.0124 | – |
| CD | 1 | 0.9409 | 0.13541 | 0.7180 | – |
| A2 | 1 | 695.4054 | 100.0794 | < 0.0001 | – |
| B2 | 1 | 48.99074 | 7.050512 | 0.0180 | – |
| C2 | 1 | 33.02534 | 4.752849 | 0.0456 | – |
| D2 | 1 | 88.72463 | 12.76882 | 0.0028 | – |
| Model | 14 | 226.0047 | 32.52552 | < 0.0001 | 96% |
Effect of independent variables on dye removal
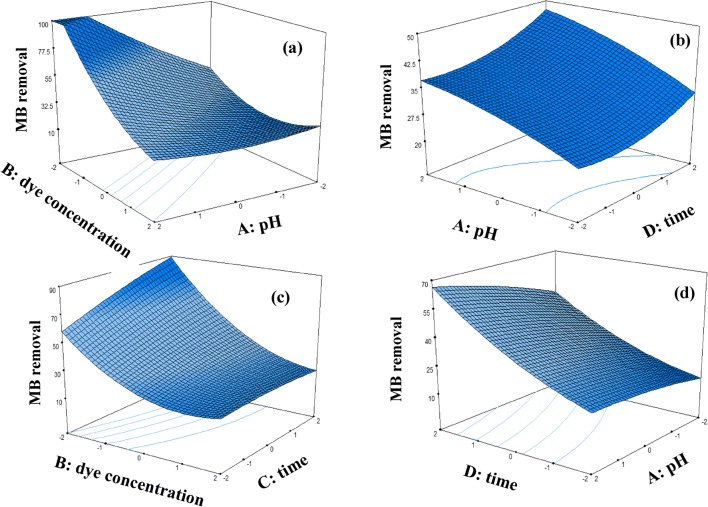
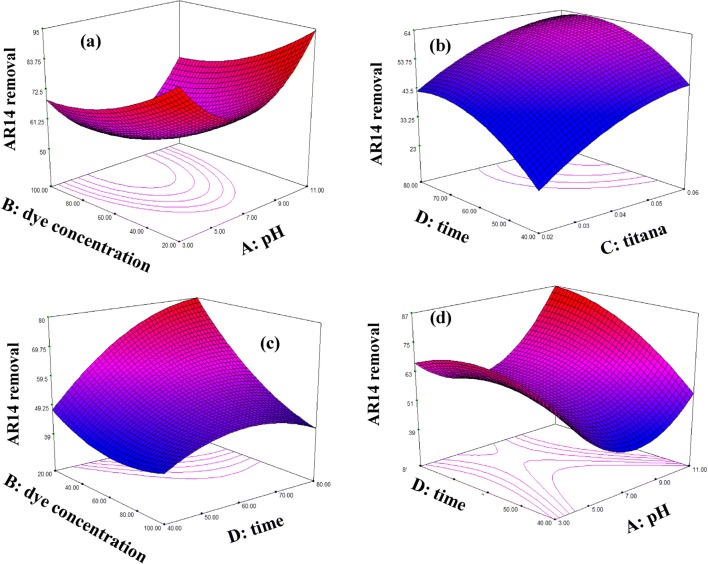
Figure 5 and 6 report the relationship between the independent variables (A, B and C) and the response (MB and AR14 removal) using the 3-D surface plots. Each plot shows simultaneous effect of two factors on dye removal while two other factors are kept constant in zero level (coded level). As shown in the Fig. 6a with increase in pH and decrease in dye concentration, dye removal (%) increase so that it is upper than 100% in level (−2) for dye concentration and level (+2) for pH. This is due to the fact that with increase in pH from 3 to 11 the amount of anionic surface charges of GO sheets increases because of the existence of OH¯ in the solution which results in more binding sites on the surface of GO-GE plates. As a result, cationic dye molecules will be adsorbed on GO sheets surface by electrostatic attractions. Therefore, in alkaline pH both GO sheets surface and TiO2 nanoparticles are negatively charged, which cause an intense photocatalytic activity due to the adsorption of cationic dye molecules (MB) on the photocatalyst surface, which leads to efficient degradation of MB. In case of AR14 with increasing pH from 3 to 7, dye degradation efficiency decreases. But with increasing pH from 9 to 11, dye degradation increase as seen in Fig. 5a. At neutral pH, lowest adsorption of the dye on positively charged nano TiO2 occurs. With increasing pH the adsorption of anionic dye molecules on the surface of the electrodes decreases. Same results are achieved in noor mohammadi et al. in 2018. They found that in pH 9 and 11 maximum MB removal is achieved due to maximum electrostatic attraction forces between the positively charged MB dye molecules and negative catalyst (2). However, when the pH of the dye solution is acidic the repulsion between negatively charged AR 14 and the negatively charged of the GO decreases. Therefore, adsorption of the dye on the TiO2 and surface of the graphene oxide is increased and this will cause increasing the dye degradation. But at higher pH (higher than 7) increase in the removal could be due to conversion of OH−to OH•in the presence of UV photons (33).
Fig. 5.
3D plots for the removal of MB binary solutions
Fig. 6.
3D plots for the removal of AR14 from binary solutions
As seen in Fig. 5b and efficiency of MB removal increase with increase in pH. In Figs. 5d and 6d it can be seen that for all dye concentration, dye removal (%) increased by increasing the TiO2 concentration. This phenomenon may be explained as follows with an increase in the semiconductor concentration, the amount of site density for the surface electrons-holes, and oxidizing species increases, which leads to the higher decolorization efficiency (34). In some cases it is reported that catalyst loading has an optimum point. For example, bansal et al. found that to reach maximum dye removal, optimum value of 1 g L − 1 for ZnO and 1.5 g L − 1 for TiO2 is needed. They showed that addition of more catalyst lead to decrease in dye removal efficiency. It is because of aggregation phenomena which leads to decrease in active sites (35). In this study, no optimum value was not observed due to no aggregation in the chosen TiO2 loading range.
Figures 5c and 6c show that increasing time and dye concentration result in more dye degradation. With increase in MB and AR14 concentrations, the capability of photon access through the dye molecules to reach the catalyst surface or its vicinity decreases. But, at lower concentrations more photons strike on catalyst surface, which results in higher degradation efficiency by the generation of more hydroxyl radicals (OH•) which attack the dye molecules. Ilinoiu et al. showed that by increasing dye concentration form 25 mg/L to 100 mg/L, removal percentage was decreased from 90 to 50. They inferred that this is because of two main reason. First, high concentration of the dye affects negatively the UV light penetrability in the dye solution. Second, the dye molecules may absorb a significant amount of light required for the catalyst surface irradiation, which diminishes the catalytic activity (36).
Numerical optimization (Design Expert software) was employed to determine optimal conditions for maximum MB and AR14 decolorization. This makes it possible to realize the validity of the model for good predicting of dye degradation (37). The optimum values which were suggested for desirable MB removal (84.51%) and AR14 removal (83.55%) are given in Table 6. Capability of the model for simulating of MB and AR14 removal was examined experimentally and found to be in good agreement with the proposed values ((Table 6) 86.74% for MB and 82.48% for AR14)).
Table 6.
Optimum Value for the Process Parameters
| variables | optimum value | MB degradation (%) | AR14 degradation (%) | ||
|---|---|---|---|---|---|
| predictive | experimental | predictive | experimental | ||
| A | 10 | ||||
| B | 40 | 85.51 | 86.74 | 83.55 | 82.48 |
| C | 0.03 | ||||
| D | 67 | ||||
Stability of GE-TiO2 and GE-GO-TiO2
In order to determine stability and reusability of immobilized GO-GE-TiO2 and important role of GO, a repetitive test with working condition was carried out in binary system. The tests were performed with dye concentration of 50 mg/L, TiO2 content of 0.02 g/L and pH = 7 at 120 min in presence of UV light. The results which are shown in Fig. 7a indicate that when immobilized GO-GE-TiO2 used in decolorization process, the MB removals in 11 trials were almost the same. But, when synthesized GO sheets were not used in the electrode bed (GE-TiO2), the MB removals in 6 trials were almost the same but after that the removals reduced. This results show that GO has important effect in photocatalyst system stability. It can be described that a physical bonding could occur between GO-GE and TiO2 nanoparticles. In addition, high temperature in the Immobilization step of TiO2 on GO-GE, may also help for a proper and lasting physical bonding and makes nanoparticles anchored properly with GO. In addition, there is an increase in MB removal when GO was used as bed in comparison with GE-TiO2. The increase in dye removal can be due to dye adsorption of dye on the GO surface. Because of the two positive points (stability and adsorption), GO can improve photocatalytic removal of dyes.
Fig. 7.
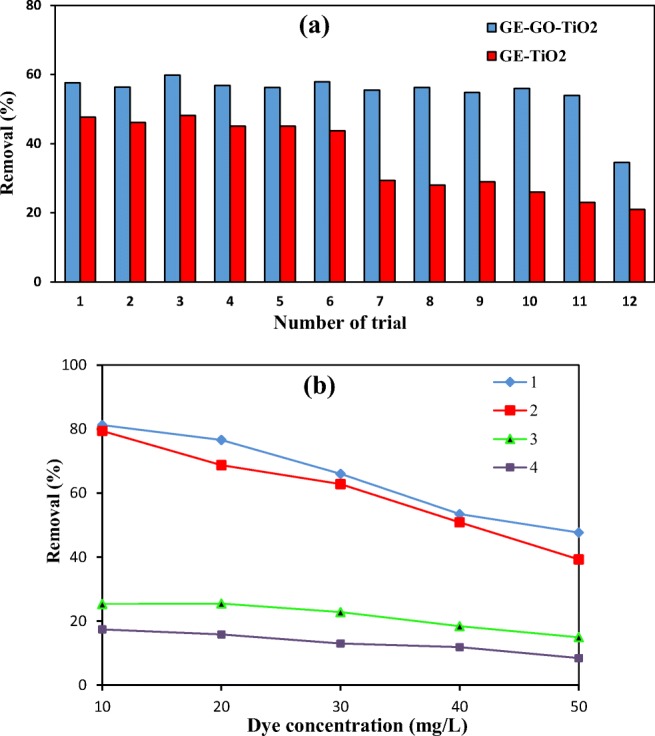
a Effect of modification and electrode on photocatalyst stability, b difference between adsorption and photocatalytic performance of TiO2-GO-GE in various dye concentrations. (1): Photocatalytic activity of TiO2-GO-GE on AR 14 removal. (2): Photocatalytic activity of TiO2-GO-GE on MB removal. (3): Adsorption value of MB removal using TiO2-GO-GE. (4): Adsorption value of AR 14 removal using TiO2-GO-GE
Figure 7b shows the deference between photocatalytic removal and adsorption values of dyes using TiO2-GO-GE. The experiments were performed with given conditions in above with various concentration of AR 14 and MB binary solution (10, 20, 30, 40 and 50 mg/L). The deference in removal percentage between photocatalytic and adsorption process for each dye can be indicative of degradation extent.
Determination of the photocatalytic oxidation intermediates
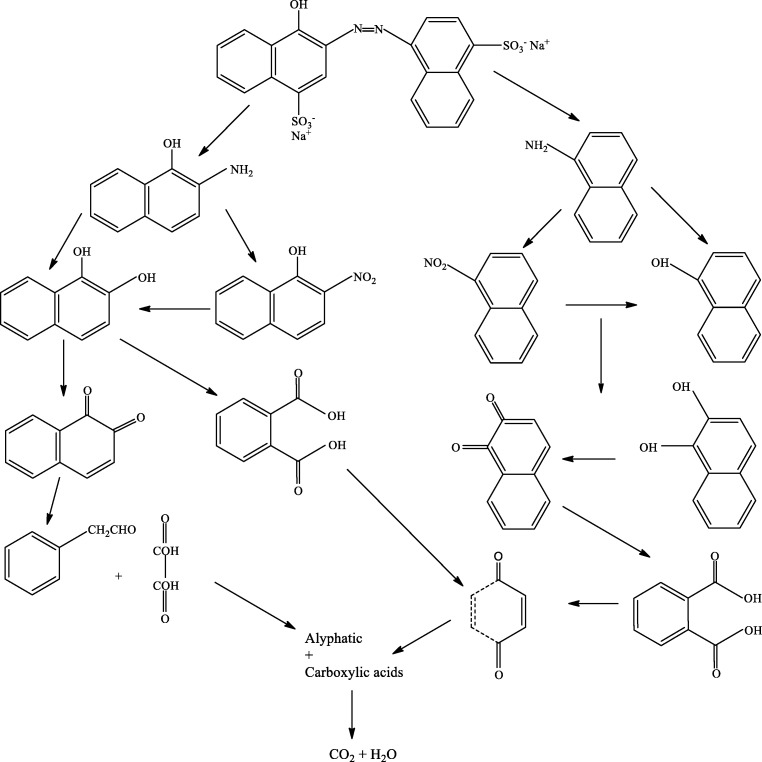
Figure 8 and 9 summarize the oxidation pathway of MB and AR14 based on the detection of by-products from GC-MS analysis. Sites with a high electron density are more available for attacking by hydroxyl radicals. Dye degradation is initiated byOH•attack. The attack of OH•radical as first step of photocatalyst induced process is well established (38). As shown in Fig. 8 C-S (SO3H) and –N=N- bonds are initially broken at initiation of photocatalytic degradation. In the following, -N=N- convert to –NH2 and –NO2. Among various intermediates and oxidative products, the aromatic products as naphthylamine, nitronaphthyl and naphthol compounds were commonly detected as the major oxidative products. It was found from Fig. 8 that the breakage of benzene and naphthalene ring formed some intermediates of formic acid, oxalic acid, acetic acid and carboxylic acids. The intermediates finally can be converted to H2O and CO2.
Fig. 8.
Proposed degradation products of AR 14
Fig. 9.
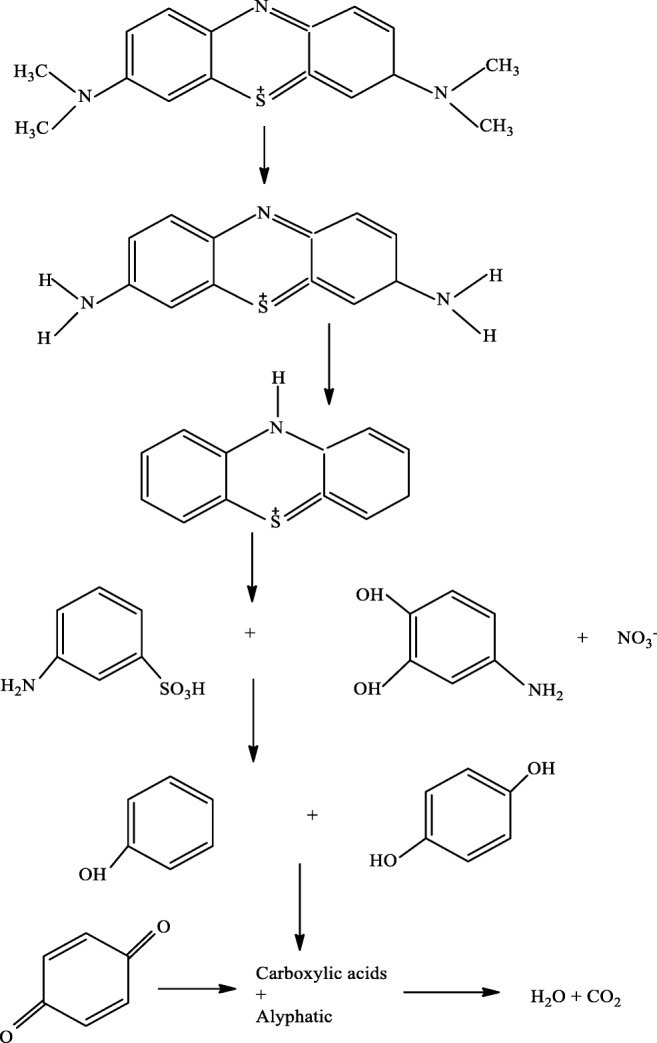
Proposed degradation of MB
Dealkylation of dyes containing alkylamine groups is an important step to fade the color of the dyes. Demethylation of MB occurs as showed in the Fig. 9. N-C and S-C are the most active bonds of thionin molecule and are further broken down (ring opening) (39), and finally MB converts into H2O, CO2, and other inorganic molecules.
Conclusion
In the present study, the photocatalytic discoloration of MB and AR14 dye molecules simultaneously was investigated by the immobilized TiO2 nanoparticles on electrode. The immobilized TiO2 nanoparticles were used in a photocatalytic batch reactor and the important parameters including pH, initial dye concentration and TiO2 dosage was studied. The plates containing photocatalyst particles were successfully used to decolorize mixture of dyes with the advantage of no further separation and recycling of the used photocatalyst nanoparticles. The stability test showed that synthesized GO has important role in stability of fixed TiO2 nanoparticles. The effect of working factors on responses were examined and optimized using response surface methodology. A quadratic model and 3-dimansion plots was obtained to predict relationship between independent coded variables and MB and AR14 removal (%). The results (R2 = 0.97 and P value <0.0001 for MB, R2 = 0.96 and P value <0.0001 for AR14) and numerical optimization suggest that the model was adequate to predict binary dye solution degradation. Numerical optimization indicate that to reach optimum removal for AR14 (90.92%) and MB (84.53%) the adequate conditions should be pH = 10, initial dye concentration = 40 mg/L and TiO2 dosage = 0.03 g/L at 67 min.
Acknowledgements
The author thank to Amirkabir University of Technology for all the supports throughout this study.
Compliance with ethical standards
Conflict of interest
There is not any conflict of interest in this manuscript.
Footnotes
Highlights
• Photocatalytic degradation of binary dye solution using TiO2-GO-GE.
• Binary solution was consist of two different dyes including AR14 and MB.
• RSM was used to examine effect of independent factors on dye removal as response.
• The degradation intermediates were detected and analyzed using gas chromatography method.
• Stability and adsorption tests were employed to enhance photocalytic degradation of MB using GO.
Publisher’s note
Springer Nature remains neutral with regard to jurisdictional claims in published maps and institutional affiliations.
References
- 1.Hey T, Bajraktari N, Vogel J, Hélix Nielsen C, la Cour JJ, Jönsson K. The effects of physicochemical wastewater treatment operations on forward osmosis. Environ Technol. 2017;38(17):2130–2142. doi: 10.1080/09593330.2016.1246616. [DOI] [PubMed] [Google Scholar]
- 2.Mohammadi NN, Pajootan E, Bahrami H, Arami M. Magnetization of TiO2 nanofibrous spheres by one-step ultrasonic-assisted electrochemical technique. J Mol Liq. 2018;265:251–259. doi: 10.1016/j.molliq.2018.04.067. [DOI] [Google Scholar]
- 3.Pan Y, Wang J, Sun C, Liu X, Zhang H. Fabrication of highly hydrophobic organic–inorganic hybrid magnetic polysulfone microcapsules: a lab-scale feasibility study for removal of oil and organic dyes from environmental aqueous samples. J Hazard Mater. 2016;309:65–76. doi: 10.1016/j.jhazmat.2016.02.004. [DOI] [PubMed] [Google Scholar]
- 4.Khue DN, Lam TD, Van Chat N, Bach VQ, Minh DB, Loi VD, et al. Simultaneous degradation of 2,4,6-trinitrophenyl-N-methylnitramine (Tetryl) and hexahydro-1,3,5-trinitro-1,3,5 triazine (RDX) in polluted wastewater using some advanced oxidation processes. J Ind Eng Chem. 2014;20(4):1468–1475. doi: 10.1016/j.jiec.2013.07.033. [DOI] [Google Scholar]
- 5.Lin W-C, Yang W-D, Jheng S-Y. Photocatalytic degradation of dyes in water using porous nanocrystalline titanium dioxide. J Taiwan Inst Chem Eng. 2012;43(2):269–274. doi: 10.1016/j.jtice.2011.10.010. [DOI] [Google Scholar]
- 6.Shu Z, Singh A, Klamerth N, McPhedran K, Bolton JR, Belosevic M, et al. Pilot-scale UV/H2O2 advanced oxidation process for municipal reuse water: Assessing micropollutant degradation and estrogenic impacts on goldfish (Carassius auratus L.) Water Res. 2016;101:157–166. doi: 10.1016/j.watres.2016.05.079. [DOI] [PubMed] [Google Scholar]
- 7.Zhu C, Wang L, Kong L, Yang X, Wang L, Zheng S, Chen F, MaiZhi F, Zong H. Photocatalytic degradation of AZO dyes by supported TiO 2+ UV in aqueous solution. Chemosphere. 2000;41(3):303–309. doi: 10.1016/S0045-6535(99)00487-7. [DOI] [PubMed] [Google Scholar]
- 8.Kuvarega AT, Krause RW, Mamba BB. Nitrogen/palladium-codoped TiO2 for efficient visible light photocatalytic dye degradation. J Phys Chem C. 2011;115(45):22110–22120. doi: 10.1021/jp203754j. [DOI] [Google Scholar]
- 9.Gar Alalm M, Tawfik A, Ookawara S. Enhancement of photocatalytic activity of TiO2 by immobilization on activated carbon for degradation of pharmaceuticals. Journal of Environmental Chemical Engineering. 2016;4(2):1929–1937. doi: 10.1016/j.jece.2016.03.023. [DOI] [Google Scholar]
- 10.Rauf M, Meetani M, Hisaindee S. An overview on the photocatalytic degradation of azo dyes in the presence of TiO 2 doped with selective transition metals. Desalination. 2011;276(1):13–27. doi: 10.1016/j.desal.2011.03.071. [DOI] [Google Scholar]
- 11.Shoabargh S, Karimi A, Dehghan G, Khataee A. A hybrid photocatalytic and enzymatic process using glucose oxidase immobilized on TiO 2/polyurethane for removal of a dye. J Ind Eng Chem. 2014;20(5):3150–3156. doi: 10.1016/j.jiec.2013.11.058. [DOI] [Google Scholar]
- 12.Gelover S, Mondragón P, Jiménez A. Titanium dioxide sol–gel deposited over glass and its application as a photocatalyst for water decontamination. J Photochem Photobiol A Chem. 2004;165(1):241–246. doi: 10.1016/j.jphotochem.2004.03.023. [DOI] [Google Scholar]
- 13.Zhang X, Du AJ, Lee P, Sun DD, Leckie JO. TiO2 nanowire membrane for concurrent filtration and photocatalytic oxidation of humic acid in water. J Membr Sci. 2008;313(1–2):44–51. doi: 10.1016/j.memsci.2007.12.045. [DOI] [Google Scholar]
- 14.Maeng SK, Cho K, Jeong B, Lee J, Lee Y, Lee C, Choi KJ, Hong SW. Substrate-immobilized electrospun TiO2 nanofibers for photocatalytic degradation of pharmaceuticals: the effects of pH and dissolved organic matter characteristics. Water Res. 2015;86:25–34. doi: 10.1016/j.watres.2015.05.032. [DOI] [PubMed] [Google Scholar]
- 15.Xia M, Ye C, Pi K, Liu D, Gerson AR. Cr(III) removal from simulated solution using hydrous magnesium oxide coated Fly ash: optimization by response surface methodology (RSM). Chin J Chem Eng.
- 16.Hivechi A, Bahrami SH, Gholami AA. Cellulose fabric with enhanced water absorbance and permeability using microwave radiation: modeling and optimization by RSM. The journal of the Textile Institute. 2019;110(1):117–123. doi: 10.1080/00405000.2018.1469213. [DOI] [Google Scholar]
- 17.Nieto-Sanchez AJ, Olivares-Marin M, Garcia S, Pevida C, Cuerda-Correa EM. Influence of the operation conditions on CO 2 capture by CaO-derived sorbents prepared from synthetic CaCO 3. Chemosphere. 2013;93(9):2148–2158. doi: 10.1016/j.chemosphere.2013.07.069. [DOI] [PubMed] [Google Scholar]
- 18.Zinatizadeh AAL, Mohamed AR, Abdullah AZ, Mashitah MD, Hasnain Isa M, Najafpour GD. Process modeling and analysis of palm oil mill effluent treatment in an up-flow anaerobic sludge fixed film bioreactor using response surface methodology (RSM) Water Res. 2006;40(17):3193–3208. doi: 10.1016/j.watres.2006.07.005. [DOI] [PubMed] [Google Scholar]
- 19.Huang W, Xu J, Lu D, Deng J, Shi G, Zhou T. Rational design of magnetic infinite coordination polymer core-shell nanoparticles as recyclable adsorbents for selective removal of anionic dyes from colored wastewater. Appl Surf Sci. 2018;462:453–465. doi: 10.1016/j.apsusc.2018.08.122. [DOI] [Google Scholar]
- 20.Mazaheri H, Ghaedi M, Asfaram A, Hajati S. Performance of CuS nanoparticle loaded on activated carbon in the adsorption of methylene blue and bromophenol blue dyes in binary aqueous solutions: using ultrasound power and optimization by central composite design. J Mol Liq. 2016;219:667–676. doi: 10.1016/j.molliq.2016.03.050. [DOI] [Google Scholar]
- 21.Tripathy S, Dash S. Solvation studies of some tailor made α-N,N-dimethylaminostyryl-N-alkyl pyridinium dyes in binary solvent mixtures containing alcohols, hexane, 1,4-dioxane, DCM and acetone. J Mol Liq. 2015;206:29–38. doi: 10.1016/j.molliq.2015.01.046. [DOI] [Google Scholar]
- 22.Fernandez M, Nunell G, Bonelli P, Cukierman A. Batch and dynamic biosorption of basic dyes from binary solutions by alkaline-treated cypress cone chips. Bioresour Technol. 2012;106:55–62. doi: 10.1016/j.biortech.2011.12.003. [DOI] [PubMed] [Google Scholar]
- 23.Ikhsan NI, Rameshkumar P, Pandikumar A, Shahid MM, Huang NM, Kumar SV, et al. Facile synthesis of graphene oxide–silver nanocomposite and its modified electrode for enhanced electrochemical detection of nitrite ions. Talanta. 2015;144:908–914. doi: 10.1016/j.talanta.2015.07.050. [DOI] [PubMed] [Google Scholar]
- 24.Dasgupta J, Singh M, Sikder J, Padarthi V, Chakraborty S, Curcio S. Response surface-optimized removal of reactive red 120 dye from its aqueous solutions using polyethyleneimine enhanced ultrafiltration. Ecotoxicol Environ Saf. 2015;121:271–278. doi: 10.1016/j.ecoenv.2014.12.041. [DOI] [PubMed] [Google Scholar]
- 25.Cong Y, Long M, Cui Z, Li X, Dong Z, Yuan G, et al. Anchoring a uniform TiO 2 layer on graphene oxide sheets as an efficient visible light photocatalyst. Appl Surf Sci. 2013;282:400–407. doi: 10.1016/j.apsusc.2013.05.143. [DOI] [Google Scholar]
- 26.Sun H, Liu S, Zhou G, Ang HM, Tadé MO, Wang S. Reduced graphene oxide for catalytic oxidation of aqueous organic pollutants. ACS Appl Mater Interfaces. 2012;4(10):5466–5471. doi: 10.1021/am301372d. [DOI] [PubMed] [Google Scholar]
- 27.Nagarjuna R, Challagulla S, Alla N, Ganesan R, Roy S. Synthesis and characterization of reduced-graphene oxide/TiO2/zeolite-4A: a bifunctional nanocomposite for abatement of methylene blue. Mater Des. 2015;86:621–626. doi: 10.1016/j.matdes.2015.07.116. [DOI] [Google Scholar]
- 28.Oladipo AA, Gazi M. Nickel removal from aqueous solutions by alginate-based composite beads: central composite design and artificial neural network modeling. Journal of Water Process Engineering. 2015;8:e81–e91. doi: 10.1016/j.jwpe.2014.12.002. [DOI] [Google Scholar]
- 29.Podstawczyk D, Witek-Krowiak A, Dawiec A, Bhatnagar A. Biosorption of copper (II) ions by flax meal: empirical modeling and process optimization by response surface methodology (RSM) and artificial neural network (ANN) simulation. Ecol Eng. 2015;83:364–379. doi: 10.1016/j.ecoleng.2015.07.004. [DOI] [Google Scholar]
- 30.Wu J, Zhang H, Oturan N, Wang Y, Chen L, Oturan MA. Application of response surface methodology to the removal of the antibiotic tetracycline by electrochemical process using carbon-felt cathode and DSA (Ti/RuO 2–IrO 2) anode. Chemosphere. 2012;87(6):614–620. doi: 10.1016/j.chemosphere.2012.01.036. [DOI] [PubMed] [Google Scholar]
- 31.Vaez M, Zarringhalam Moghaddam A, Alijani S. Optimization and modeling of photocatalytic degradation of azo dye using a response surface methodology (RSM) based on the central composite design with immobilized titania nanoparticles. Ind Eng Chem Res. 2012;51(11):4199–4207. doi: 10.1021/ie202809w. [DOI] [Google Scholar]
- 32.Srinu Naik S, Pydi SY. Optimization of parameters using response surface methodology and genetic algorithm for biological denitrification of wastewater. Int J Environ Sci Technol. 2014;11(3):823–830. doi: 10.1007/s13762-013-0266-4. [DOI] [Google Scholar]
- 33.Akerdi AG, Bahrami SH, Arami M, Pajootan E. Photocatalytic discoloration of acid red 14 aqueous solution using titania nanoparticles immobilized on graphene oxide fabricated plate. Chemosphere. 2016;159:293–299. doi: 10.1016/j.chemosphere.2016.06.020. [DOI] [PubMed] [Google Scholar]
- 34.Xu C, Rangaiah GP, Zhao XS. Photocatalytic degradation of methylene blue by titanium dioxide: experimental and modeling study. Ind Eng Chem Res. 2014;53(38):14641–14649. doi: 10.1021/ie502367x. [DOI] [Google Scholar]
- 35.Bansal P, Sud D. Photodegradation of commercial dye, Procion blue HERD from real textile wastewater using nanocatalysts. Desalination. 2011;267(2):244–249. doi: 10.1016/j.desal.2010.09.034. [DOI] [Google Scholar]
- 36.Ilinoiu EC, Pode R, Manea F, Colar LA, Jakab A, Orha C, et al. Photocatalytic activity of a nitrogen-doped TiO 2 modified zeolite in the degradation of reactive yellow 125 azo dye. J Taiwan Inst Chem Eng. 2013;44(2):270–278. doi: 10.1016/j.jtice.2012.09.006. [DOI] [Google Scholar]
- 37.Azimi F, Nabizadeh R, Hassanvand MS, Rastkari N, Nazmara S, Naddafi K. Photochemical degradation of toluene in gas-phase under UV/visible light graphene oxide-TiO 2 nanocomposite: influential operating factors, optimization, and modeling. J Environ Health Sci Eng. 2019:1–13. [DOI] [PMC free article] [PubMed]
- 38.Bansal P, Singh D, Sud D. Photocatalytic degradation of azo dye in aqueous TiO 2 suspension: reaction pathway and identification of intermediates products by LC/MS. Sep Purif Technol. 2010;72(3):357–365. doi: 10.1016/j.seppur.2010.03.005. [DOI] [Google Scholar]
- 39.Singh RK, Babu V, Philip L, Ramanujam S. Applicability of pulsed power technique for the degradation of methylene blue. Journal of Water Process Engineering. 2016;11:118–129. doi: 10.1016/j.jwpe.2016.04.002. [DOI] [Google Scholar]


