Abstract
Nowadays, it is important to realize systems that can model the electrical activity of neurons taking into account almost all the properties of the intracellular and extracellular environment in which they are located. It is in this sense that we propose in this paper, the improved model of Hindmarsh–Rose (HR) which takes into account the fluctuation of the membrane potential created by the variation of the ion concentration in the cell. Considering the effect of the electric field that is produced on the dynamic behavior of neurons, the essential properties of the model such as equilibrium point and its stability, bifurcation diagrams, Lyapunov spectrum, frequency spectra, time series of the membrane potential and phase portraits are thoroughly investigated. We thus prove that Hopf bifurcation occurs in this system when the parameters are chosen appropriately. We also observe that by varying specific parameters of the electric field, the model presents a very rich and striking event, namely hysteresis phenomenon, which justifies the coexistence of multiple attractors. Besides, by applying a suitable sinusoidal excitation current, we prove that the neuron under electric field effect can present several important electrical activities including quiescent, spiking, bursting and even chaos. We propose the improved HR model under electric field effect (mHR) to study the finite-time synchronization between two neurons when performing synapse coupling across the membrane potential and the electric field coupling. As a result, we find that the synchronization between the two neurons is weakly influenced by the variation of the intensity of the electric field coupling while it is strongly impacted when the intensity of the synapse coupling is modified. From these results, it is obvious that the electric field can be another effective bridge connection to encourage the exchange and coding of the signal. Using the finite-time synchronization algorithm, we theoretically quantify the synchronization time between these neurons. Finally, Pspice simulations are presented to show the feasibility of the proposed model as well as that of the developed synchronization strategy.
Keywords: Modified Hindmarsh–Rose (mHR) model, Finite-time synchronization, Synapse coupling, Electric field coupling, Pspice analog circuit implementation
Introduction
Like most natural phenomena, the behavior of the neuron can be described by mathematical equations involving its main characteristics, notably, the ionic mechanisms that govern the functioning of a neuron. The knowledge of a dimensionless dynamic equation system, in this case nonlinear, called the substituting model for the neuron in the dynamic system, makes it possible, through reference tools, to have vital information about its functioning and therefore, of the nervous system. In this way, Hodgkin–Huxley’s innovative work aimed at creating a mathematical model capable of modeling the different behaviors of the electrical activity of neurons.
One of the significant challenges in neuroscience is to be able to realize mathematical models able to describe the different behaviors of the electrical activity of the biological neurons in the simplest possible way. It is in this sense that in 1952, physiologists-biophysicists Alan Lloyd Hodgkin and Andrew Fielding Huxley proposed a neuron model capable of reproducing the main properties of electrical activities by considering the effect of ion channels (Hodgkin and Huxley 1952). This model was taken over, modified and improved several times; thus, appeared the model of Fitzhugh–Nagumo (Fitzhugh 1961, 1969). Subsequently, many other models to describe the neural activity will be proposed like the Morris-Lecar model (Morris and Lecar 1981) and the Hindmarsh–Rose model (HR) (Hindmarsh and Rose 1982) to name these few. The latter model, due to its algebraic simplicity, has made and continues to be the subject of several improvements and studies to analyze and understand the complex dynamics of membrane potential in the neuron axon (Hindmarsh and Rose 1984; Ren et al. 2017a, b; Ma et al. 2016). Thus, in the past decades, several types of HR models such as classical and modified HR models (Innocenti and Genesio 2009; Innocenti et al. 2007; Gu et al. 2014; Wang and Shi 2020; González-Miranda 2007; Ngouonkadi et al. 2016; Wu et al. 2016; Mondal et al. 2019; Djeundam et al. 2013), delayed HR models (Rigatos et al. 2019), fractional HR models (Dong et al. 2014; Kaslik 2017) and memristor-based HR models with electromagnetic induction (Ren et al. 2017a, b; Lv et al. 2016; Ge et al. 2018; Lv and Ma 2016; Lu et al.2017) have been thoroughly examined and studied by numerous bifurcation analysis methods (Spitzer 2006). Although the three-dimensional HR model has been proposed since 1984, to the best of our knowledge, a detailed dynamic study of this model under the effect of the electric field has not yet been proposed. Indeed, the neuron is the basic unit of the nervous system, the complex physical effects such as electromagnetic induction and polarization must be taken into account when the flow of charges (calcium, potassium, sodium, for example) spreads through the membrane. Moreover, ions are pumped from the endoplasmic reticulum into the cells. Also, the electric field can cause the polarization of the media, while the magnetization of the support is important when considering a time-varying magnetic field because an induced electric field can be generated in the media. Thus, in this paper, inspired by the works done by Ma et al. (2019), we propose an improved HR model that takes into account the effect of this field.
In order to understand and even master the operating principle of some neurological processes, it is essential to study the regulation and transmission of nerve impulses in the brain. More importantly, complex networks are essential tools for clarifying the different features of complex systems (Kivelä et al. 2014; Boccaletti et al. 2014; Estrada 2012; Boccaletti et al. 2006). Synchronization is a universal phenomenon in complex networks because it is via this dynamic behavior that the transmission of information between neurons occurs (Jia et al. 2011; Shi and Wang 2012). In recent years, the study of coupled oscillator networks and their synchronized activities has interested many researchers, particularly in biology. Indeed, in neuroscience, it is proved that an abnormality in the synchronization capacity of neural networks can be at the origin of cerebral pathologies such as epilepsy, schizophrenia, Alzheimer’s disease, Parkinson’s disease, and autism just to name these few (Uhhaas and Singer 2006). As a consequence, many studies have been carried out on the phenomenon of synchronization of neurons by generally considering static couplings (Ma et al. 2017; Perc 2009; Parastesh et al. 2019). Using this as a motivation, we propose the improved HR model under an electric field effect to study the finite-time synchronization between two neurons when performing synapse coupling across the membrane potential and the electric field coupling. Thanks to Lyapunov’s theory (used to prove finite-time convergence), one of the main advantages of the synchronization method we propose (i.e. finite-time synchronization algorithm) is that it allows theoretical determination of the maximum synchronization time before which the electrical activity of the coupled neurons behaves identically (Zuppa et al. 2002; Louodop et al. 2013, 2014a, b).
The rest of this work is organized as follows. We first describe the improved neuron model by showing how the 1984 HR model is modified so that it can take into account the effect of the electric field. After that, we present the analytic expression of the equilibrium point of the system as well as its different eigenvalues. Then, we present a study of the stability of the mHR model. The analysis of the existence of HB in this model for a suitable choice of parameters is also presented. Thereafter, we present two essential parts, the first part deals with the study of the dynamic behavior of the electrical activity of the neurons. The second part makes it possible to propose an analog circuit that can be used to make the electronic circuit of the model. Next move, we focus on the design of a finite-time synchronization applied to the modified HR model. For this, first, we formulate the problem of synchronization; secondly, we present the synchronization process; third, we present the results of the different numerical simulations; fourthly, we present the results of Pspice simulations and fifthly, we make a discussion on the synchronization feature. Finally, a conclusion is made.
Model description
When the concentration of ions (such as calcium, potassium, sodium) in the cell is changed, this causes the fluctuation of the membrane potential. Thus, when an external electrical excitation beyond the threshold value is applied, an action potential may be induced to predict changes in ion distribution density, which may also cause a time-varying electric field. Considering the electrostatic/electrodynamics’ hypothesis mentioned above, the electric field E across the soma surface (S), charge number q, surface charge density can be estimated as follows:
| 1 |
where represents the dielectric constant associated with the intrinsic property of the media, ΔV represents the potential difference between the plates of the cell, is the size of the radius when the cell is considered to have a spherical shape. Briefly recall that one of the most commonly used methods of physically modeling the neuron today is to consider the neuron as a neural circuit that can be constructed using a capacitor, inductor, and other necessary electronic components. Therefore, the equation of the generic circuit can be described by:
| 2 |
where and represent respectively the capacitance of the membrane and the equivalent inductance of the neuron. is the voltage of the membrane, represents the current through the cell, represents the intrinsic parameter of the media while indicates the external forcing and synapse current. The nonlinear function describes the process of the membrane potential that depends on the voltage of the membrane and the current through the cell, also represents a nonlinear function that defines the transmembrane current. As is well known, biological neuron models should take into account the effect of ion channels that determine ion propagation as well as the membrane potential. However, the involvement of the field variable E allows us to correctly describe the ion distribution and the membrane potential change induced by ion exchange and transport in the cell. Therefore, the electric field can be used as a new variable to estimate the change of ions and the membrane potential of the neuron. Besides, the intrinsic electric field in the neuron modulated when the media exposed to the external electric field.
Taking into consideration what is said above, Eq. (2) becomes:
| 3 |
where is a constant that describes the polarization property, its value is . represents the external electric field, which can either be a periodic modulation function or radiation that characterizes a noise. Thus, drawing on (Ma et al. 2019), in this work, the neuron model introduced by Hindmarsh and Rose (HR) in 1984 (Hindmarsh and Rose 1984) will be improved to take into account the effect of the electric field. The model obtained after this modification is, therefore, the following:
| 4 |
where x, y and z respectively describe the membrane potential, the slow current associated with the recovery variable and the adaptation current. Generally, the values of the constants set as follows: The external stimulus current is a sinusoidal function defined by . For the sake of simplicity, the external electric field in this system that we propose is modeled by .
Equilibrium point and stability
We can have an idea about the qualitative behavior of the system evolution by analyzing what happens around the equilibrium point. So, considering the system (4) and replacing the parameters and by their values defined previously, this equilibrium point is obtained by solving the equation system , either:
| 5 |
Following (Bao et al. 2015, 2018; Xu et al. 2017), we solve the system (5) and the AC equilibrium point of the modified HR model is as follows:
| 6 |
where represents the real solutions of the following equation:
| 7 |
Let,
| 8 |
where is called Cardan discriminant. From (8), we can easily see that , which implies that . In this case, there exists a single real root which is defined by (Han et al. 2015; Bao et al. 2018):
| 9 |
The stability of this AC equilibrium point () can be analyzed by determining the Jacobian matrix associated with the system (4):
| 10 |
We can therefore easily deduce the characteristic equation (, with an identity matrix of the same size as ) corresponding to the Jacobian matrix of Eq. (10):
| 11 |
in which
| 12 |
In order to find the different eigenvalues, we will solve this characteristic equation. Equation (11) can be reduced to the equivalent form:
| 13 |
with , and . The terms and are functions of the AC equilibrium point, hence the term is a function that evolves with time. So, the method of solving Eq. (13) depends on the value of ( or ).
When , we will use the Ferrari method:
Equation (13) is equivalent to:
| 14 |
In Eq. (14), the term on the right is a second-order polynomial. We are going to look for such that the discriminant of is equal to zero, we thus obtain the following equation:
| 15 |
We are brought back to solve a cubic polynomials equation. As is with real coefficients, considering the Cardan discriminant described in (Han et al. 2015; Bao et al. 2018), one of the following roots can be considered as a particular solution of Eq. (15) according to the sign of :
| 16 |
with,, , and denotes the unit of the imaginary number.
Equation (14) can be in the form:
| 17 |
The solutions of Eq. (11) belonging to the set of complex numbers are therefore the following:
| 18 |
-
When , this means that Eq. (13) is a simple quartic equation and it can resolved easily. In this case, the eigenvalues are as follows:
19
By varying the normalized time in an interval from 0 to 200 (or from 0 to 100), the time evolution of the xe-component of the AC equilibrium point and the real parts of the eigenvalues corresponding to this equilibrium point are presented in Fig. 1 for and . In order to study the stability of our model, several cases were envisaged. In the first case (Fig. 1a, b), we assume that the amplitude and frequency of the excitation current are the same as those of the external electric field (). In the second case (Fig. 1c, d), we assume that the amplitude of the external excitation current is different from that of the external electric field (), we can notice in this case that the amplitude of the excitation current has increased as compared to that of the previous case and that the amplitude of the external electric field has not changed. In the latter case (Fig. 1e, f), we consider , but increase the frequency value of the external stimulus current from 0.01 to 0.04. From Fig. 1a–d, we observe that the curve of the xe-component of the equilibrium point evolves over two periods and that the time evolution of the eigenvalues alternates between negative and positive values while that of the eigenvalue is almost constant and close to zero. Let us recall that in order to study the stability of a stationary point that has four eigenvalues, at least three cases can be envisaged (see (Letellier et al. 2013)), the first case is when at least one of the four eigenvalues has positive real part, in this case, the equilibrium point is said to be unstable saddle-point/focus. The second case is when three of the eigenvalues have a strictly negative real part, and the fourth value has a zero real part, then the equilibrium point is said to be marginally stable (quasi-stable) node-point/focus. The third case is when all eigenvalues have a strictly negative real part; in this case, we say that the equilibrium point is stable node-point/focus.
Fig. 1.
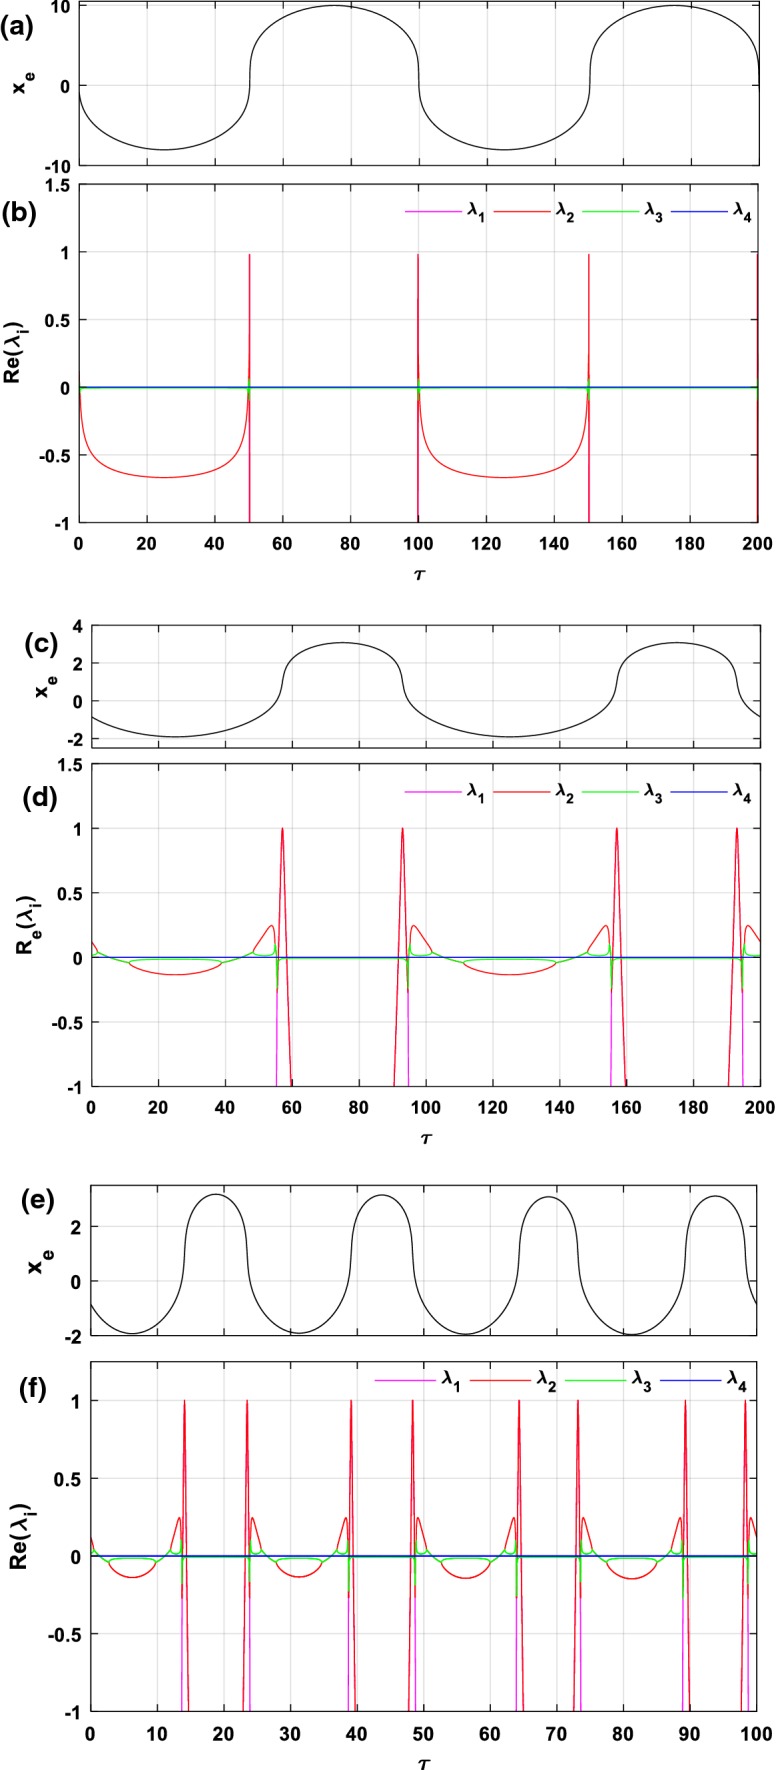
Time evolution of the xe-component of the AC equilibrium point and the corresponding eigenvalues for (a, b); and (c, d); (e, f)
It follows that the corresponding stability distributions evolve in a cycle that goes from a marginally stable interval to an unstable interval, then from this unstable interval to a marginally stable interval and the cycle starts again in the next period. Indeed, considering the dynamics of the system during a cycle (i.e. a period) in the interval [20, 120], the AC equilibrium point for is unstable in both regions [49.86, 50.20] and [99.79, 100.1] (see Fig. 1b). In this same interval, when only the amplitude of the external excitation current is increased and the value of the other parameters remains fixed () it is found that the equilibrium point becomes unstable in the four regions [44.94, 55.23], [55.8, 58.3], [91.7, 94.2], and [94.76, 105.1] (see Fig. 1d). As a result, it can be said that the dynamics of the system becomes more complex as the magnitude of the forcing current increases. On the other hand, by observing Fig. 1e, f, it is found that when increasing the frequency of and the value of the other parameters is the same as above, this does not have a significant influence on the stability distributions of the equilibrium point in a period.
Without loss of generality, consider a particular value of the normalized time set as a representative example. In this specific case, the AC equilibrium point becomes a DC equilibrium point since it no longer evolves over time (Bao et al. 2018). Using the parameters values of Fig. 1e, f (i.e.,, and ) the corresponding equilibrium point is unstable (Real (λ2) > 0). Since the coefficients and are real numbers and they depend on the electric field parameters ,, it is deduced that the stability of the modified HR model also depends on the parameters of the field. Therefore, it is important to investigate the effects of these parameters on the equilibrium point stability in order to explain and highlight possible local bifurcation phenomena. Thus, in Fig. 2, the parameters and of the electric field vary simultaneously in the regions and respectively, and their influence on the stability of the equilibrium point is observed (the values of the other parameters are the same as those of Fig. 1e, f). In this figure, the pairs of coordinates , for which the equilibrium point is stable/quasi-stable are represented by the cyan color zones, while those for which the equilibrium point is rather unstable are represented by the magenta-colored zones. Since on this map, one observes a sudden transition of the equilibrium point stability, which signifies that there has been a qualitative change of the solutions of the Eq. (11). Thus, Fig. 3 provides the representation of the eigenvalues solutions in the plane (Real (λ), Imag (λ)) for values of and varying in the interval where this qualitative change occurs (i.e. and ). Note that the coefficients of the Jacobian matrix are all real, which implies that it is the appearance of complex conjugate eigenvalue pairs that creates the symmetry observed along the real axis (see Fig. 3). As a result, the locus intersects the imaginary axis and thus suggests the possibility of Hopf bifurcation (Ngouonkadi et al. 2016; Kengne et al. 2017; Wouapi et al. 2019).
Fig. 2.
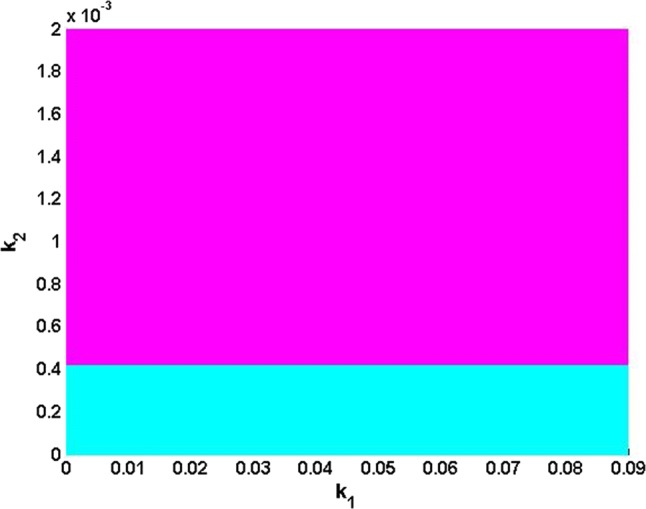
Basin stability of equilibrium point in the plane showing the region where this equilibrium point is stable/quasi-stable (cyan) and the region where it is unstable (magenta) for ,, while keeping and
Fig. 3.
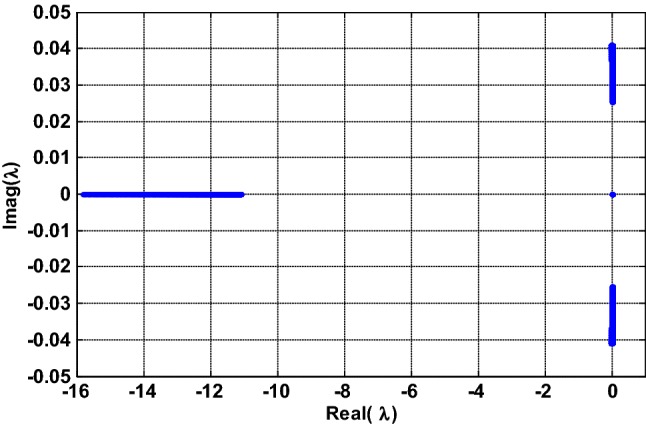
Representation of the eigenvalues solutions of Eq. (11) in the complex plane (Real , Imag ) for , , while keeping and . Provided that Je is a real matrix, complex eigenvalues occur in complex conjugate pairs responsible of the symmetry observed along the real axis. The locus intersects the imaginary axis and thus suggests the possibility of Hopf bifurcation
Existence of Hopf bifurcation (HB) in the model
Theoretical analysis of the existence of HB
It is important to recall that, the transition from stability to instability in some contests is explicitly linked to the disappearance or birth of a periodic orbit. When a change of this nature occurs in a system, it is said that there is the appearance of the Poincare-Andronov-Hopf bifurcation, better known as the Hopf bifurcation (HB). This bifurcation can provide a good explanation for many physical phenomena that are usually encountered because it characterizes the simplest mechanism of transition from a stationary regime to oscillations (or oscillations at a stationary regime). As an example in neurodynamics, the possible mechanisms for highlighting how a nervous system reacts instantly to excitation are described by sudden changes observed in the dynamic behavior of this system. This change in the behavior of the nervous system is due to the appearance of a phenomenon called Hopf bifurcation (HB) (Ngouonkadi et al. 2016). This is the major reason why the study and mastery of this type of bifurcation in particular is very important in the theory of bifurcations. The priority now is to study the occurrence of a pair of complex-conjugate feature of an equilibrium state across the imaginary axis for the specific normalized time (see Fig. 3). Thus, we perform the analysis of parametric variations with reference to dynamical bifurcations at the equilibrium by employing the classical form theory and symbolic computations (Wiggins 1990; Kuznetsov 1998). Note that in Fig. 3, only the electric field parameters and vary, the other parameters are fixed and it is these fixed values that will be used in this subsection. The electric field strength is a significant parameter in the dynamical study of this mHR neuron model (see Eq. 3) because as we mentioned above, it can describe the size of the radius when the cell is considered to have a spherical shape. Therefore it is very interesting to find the critical value for which the HB can appear in the proposed model. We briefly recall the following transversality condition to prove that a Hopf bifurcation occurs in a system (Wiggins 1990; Guckenheimer and Holmes 1983; Wouapi et al. 2019).
Suppose that the system has an equilibrium at which the following properties are satisfied:
has a simple pair of purely imaginary eigenvalues and , and other eigenvalues with negative real parts;
.
Then, the system has a Hopf bifurcation at the equilibrium
Since what interests us here is the instability related to the HB, we consider the characteristic equation described by Eq. (11) calculate around the point of equilibrium . Then we derive this equation with respect to the control parameter and we obtain:
| 20 |
where and
Now we assume that Eq. (11) has a pure imaginary root . By substituting it into Eq. (11), the real parts gives:
| 21 |
Examining these relations, we see that . Under the restriction that for j = 3, 4, the second condition for a HB is met and the Poincaré–Andronov–Hopf theorem holds. Then, HB can occur at of system (3). Obviously, Eq. (11) has a pair of purely imaginary conjugate roots and a strictly negative reals roots . Our aim now is to deduce a relationship between system’s parameters corresponding to this bifurcation around the equilibrium . Thus, we substitute into the Eq. (11) and we obtain the following conditions:
| 22 |
and
| 23 |
To obtain the control parameter’s values , we replace in Eq. (23) by their expressions described in (12). Hence, after some algebraic manipulations, we derive the following second-order polynomial equation from which solutions give :
| 24 |
where
Consequently, the following conclusion can be made, when passes through the critical value , system (4) undergoes a Hopf bifurcation at the equilibrium .
Numerical verification of the existence of HB
In order to numerically prove the theoretical developments presented above, we consider the value of the electric field parameter for which there is a sudden change in the stability of the equilibrium point : (see Fig. 2). By using this value of and considering the values of the other parameters used to plot Figs. 2 and 3, it is easily deduced by solving Eq. (24) that the critical values of the parameter are: and Since the size of the radius cannot be negative, we only consider the positive value of . For this critical value of , we obtain the unique equilibrium point . For this equilibrium point, we obtain two real eigenvalues and as well as a pair of purely imaginary conjugate roots (i.e. ). In addition, we also obtain then the transversality condition is satisfied. As a result, we conclude that for this judicious choice of parameters of the mHR neuron model under electric field effect, there is an occurrence of Hopf bifurcation.
Dynamic analysis and electronic circuit of the model
Dynamic analysis: bifurcation, Lyapunov exponent and various firing activities
In order to investigate the various important phenomena that the HR model can present under electric field effect, we solve system (4) numerically using the fourth-order Runge–Kutta algorithm. It is important to mention that for all the results presented in this work, the integration step is always set to and the calculations are carried out using variables and constants parameters in extended mode. Briefly, recall that two indicators are generally used to identify chaotic behavior in a system, we have the bifurcation diagram and the Lyapunov exponent. The first indicator (i.e. the bifurcation diagram) shows the values visited or approached asymptotically (fixed points periodic orbits, or chaotic attractors) by a system as a function of the system control parameter. In other words, the bifurcation diagram provides models of transitions and instabilities when some control parameters are varied (Strogatz et al. 1994). It is obtained using the Runge–Kutta algorithm with the particularity that one calculates the velocity of the single scalar variable at a moment and then one calculates the same velocity at a moment . A test is then carried out according to whether we want to represent the local maxima (in this case the condition and must be verified), the local minima (in this case the condition and must be verified) or the local averages (in this case the condition must be verified). For each of these cases, we represent on the ordinate axis of the diagram the coordinate point and on the abscissa axis the corresponding value of the control parameter. Note that one of these bifurcation diagrams (local maxima, local minima or local averages) is sufficient to have the desired information on the dynamics of the system because they all have the same characteristics. Concerning the second indicator (i.e. Lyapunov exponent), the dynamics of the system is evaluated thanks to the Lyapunov exponent, which is calculated numerically using the algorithm of Wolf et al. (1985). In particular, the sign of the largest Lyapunov exponent determines the rate of some small perturbations of the state variables of the system and, consequently, the nature of attractor. When , all the disturbances disappear, and the trajectories start sufficiently close to each other, thus converging towards the same point of stable equilibrium in the state space. For , initially closed the orbits remain close but discrete, corresponding to the oscillatory dynamics on a limit cycle or a torus; and finally, when the small perturbations grow exponentially, and the system evolves chaotically, we say in the latter case that the system presents the phenomenon of chaos. To better understand the complex dynamics of the new system that is the subject of our study, we have plotted the time evolution of the state variables, as well as some phase portraits. When we vary the parameter which represents the amplitude of the external excitation current, we obtain the spectrum of the bifurcation diagram of Fig. 4a which shows the local maxima of the membrane potential x. Moreover, we present in Fig. 4b the equivalent graph of the Lyapunov exponent of the attractor as a function of the parameter that is varied in the interval with the initial condition for the following values of the other parameters: .
Fig. 4.
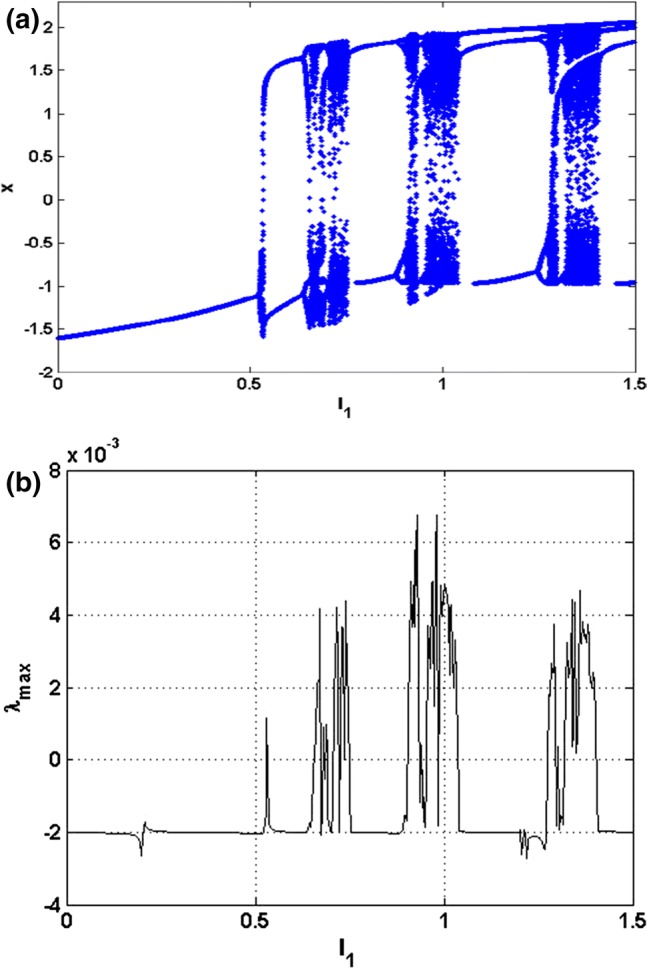
Bifurcation diagram a showing local maxima of the membrane potential x of the attractor and corresponding graph of largest Lyapunov exponents b versus parameter that is varied in tiny steps in the range with the initial condition for and . A positive exponent indicates chaos while regular states are characterized with negative values of Lyapunov exponent
It can be observed from this diagram that, when some values of the currents are applied, the model can present very rich dynamic phenomena such as chaos. It can easily be seen from Fig. 4a perfect harmony between the bifurcation diagram and the Lyapunov exponent.
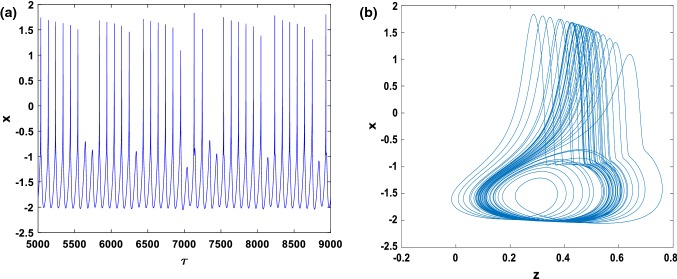
From the time series of the membrane potential of Fig. 5a and the two-dimensional phase portrait in the (z–x) plane of Fig. 5b, the chaotic behavior of the modified HR model can be seen.
Fig. 5.
Numerical simulation of: time series (a) and two dimensional views (b) of the attractor projected, illustrating the complexity of the system for and with the initial condition
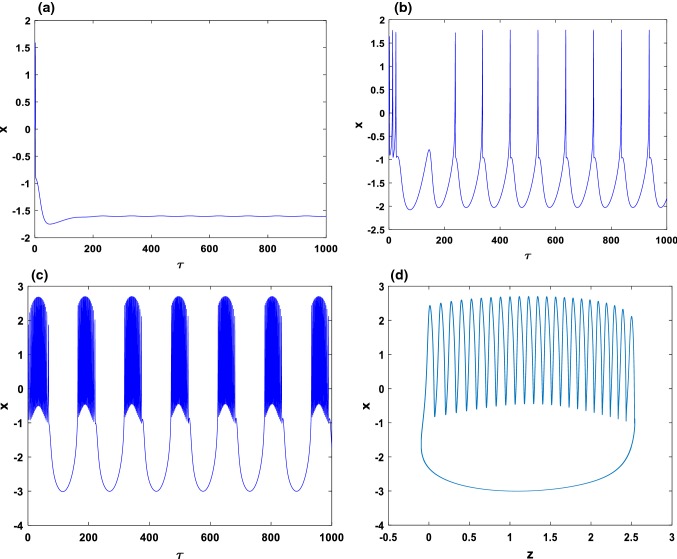
In order to confirm that this new HR model can always present the essential dynamics of neurological behavior, we present the results of Fig. 6. In this figure, we show that by applying a suitable sinusoidal external current, we can have exciting behaviors such as the quiescent state Fig. 6a, spiking state Fig. 6b and busting state Fig. 6c. Figure 6d presents the phase portrait in the (x–z) plane of the time series of Fig. 6c. As a result, the consideration of electric field E can modulate the polarization and fast current; thus, chaotic behavior can be suppressed to select spiking or bursting series in the electric activities.
Fig. 6.
Numerical simulation of the time series of membrane potential in neuron under different external current at , for a; b; c with the initial condition . d present the two dimensional views of the attractor illustrating the complexity of the system when
In order to better understand the dynamics of the improved HR model, we have produced Fig. 7, where two bifurcation diagrams are superimposed. These diagrams showing the local maxima of the membrane potential x as a function of the electric field parameter k1 which varies in the very small range , are obtained for the values of the parameters and , when the initial condition is fixed at Indeed, the green diagram (respectively blue) is obtained by increasing (respectively decreasing) the parameter in this interval starting in each case with the initial condition . This technique, where the final state of each iteration is used as an initial condition for the next iteration is usually known as a continuation bifurcation diagram (or upward and backward bifurcation) (Njitacke et al. 2018; Wouapi et al. 2019). These bifurcation diagrams reveal a significant phenomenon when it is occurring in biological systems, namely hysteretic dynamics, which has as a first consequence the creation of another phenomenon called the coexistence of attractors (Njitacke et al. 2017; Njitacke and Kengne 2018; Negou and Kengne 2018).
Fig. 7.
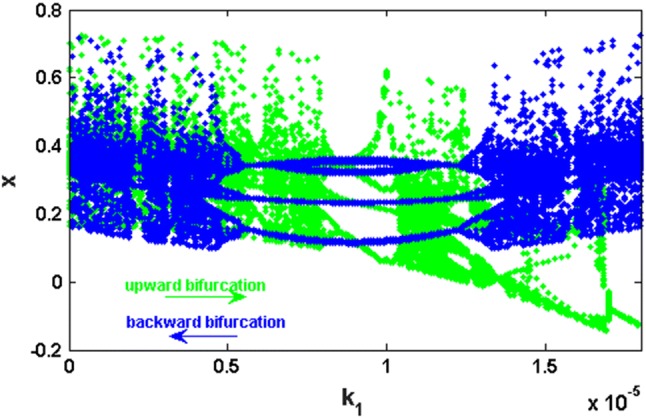
Bifurcation diagram showing the presence of large windows of hysteretic dynamics. This region corresponds to values of in the range: with and . The direction of the green arrow indicates that green bifurcation diagram is obtained by incrementing the control parameter k1 from 0 to 0.000017999 with an integration step of 10−8 (upward bifurcation) while the direction of the blue arrow indicates that blue bifurcation diagram is obtained by decrementing the same control parameter k1 from 0.000017999 to 0 with an integration step of − 10−8 (backward bifurcation). Note that this diagram illustrating the zone in which the system exhibits possible coexistence of different chaotic attractors
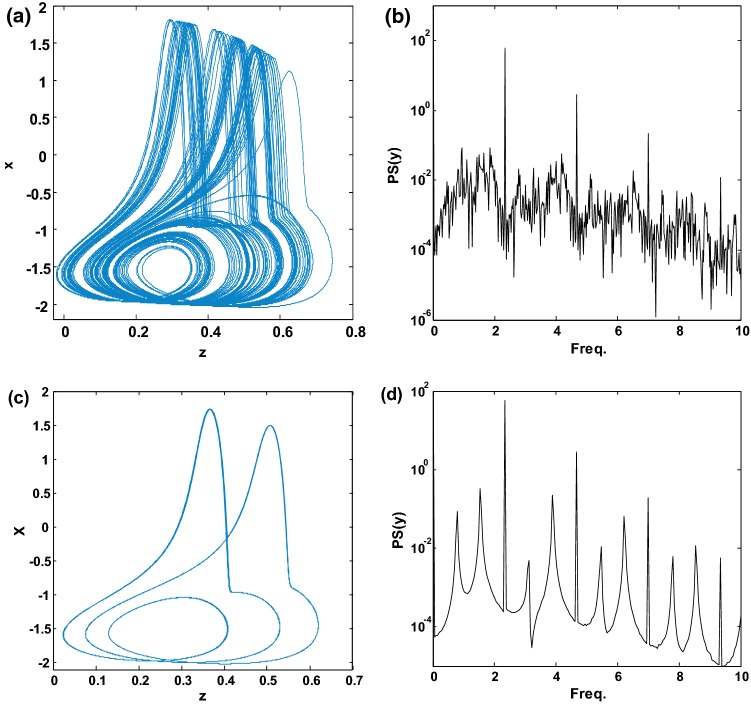
Indeed, from Fig. 7, we can further analyze the possible coexistence of the attractors by choosing a value of (for example ) for which the hysteresis phenomenon is observed (i.e. the regions where the green diagram and the blue diagram are not overlapped). Considering the parameters of Fig. 7 and using this value of , the phase portraits and the corresponding frequency spectrum were obtained to prove the coexistence of two attractors (bi-stability) created by the hysteresis phenomenon (see Fig. 8). As predicted by the upward bifurcation (green bifurcation diagram in Fig. 7), a chaotic attractor is obtained for the initial conditions = (see Fig. 8a). Similarly, as predicted by the backward bifurcation (blue bifurcation diagram), a period-3 limit cycle is obtained for the initial conditions = (see Fig. 8c). To better illustrate the difference between these two attractors, we provide the power spectrum (PS) of Fig. 8b, d. It should be noted that for periodic motion, all spikes in the power spectrum are harmonically related to the fundamental, whereas a broadband power spectrum is characteristic of a chaotic mode of oscillations. Briefly recall that the periodicity of the attractor is deduced by counting the number of spikes located at the left-hand side of the highest spike of the spectrum (the latter being included).
Fig. 8.
Phase orbits (left) and corresponding frequency spectra (right) showing coexistence of two different attractors (a chaotic attractors and a period-3 limit cycle) for . Initial conditions are and , respectively
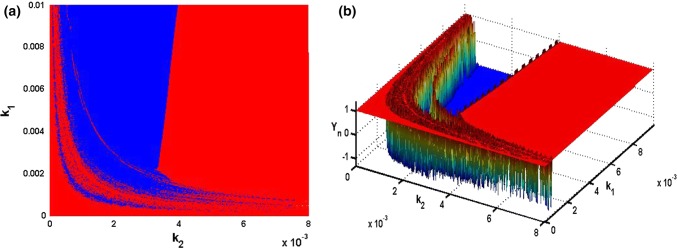
Panahi’s and collaborators relevant work have shown that a healthy brain has neuronal activity that is described by a chaotic (irregular oscillations) electroencephalogram (EEG), whereas when the brain presents certain pathology such as epilepsy, the EEG signal obtained is rather periodic (regular oscillations) (Panahi et al. 2017). It is therefore interesting to evaluate the effect of the electric field parameters on the dynamics of the HR neuron model when these vary simultaneously and continuously. Thus, in Fig. 9, the two parameters and of the electric field vary simultaneously in the regions and and their influence on the dynamics of the mHR is observed (the values of the other parameters are the same as those of the Fig. 5). For each parameters setting, the system is integrated for a sufficiently long time and the transient period is canceled. In this figure, the pairs of , coordinates for which the neuron has a chaotic firing are represented by the green zones while those for which this neuron has a periodic firing are represented by the blue zones. In addition, for more visibility, we define Yn = sgn(λmax) and represent in 3D the surface of the electric field parameters and for which the proposed neuron model has an irregular or regular oscillation (see Fig. 9b). Note that in Fig. 9b, the irregular oscillations surfaces correspond to Yn = 1 (i.e. λmax > 0) whereas the regular oscillations correspond to Yn = − 1 (i.e. λmax ≤ 0). As a result, it can be seen that certain values of the electric field parameters can allow the neuron to have a normal behavior while others can create pathology.
Fig. 9.
Two-parameter phase diagram in the plane in (a) and in space in (b) showing respectively the region of regular oscillations (blue) and the region of irregular oscillations (red). The irregular oscillation of the neuron corresponds to Yn = 1 while the regular oscillation corresponds to Yn = − 1. (Color figure online)
PSpice electronic circuit implementation of the mHR
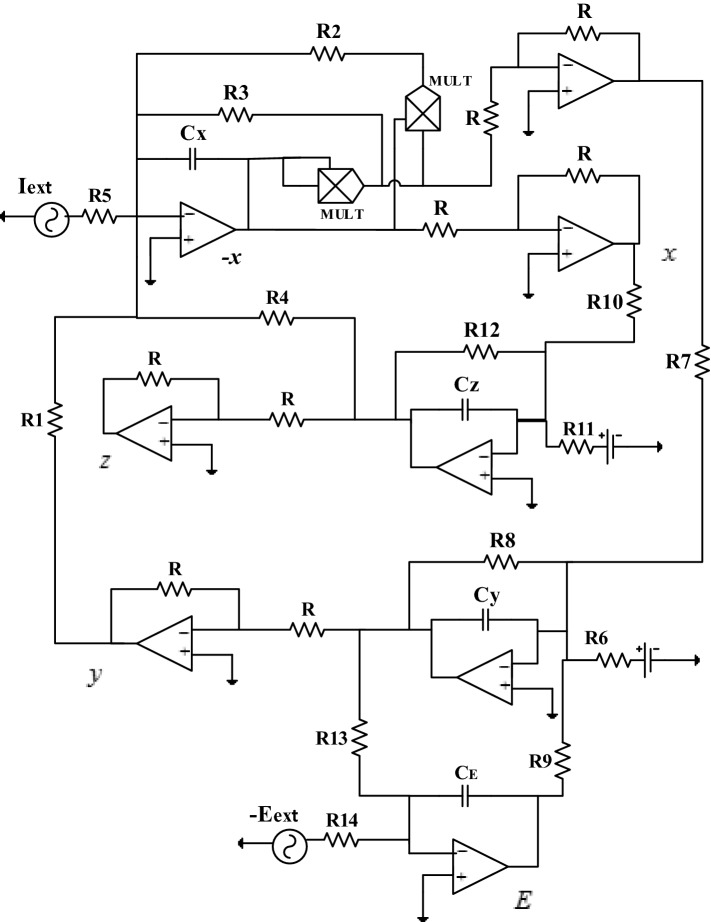
In this part of our work, the aim is to be able to set up an analog circuit that will allow us to make a comparison between the theoretical/numerical results obtained previously and the experimental results. The circuit diagram that allows us to perform the various simulations in the PSpice software presented in Fig. 10. The realization of this circuit is carried out with the help of the operational amplifiers TL084 and the associated circuits making it possible to carry out the basic operations like the addition, the subtraction and the integration, the electronic multipliers (MULT) are the analog component versions AD633JN. They are used to implement the non-linear term of the system.
Fig. 10.
Analog circuit of the improved Hindmarsh–Rose neuron model under electric field effect
By applying Kirchhoff’s laws to the electronic circuit of Fig. 10, their circuit equations are deduced in the following form:
| 25 |
From Eq. (25), we can easily establish the expressions of the parameters of Eq. (4) depending on the value of the electronic components of Fig. 10:
| 26 |
Bearing in mind that the time scaling process offers analog instruments the ability to work with their bandwidths, the unit of time here is . Indeed, this process offers the opportunity to simulate the behavior of the system at a given frequency by performing an appropriate time scaling consisting of expressing the MATLAB time variable for the PSpice calculation time variable : (Kengne et al. 2012). Operational amplifiers are polarized at ± 14 VDC using a symmetrical voltage source.
By choosing , and considering the following values of the other parameters of the system (4) , the equivalent values of the electronic components of the circuit of Fig. 10 are:
and
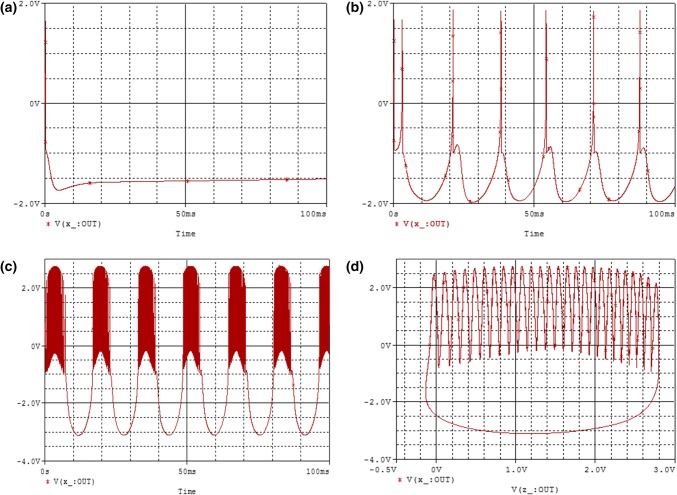
It can be seen from the above that the amplitude of the external stimulus current can be varied in the circuit of Fig. 10 by changing only , which allows us to appreciate the effect of the current on the dynamics of the improved HR model. Figures 11a and 12a–c show some curves of the time evolution of the membrane potential, while Figs. 11b and 12d illustrate some attractors in the (z–x) plane. Indeed, from these figures, it is clear that by applying a suitable excitation current on the HR model subjected to the influence of a sinusoidal external electric field. It presents very interesting phenomena and rich in dynamics describing well the different electrical activities of neurons such as chaos state (Fig. 11), quiescent state (Fig. 12a), spiking state (Fig. 12b) and finally bursting state (Fig. 12c, d). Given all these results, it can be said that the analog simulations are in agreement with the theoretical/numerical results obtained previously.
Fig. 11.
PSpice simulation of: time series (a) and two dimensional views (b) of the attractor projected, illustrating the complexity of the system for and
Fig. 12.
PSpice simulation of the time series of membrane potential in neuron under different external current at , for a; b; c with the initial condition . d Present the two dimensional views of the attractor illustrating the complexity of the system when
Finite-time synchronization
Problem statement
It is known today that the extracellular electric field is continuously present in the living nervous system and may have an impact on the synaptic force, which ensures the connection between the neurons. Indeed, the synaptic link plays an important role in the exchange of energy and the propagation of signal between neurons. Also, the chemical synapse, in particular, plays a significant role in the coding and synchronization of neurons through the release of the neurotransmitter. As a first consequence of electrical field involvement, the synaptic function can be modified because this field can influence the release of the neurotransmitter. Thus, studying synchronization and synchronization patterns in neural networks is very crucial in understanding neurological activities and is an exciting topic in neuroscience. Using this as a motivation, in this part of our work, the goal is to propose the improved HR model under electric field effect (see Eq. 4) to study the finite-time synchronization between two neurons when performing the synapse coupling across the membrane potential and the electric field coupling, this in bidirectionally way (see the schematic diagram in Fig. 13).
Fig. 13.
Schematic diagram for two bidirectionally coupled neurons under electric field effect
Considering that the first neuron has a state variable and the second neuron has a state variable , the dynamic equations of these two neurons under synapse and field coupling are described by:
| 27 |
where the constants and represent respectively the intensity for synapse coupling and electric field coupling. We define the synchronization error in the following way:
| 28 |
Thus, we can easily deduce the system below, which makes it possible to describe the dynamics of the synchronization error:
| 29 |
The problem of synchronization between the two neurons now amounts to ensuring that the error dynamics described by Eq. (29) are asymptotically stable. In addition, finite-time synchronization implies that for all initial conditions , the solution of the system (29) reaches the origin () after a finite-time , that is:
| 30 |
Synchronization process
To attain the synchronization objective previously stated, we use the Lyapunov stability theory. The aim here is to prove that, the states of the synchronization system converge to zero at a finite horizon. In other words, for the conditions of Eq. (30) to be satisfied, it is essential to find a Lyapunov function necessary to achieve the finite-time synchronization of the two neurons. This can only be possible if the Lyapunov function is minimal when all its variables close to zero. Therefore, we propose the following specific Lyapunov function that satisfies the conditions specified in (Zuppa et al. 2002; Louodop et al. 2013, 2014a, b; Paden Brad and Shankar 1987):
| 31 |
Deriving Eq. (31) with respect to time and using Eq. (29) we obtain:
Taking into account the properties of the Lipschitz functions set out in (Khalil 2007; Ngouonkadi et al. 2014; Cho and Rajamani 1997), we suppose that there are two positive constants and such that:
and
It follows that
At this level, we assume that the intensities of synapse coupling and electric field coupling obey the following conditions:
| 32 |
when these conditions are satisfied, we have
| 33 |
For Eq. 33, we can say that the finite-time convergence of Eq. (29) is satisfied, according to Theorem 2 stated in (Paden Brad and Shankar 1987).
However, to estimate the theoretical finite-time synchronization between the two neurons, we integrate Eq. (33) from 0 to , we obtain:
Knowing that when , we have
which implies that
| 34 |
Equation (34) allows us to know the maximum time before which there is synchronization between the two modified HR systems. Finite-time synchronization is satisfied when the numerical synchronization time is less than or equal to the theoretical synchronization time (Louodop et al. 2013, 2014a).
Numerical results
In order to demonstrate the feasibility of the proposed synchronization method, numerical simulations are presented in this part of the work. These simulations are performed considering the values of the system parameters for which the neurons have a chaotic behavior (see Fig. 5) and thus, the initial conditions and are the following and . Using these parameter values and these initial conditions, the theoretical time for finite-time synchronization is .
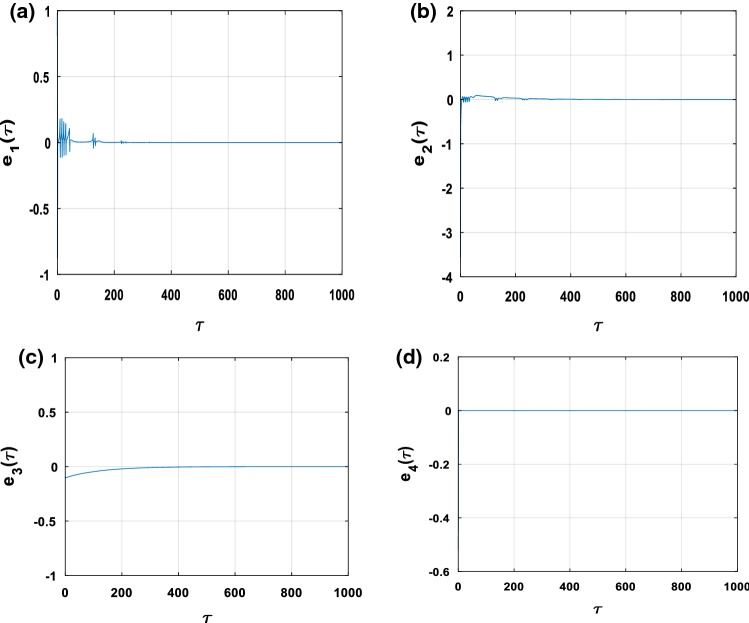
Figure 14a presents the time evolution of the synchronization error between the membrane potentials of the neurons and ; it can be noticed that after a numerical synchronization time , the two neurons evolve identically. The same observation can be made for the other variables (see Fig. 14b–d) where we see that each time, the condition is verified.
Fig. 14.
Time histories of error signals
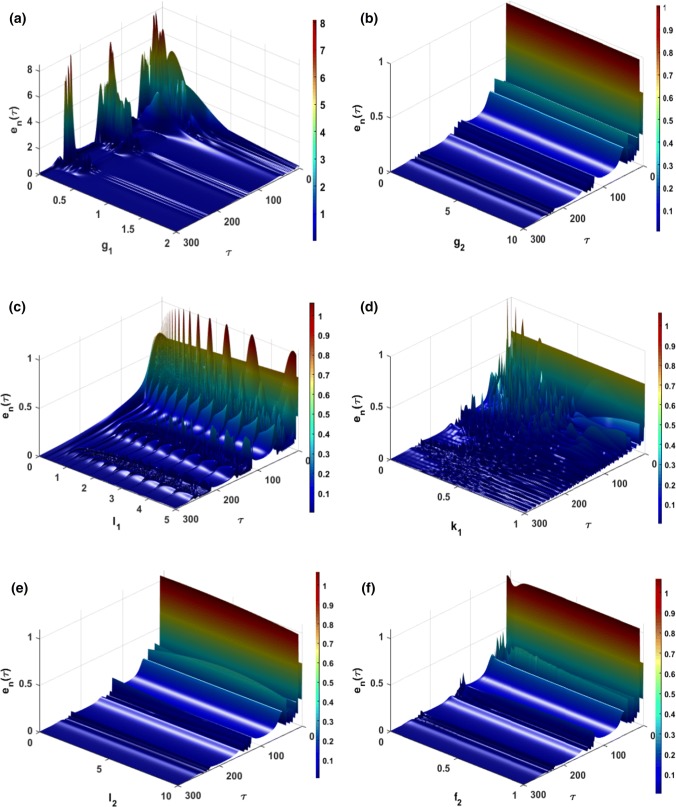
Furthermore, one of our major concerns in this work is to be able to quantitatively show the effect of some important parameters on the coupling dynamics of the mHR model of Eq. (27). For this, we define the following synchronization error norms . In Fig. 15a, it can be seen that for low values of synapse coupling intensity (), the behavior of the two coupled neurons cannot be identical (desynchronization). It can be seen from Fig. 15b that the influence of the variation of the intensity of the electric field coupling on the synchronization of these two neurons is very small. In addition, the change in the amplitude of the external excitation current (see Fig. 15c) or that of the electric field parameter (see Fig. 15d) do not have a significant impact after a time (which can be considered as transient period) of By adjusting the amplitude (Fig. 15e) and the frequency (Fig. 15f) of the external electric field to appreciate their impact on the synchronization of membrane potentials and ; it is noted that, just as the effect of electric field coupling, these impacts are very small.
Fig. 15.
Time evolution of error norm when varied: a the intensity of synapse coupling , b the intensity of the electric field coupling , c the amplitude of the external forcing current , d the feedback gain , e the amplitude of the external electric field , f the frequency of the external electric field
Pspice simulation
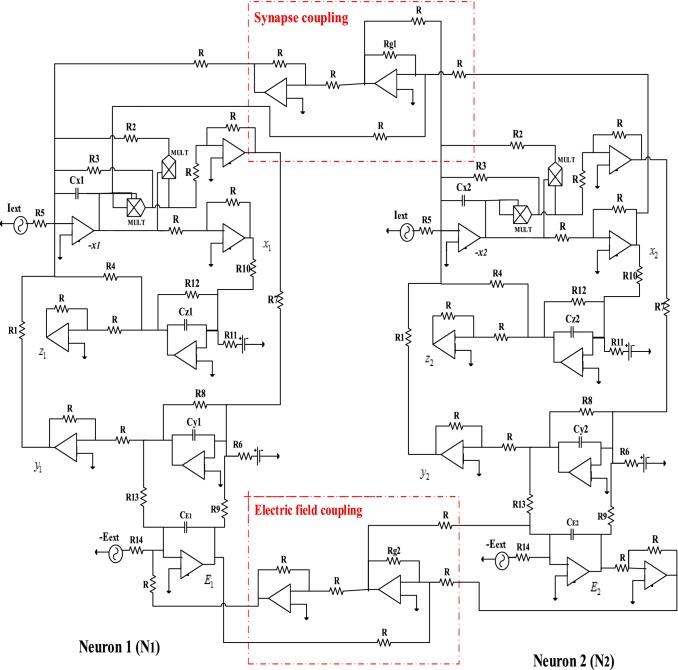
One of the significant challenges in the study of non-linear biological systems is to be able to physically implement the different results obtained through theoretical and numerical studies (Wu et al. 2019). When these results are confirmed experimentally, they can be used in medical engineering to solve specific problems that are encountered in everyday life. This is the case, for example, of cardiac simulators (pacemakers) which are manufactured by the electronic circuit and which allow the patient’s heart to have normal electrical activity (ECG: electrocardiogram) via the synchronization phenomenon between the pacemaker and the sick heart (Lopez et al. 2015). Then, the objective here is to implement an electronic circuit that can provide the synchronization strategy proposed above to verify the efficiency and practical feasibility of this synchronization. In order to electronically implement the schematic diagram of Fig. 13, we consider two identical neurons whose circuit of each corresponds to that of Fig. 10. Thus, we use the values of the parameters defined in the subsection above to determine using the Eq. (26), the values of the equivalent electronic components. These values of the components are the same for their respective circuits. To realize the electronic circuit of each coupling (synapse coupling and electrical coupling) between these neurons, we use as analog tools an inverter summing assembly whose output is connected to an inverting operational amplifier (see Fig. 16).
Fig. 16.
Analog circuit for two coupled mHR neurons with synapse coupling and electric field coupling. (Color figure online)
From this figure, we observe two blocks surrounded by red dashed lines; these blocks represent the synapse coupling and the electric field coupling between the two neurons. Moreover, from Fig. 16, we deduce the values of the intensities of synapse coupling () and the electric field coupling () as follows:
| 35 |
It is therefore evident that in this circuit (see Fig. 16) it is easy to adjust the intensity of the couplings and by merely modifying the values of the resistances respectively (since ). Recall that, the relationship between the synchronization time obtained previously thanks to the numerical simulation and that of the synchronization time obtained thanks to the PSpice simulation is given by:
| 36 |
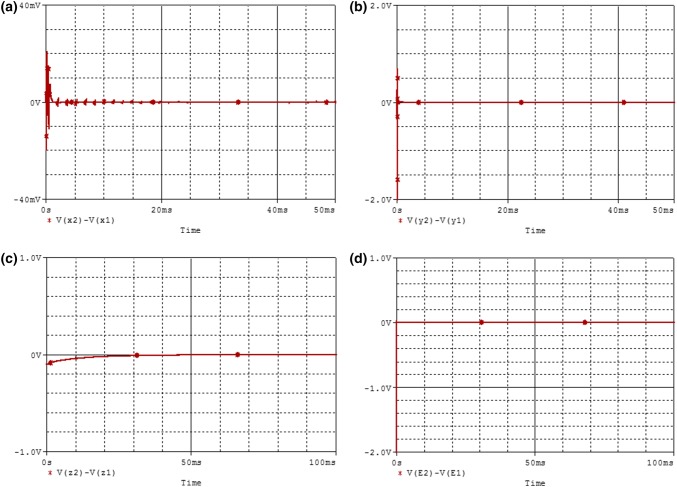
PSpice simulations results illustrating the finite-time synchronization of the two coupled neurons are presented in Fig. 17. From these results (see Fig. 17a–d), it can be seen that the synchronization time obtained after the PSpice simulation is always less than or equal to the theoretical synchronization time obtained previously (). Therefore, we can say through these PSpice simulations that the synchronization method/strategy presented throughout this part of our work is physically feasible.
Fig. 17.
Time histories of error signals in Pspice
Discussion on the synchronization feature
Recent research has confirmed that electric/magnetic field coupling is very effective in achieving signal propagation between neurons (Ren et al. 2019). However, Ma et al. relevant work has shown that, under certain conditions, field coupling can create synchronization or desynchronization between coupled chaotic oscillators (Ma et al. 2018). Knowing this, one of our objectives in this contribution was to investigate the effect of the variation of the electrical coupling intensity on the signal propagation between the neurons. Indeed, in (Antonopoulos et al. 2019), it is clearly explained that the brain is a network of billions of neurons, and that these neurons are interconnected through synaptic and electrical couplings that allow them to exchange and code the information. Hence, in this contribution, we focus on the influence of the variation of synapse coupling (g1) on the membrane potential and the electrical coupling (g2) on the electric field. In regards to the electrical coupling g2, we quantitatively evaluate through Fig. 15b the impact that this coupling can have on the synchronization of two neurons when its intensity is modified. As mentioned previously, pathologies such as epilepsy, schizophrenia, Alzheimer’s disease, Parkinson’s disease, autism and many others, occur when coding and transmission of signal/information between coupled neurons does not occur normally, which leads to a desynchronization between the neurons (Uhhaas and Singer 2006). Knowing this, we show thanks to Fig. 15b that, for the proposed model, electrical coupling favors the transmission and coding of information because, although it is another link between neurons, it does not prevent them from having the same behavior (i.e. they synchronize) when its intensity is changed. Conversely, we show that it is rather the synapse coupling that can, for some values of its intensity create a desynchronization which could probably have caused pathologies (see Fig. 15a). Since the electric field and the magnetic field are both plane waves, we deduce that these results are in accordance with those obtained in (Parastesh et al. 2019) where the authors studied the synchronization phenomenon between the neurons by realizing synaptic coupling and magnetic coupling (ephaptic coupling). As a result, the electric field may be another effective bridge connection to promote the exchange and coding of the signal.
Conclusion
One of the main challenges in the modeling of neurological systems is to be able to consider all the parameters that can help to establish a perfect match between the real model and the mathematical model. Using this as a motivation, we considered in this work the Hindmarsh–Rose neuron model proposed in 1984 where we introduced a new variable E that describes the effect of the electric field created by the fluctuation of the membrane potential. A basic dynamic analysis of the model obtained allowed us to highlight the rich and interesting phenomena of electrical activity. We prove that Hopf bifurcation occurs in this system when the parameters are chosen appropriately. A hysteretic dynamic has also been observed, which justifies the coexistence of two attractors in the proposed model. In reality, neurons do not evolve solitarily, so we performed a synapse coupling through the membrane potential and an electric field coupling between two neurons. It appears from the dynamic study of this coupling that the effect of the variation of the intensity of the electric field coupling on the synchronization of the two neurons is almost negligible whereas that of the intensity of the synapse coupling is very significant. As a first consequence, it can be deduced that the electric field may be another effective bridge connection to encourage the exchange and coding of the signal. In order to validate experimentally the theoretical/numerical results obtained, we presented PSpice simulations which made it possible to show the feasibility of our working hypotheses.
Footnotes
Publisher's Note
Springer Nature remains neutral with regard to jurisdictional claims in published maps and institutional affiliations.
References
- Antonopoulos CG, Martinez EB, Baptista MS. Evaluating performance of neural codes in model neural communication networks. Neural Netw. 2019;109:90–102. doi: 10.1016/j.neunet.2018.10.008. [DOI] [PubMed] [Google Scholar]
- Bao BC, Jiang P, Wu HG, Hu FW. Complex transient dynamics in periodically forced memristive chua’s circuit. Nonlinear Dyn. 2015;79:2333–2343. doi: 10.1007/s11071-014-1815-1. [DOI] [Google Scholar]
- Bao BC, Hu A, Xu Q, Bao H, Hu W, Chen M. AC-induced coexisting asymetric bursters in the improved Hindmarsh–Rose model. Nonlinear Dyn. 2018;92:1695. doi: 10.1007/s11071-018-4155-8. [DOI] [Google Scholar]
- Boccaletti S, Latora V, Moreno Y, Chavez M, et al. Complex networks: structure and dynamics. Phys Rep. 2006;424:175–308. doi: 10.1016/j.physrep.2005.10.009. [DOI] [Google Scholar]
- Boccaletti S, Bianconi G, Criado R, Wang Z, Zanin M, et al. The structure and dynamics of multilayer networks. Phys Rep. 2014;544:1–122. doi: 10.1016/j.physrep.2014.07.001. [DOI] [PMC free article] [PubMed] [Google Scholar]
- Cho YM, Rajamani R. A systematic approach to adaptive observer synthesis for nonlinear systems. IEEE Trans Autom Control. 1997;42:534–537. doi: 10.1109/9.566664. [DOI] [Google Scholar]
- Djeundam SRD, Yamapi R, Kofane TC, Azizalaoui MA. Deterministic and stochastic bifurcations in the Hindmarsh–Rose neuronal model. Chaos. 2013;23:033125. doi: 10.1063/1.4818545. [DOI] [PubMed] [Google Scholar]
- Dong J, Zhang GJ, Xie Y, Yao H, Wang J. Dynamic behavior analysis of fractional-order Hindmarsh–Rose neuronal model. Cogn Neurodyn. 2014;8:167–175. doi: 10.1007/s11571-013-9273-x. [DOI] [PMC free article] [PubMed] [Google Scholar]
- Estrada E. The structure of complex networks: theory and applications. Oxford: Oxford University Press; 2012. [Google Scholar]
- Fitzhugh R. Impulses and physiological states in theoretical models of nerve membrane. Biophys J. 1961;1:445. doi: 10.1016/S0006-3495(61)86902-6. [DOI] [PMC free article] [PubMed] [Google Scholar]
- Fitzhugh R. Mathematical models of excitation and propagation in nerve. In: Schwan HP, editor. Biological engineering. New-York: Mc Graw-Hill; 1969. [Google Scholar]
- Ge M, Jia Y, Xu Y, Yang L. Mode transition in electrical activities of neuron driven by high and low frequency stimulus in the presence of electromagnetic induction and radiation. Nonlinear Dyn. 2018;91:515–523. doi: 10.1007/s11071-017-3886-2. [DOI] [Google Scholar]
- González-Miranda JM. Complex bifurcation structures in the Hindmarsh–Rose neuron model. Int J Bifurc Chaos. 2007;17:3071–3083. doi: 10.1142/S0218127407018877. [DOI] [Google Scholar]
- Gu HG, Pan BB, Chen GR, Duan LX. Biological experimental demonstration of bifurcations from bursting to spiking predicted by theoretical models. Nonlinear Dyn. 2014;78:391–407. doi: 10.1007/s11071-014-1447-5. [DOI] [Google Scholar]
- Guckenheimer J, Holmes P. Nonlinear oscillations, dynamical systems and bifurcation of vector field. New York: Springer; 1983. [Google Scholar]
- Han C, Yu S, Wang GA. Sinusoidally driven Lorenz system and circuit implementation. Math Prob Eng. 2015;2015:706902. [Google Scholar]
- Hindmarsh JL, Rose RM. A model of the nerve impulse using two first-order differential equations. Nature. 1982;296:162–164. doi: 10.1038/296162a0. [DOI] [PubMed] [Google Scholar]
- Hindmarsh JL, Rose RM. A model of neuronal bursting using three coupled first order differential equations. Proc R Soc Lond B Biol Sci. 1984;221:87–102. doi: 10.1098/rspb.1984.0024. [DOI] [PubMed] [Google Scholar]
- Hodgkin AL, Huxley AF. A quantitative description of membrane current and its application to conduction and excitation in nerve. J Physiol. 1952;117:500–544. doi: 10.1113/jphysiol.1952.sp004764. [DOI] [PMC free article] [PubMed] [Google Scholar]
- Innocenti G, Genesio R. On the dynamics of chaotic spiking–bursting transition in the Hindmarsh–Rose neuron. Chaos. 2009;19:023124. doi: 10.1063/1.3156650. [DOI] [PubMed] [Google Scholar]
- Innocenti G, Morelli A, Genesio R, Torcini A. Dynamical phases of the Hindmarsh–Rose neuronal model: studies of the transition from bursting to spiking chaos. Chaos. 2007;17:043128. doi: 10.1063/1.2818153. [DOI] [PubMed] [Google Scholar]
- Jia C, Wang J, Deng B, Wei X, Che Y. Estimating and adjusting abnormal networks with unknown parameters and topology. Chaos. 2011;21:013109. doi: 10.1063/1.3539815. [DOI] [PubMed] [Google Scholar]
- Kaslik E. Analysis of two- and three-dimensional fractional-order Hindmarsh–Rose type neuronal models. Frac Calc Appl Anal. 2017;20:623–645. [Google Scholar]
- Kengne J, Chedjou JC, Kenne G, Kyamakya K, Kom GH. Analog circuit implementation and synchronization of a system consisting of a van der Pol oscillator linearly coupled to a Duffing oscillator. Nonlinear Dyn. 2012;70:2163–2173. doi: 10.1007/s11071-012-0607-8. [DOI] [Google Scholar]
- Kengne J, Jafari S, Njitacke ZT, Yousefi AK, Cheukem A. Dynamic analysis and electronic circuit implementation of a novel 3D autonomous system without linear terms. Commun Nonlinear Sci Numer Simul. 2017 doi: 10.1016/j.cnsns.2017.04.017. [DOI] [Google Scholar]
- Khalil HK. Nonlinear systems. 3. Upper Saddle River: Prentice Hall; 2007. [Google Scholar]
- Kivelä M, Arenas A, Barthelemy M, Gleeson JP, Moreno Y, Porter MA. Multilayer networks. J Complex Netw. 2014;2:203–271. doi: 10.1093/comnet/cnu016. [DOI] [Google Scholar]
- Kuznetsov YA. Elements of applied bifurcation theory. New York: Springer; 1998. [Google Scholar]
- Letellier C, Denis F, Aguirre LA. What can be learned from a chaotic cancer model ? J Theor Biol. 2013;322:7–16. doi: 10.1016/j.jtbi.2013.01.003. [DOI] [PubMed] [Google Scholar]
- Lopez MJ, Consegliere A, Garcia L, Lorenzo J. Simulation and control of heart rhythm dynamics. Adv Biomed Res. 2015;1:509–516. [Google Scholar]
- Louodop P, Fotsin H, Kountchou M, Bowong S. Finite-time synchronization of Lorenz chaotic systems: theory and circuits. IOP Sci. 2013;88:045002. [Google Scholar]
- Louodop P, Fotsin H, Kountchou M, Ngouonkadi LBM, Cerdeira HA, Bowong S. Finite-time synchronization of tunnel-diode-based chaotic oscillators. Phys Rev E. 2014;89:032921. doi: 10.1103/PhysRevE.89.032921. [DOI] [PubMed] [Google Scholar]
- Louodop P, Kountchou M, Fotsin H, Bowong S. Practical finite-time synchronization of Jerk systems: theory and experiment. Nonlinear Dyn. 2014;78:597. doi: 10.1007/s11071-014-1463-5. [DOI] [PubMed] [Google Scholar]
- Lu L, Jia Y, Liu W, Yang L. Mixed stimulus-induced mode selection in neural activity driven by high and low frequency current under electromagnetic radiation. Complexity. 2017;7628537:1–11. [Google Scholar]
- Lv M, Ma J. Multiple modes of electrical activities in a new neuron model under electromagnetic radiation. Neurocomputing. 2016;205:375–381. doi: 10.1016/j.neucom.2016.05.004. [DOI] [Google Scholar]
- Lv M, Wang CN, Ren GD, Ma J. Model of electrical activity in a neuron under magnetic flow effect. Nonlinear Dyn. 2016;85:1479–1490. doi: 10.1007/s11071-016-2773-6. [DOI] [Google Scholar]
- Ma J, Xu Y, Wang CN, Jin WY. Pattern selection and self-organization induced by random boundary initial values in a neuronal network. Phys A. 2016;461:586–594. doi: 10.1016/j.physa.2016.06.075. [DOI] [Google Scholar]
- Ma J, Wu F, Wang C. Synchronization behaviors of coupled neurons under electromagnetic radiation. Int J Mod Phys B. 2017;31:1650251. doi: 10.1142/S0217979216502519. [DOI] [Google Scholar]
- Ma J, Fuqiang W, Ahmed A, Jun T. Crack synchronization of chaotic circuits under field coupling. Nonlinear Dyn. 2018 doi: 10.1007/s11071-018-4307-x. [DOI] [Google Scholar]
- Ma J, Zhang G, Hayat T, Ren GD. Model electrical activity of neuron under electric field. Nonlinear Dyn. 2019;95:1585. doi: 10.1007/s11071-018-4646-7. [DOI] [Google Scholar]
- Mondal A, Upadhyay RK, Ma J, et al. Bifurcation analysis and diverse firing activities of a modified excitable neuron model. Cogn Neurodyn. 2019;13:393–407. doi: 10.1007/s11571-019-09526-z. [DOI] [PMC free article] [PubMed] [Google Scholar]
- Morris C, Lecar H. Voltage oscillations in the barnacle giant muscle fiber. Biophys J. 1981;35:193–213. doi: 10.1016/S0006-3495(81)84782-0. [DOI] [PMC free article] [PubMed] [Google Scholar]
- Negou AN, Kengne J. Dynamic analysis of a unique jerk system with a smoothly adjustable symmetry and nonlinearity: reversals of period doubling, offset boosting and coexisting bifurcations. Int J Electron Commun (AEÜ) 2018;90:1–19. doi: 10.1016/j.aeue.2018.04.003. [DOI] [Google Scholar]
- Ngouonkadi EB, Fotsin HB, Louodop F. Implementing a memristive Van der Pol oscillator coupled to a linear oscillator: synchronization and application to secure communication. IOP Sci. 2014;89:035201. [Google Scholar]
- Ngouonkadi EBM, Fotsin HB, Fotso PL, Tamba VK, Cerdeira HA. Bifurcations and multistability in the extended Hindmarsh–Rose neuronal oscillator. Chaos, Solitons Fractals. 2016;85:151–163. doi: 10.1016/j.chaos.2016.02.001. [DOI] [Google Scholar]
- Njitacke ZT, Kengne J. Complex dynamics of a 4D Hopfield neural networks (HNNs) with a nonlinear synaptic weight: coexistence of multiple attractors and remerging Feigenbaum trees. Int J Electron Commun (AEÜ) 2018;93:242–252. doi: 10.1016/j.aeue.2018.06.025. [DOI] [Google Scholar]
- Njitacke ZT, Kengne J, Negou AN. Dynamical analysis and electronic circuit realization of an equilibrium free 3D chaotic system with a large number of coexisting attractors. Optik. 2017;130:356–364. doi: 10.1016/j.ijleo.2016.10.101. [DOI] [Google Scholar]
- Njitacke ZT, Kengne J, Fonzin FT, Leutcha PB, Fotsin HB. Dynamical analysis of a novel 4-neurons based Hopfield neural network: emergences of antimonotonicity and coexistence of multiple stable states. Int J Dyn Control. 2018 doi: 10.1007/s40435-019-00509-w. [DOI] [Google Scholar]
- Paden Brad E, Shankar Sastry. A calculus for computing filippov’s differential inclusion with application to the variable structure control of robot. IEEE Trans Circuit Systems. 1987;35:73–82. doi: 10.1109/TCS.1987.1086038. [DOI] [Google Scholar]
- Panahi S, Aram Z, Jafari S, Ma M, Sprott JC. Modeling of epilepsy based on chaotic artificial neural network. Chaos Solitons Fractals. 2017;105:150–156. doi: 10.1016/j.chaos.2017.10.028. [DOI] [Google Scholar]
- Parastesh F, Azarnoush H, Jafari S, et al. Synchronizability of two neurons with switching in the coupling. Appl Math Comput. 2019;350:217–223. [Google Scholar]
- Perc M. Optimal spatial synchronization on scale-free networks via noisy chemical synapses. Biophys Chem. 2009;141:175–179. doi: 10.1016/j.bpc.2009.01.012. [DOI] [PubMed] [Google Scholar]
- Ren G, Xu Y, Wang C. Synchronization behavior of coupled neuron circuits composed of memristors. Nonlinear Dyn. 2017;88:893–901. doi: 10.1007/s11071-016-3283-2. [DOI] [Google Scholar]
- Ren GD, Zhou P, Ma J, Cai N, Alsaedi A, Ahmad B. Dynamical response of electrical activities in digital neuron circuit driven by autapse. Int J Bifurc Chaos. 2017;27:1750187. doi: 10.1142/S0218127417501875. [DOI] [Google Scholar]
- Ren G, Xue Y, Li Y, Ma J. Field coupling benefits signal exchange between Colpitts systems. Appl Math Comput. 2019;342:45–54. [Google Scholar]
- Rigatos G, Wira P, Melkikh A. Nonlinear optimal control for the synchronization of biological neurons under time-delays. Cogn Neurodyn. 2019;13:89–103. doi: 10.1007/s11571-018-9510-4. [DOI] [PMC free article] [PubMed] [Google Scholar]
- Shi X, Wang Z. Adaptive synchronization of time delay Hindmarsh–Rose neuron system via self-feedback. Nonlinear Dyn. 2012;69:21472153. [Google Scholar]
- Spitzer NC. Electrical activity in early neuronal development. Nature. 2006;444:707–712. doi: 10.1038/nature05300. [DOI] [PubMed] [Google Scholar]
- Strogatz SH, Friedman M, Mallinckrodt AJ, Mckay S. Nonlinear dynamics and chaos: with applications to physics, biology, chimestry and engineering. Comput Phys. 1994;8(5):532. doi: 10.1063/1.4823332. [DOI] [Google Scholar]
- Uhhaas PJ, Singer W. Neural synchrony in brain disorders: relevance for cognitive dysfunctions and pathophysiology. Neuron. 2006;52:155–168. doi: 10.1016/j.neuron.2006.09.020. [DOI] [PubMed] [Google Scholar]
- Wang Z, Shi X. Electric activities of time delay memristive neuron disturbed by Gaussian white noise. Cogn Neurodyn. 2020;14:115–124. doi: 10.1007/s11571-019-09549-6. [DOI] [PMC free article] [PubMed] [Google Scholar]
- Wiggins S. Introduction to applied nonlinear dynamical systems and chaos. New York: Springer; 1990. [Google Scholar]
- Wolf A, Swift JB, Swinney HL, Wastano JA. Determining Lyapunov exponents from time series. Phys D. 1985;16:285–317. doi: 10.1016/0167-2789(85)90011-9. [DOI] [Google Scholar]
- Wouapi KM, Fotsin HB, Feudjio KF, Njitacke ZT. Hopf bifurcation, offset boosting and remerging Feigenbaum trees in an autonomous chaotic system with exponential nonlinearity. SN Appl Sci. 2019;1:1715. doi: 10.1007/s42452-019-1702-y. [DOI] [Google Scholar]
- Wu KJ, Luo TQ, Lu HW, Wang Y. Bifurcation study of neuron firing activity of the modified Hindmarsh–Rose model. Neural Comput Appl. 2016;27:739–747. doi: 10.1007/s00521-015-1892-1. [DOI] [Google Scholar]
- Wu F, Ma J, Zhang G. A new neuron model under electromagnetic field. Appl Math Comput. 2019;347:590–599. [Google Scholar]
- Xu Q, Zhang QL, Bao BC, Hu YH. Non-autonomous second-order memristive chaotic circuit. IEEE Access. 2017;5:21039–21045. doi: 10.1109/ACCESS.2017.2727522. [DOI] [Google Scholar]
- Zuppa LA, Hernandez CC, Bustos AYA (2002) Finite synchronization of Lorenz-based chaotic systems. www.wseas.us/e-library/conferences/mexico2002/papers/249.pdf. Accessed 4 April 2017


