Abstract
In this study, the biological removal of nitrogen and phosphorous (BNR) was investigated by applying modified MLE-OSA technique. To conduct this study, three pilot plants scale were designed and established: 1) MLE similar to the current method used in Sari Wastewater Treatment Plant as control reactor 2) MLE-OSA4 with 4-h hydrolic retention time in sludge holding tank 3) MLE-OSA6 with 6-h hydrolic retention time in sludge holding tank. In this modified process for combining OSA technique with MLE system, two anaerobic/anoxic tanks were installed in the return sludge line with capacities of 70 and 107 l for MLE-OSA4 and MLE-OSA6, respectively. To set up the process, outlet sewage of the primary settlement tank of Sari Wastewater Treatment Plant was used. After a period of 45–60 days and reaching the steady state, the reactors were operated and the main, controllable parameters and laboratory experiments such as DO, ORP, Temperature, pH, COD, BOD5, MLSS, and nutrients (N&P) were precisely analyzed according to standard methods for examination of water and wastewater. The results showed that utilizing MLE-OSA system with 4 and 6 h hydraulic retention times decreased the ORP by around 109 ± 9 to 160 ± 25 mv and increased sludge retention time from 29 to 33 days. Moreover the percentages of phosphorus removal efficiency in MLE, MLE-OSA4 and MLE-OSA6 processes were 31 ± 5.2, 36.8 ± 1.9, and 39.4 ± 1.9 and the percentages of total nitrogen removal efficiency were 67.2 ± 7.6, 75.6 ± 4.8, and 78.5 ± 2.2 respectively. This study revealed that the modified MLE-OSA is more efficient than MLE for P and N removal. Hence it can replace this process.
Keywords: Domestic wastewater, MLE-OSA, Sludge holding tank, Nitrogen, Phosphorous, Biological nutrient removal
Introduction
Nutrients contamination in water commonly originates from point and non-point sources. Point sources are the specific discharge locations, like wastewater treatment plants (WWTP), industries, and municipal waste systems; whereas, non-point sources are discrete dischargers, like agricultural lands and storm water runoffs. Nitrogen and phosphorous concentration in human waste and wastewater effluent fluxes from domestic sources are quantified abouth 50 and 10 mg/l respectivly. Approximately 25% of all impaired water bodies are due to nutrient-related causes (e.g., nutrients, oxygen depletion, algal growth, ammonia, harmful algal blooms, biological integrity, and turbidity). The biological processes that primarily remove nitrogen are nitrification and denitrification [1–3]. With growing pollution concerns, alot of attentions have been paid to the nutrients removal and recovery at treatment plants. Newer chemical and biological nutrient removal processes are emerging to treat wastewater. Nitrogen removal mainly involves nitrification-denitrification processes; whereas, phosphorus removal includes biological uptake, chemical precipitation, or filtration [4]. Advances in secondary wastewater treatment processes such as MLE1 process and increased implementation of regulations on discharged effluents over the last few decades have led to variations in wastewater treatment ranging from simple organic carbon oxidation to the removal of nitrogen (N) and phosphorus (P) [1, 5]. The application of MLE activated sludge is the most favorable option among the biological wastewater treatment methods for domestic and industrial wastewater due to its simplicity, operational facilities, high efficiency, and appropriateness for the removal of organic matters (COD & BOD) and nutrients specially nitrogen. However, it doesn’t have good efficiency for phosphorus removal. The MLE biological system comprises an anoxic reactor followed by an aerobic tank with internal recycle stream (IR2 or MLR3). In aeration tank of MLE process, nitrification and ammonium nitrogen transformation to nitrate are performed and besides oxygen, some alkalinity is also consumed. In anoxic tank, denitrification is performed by nitrate removal and turning it into gaseous nitrogen (N2) [6]. One of the problems of this system is its relatively high excess sludge production, though it can be resolved by using OSA4 as an amendatory technique. In addition to considerable reduction in biological sludge, it brings about an increase in the organic matter removal efficiency and nutrient matter removal, simultaneously. The OSA process consists of an aeration tank, settling tank, and an anoxic/anaerobic tank in return sludge line. This process can be used for aerobic systems as well as for nutrient removal with a combination of anaerobic, anoxic, and aerobic process [7]. Due to the need to reduce nitrogen and phosphorous amount in effluent during recent years, it is feasible to employ OSA technique to increase nitrogen removal through nitrification and denitrification by MLE process and at the same time increase phosphorus biological removal efficiency, decrease high excess biological sludge, improve sludge settlement, and reduce the costs as well [6]. A group of microorganisms called phosphorus accumulating organisms (PAOs) are responsible for phosphorous removal. They are capable of storing phosphate as intercellular polyphosphate and can finally lead to phosphorus removal from liquid phase via evacuation of PAOs in waste sludge. PAOs enhance cell growth and phosphorus consumption in systems with an appropriate reactor combination in which phosphorus collecting organisms are used more competitively than other bacteria. Enhanced biological phosphorus removal (EBPR) process is described by activated sludge rotation of anaerobic and aerobic intermittent condition. When microorganisms are exposed to anaerobic conditions without a source of nutrition, they cannot produce energy and have to consume ATP as an energy source. During anaerobic depletion of essential nutrient (hunger period), ATP is consumed. After returning to a nutrient-rich aerobic reactor, microorganisms have to compensate their required energy before commencing biological synthesis because cellular synthesis cannot be performed with inadequate ATP storage. In this condition, the food consumption is used for the catabolism process to supply the energy required by the microorganism. Therefore, OSA process stimulates the catabolic activity resulting in a separation between catabolism and anabolism; increase in uncoupling energy reduces the efficiency of microbial mass [8].
Chudoba et al., by comparing the sludge yield in OSA process to the conventional activated sludge (CAS), found that the sludge yield reduced between 20% to 60%, with the sludge yield coefficient reduction from 0.28–0.48 to 0.13–0.297 in the OSA system, respectively. On the other hand, the SVI amount in the OSA process was much lower than that found in CAS. Furthermore, controlling the efficiency of oxidation reduction potential (ORP) in anaerobic tank at about −250 mv revealed a reduction in the excess sludge to 36% in comparison with ORP of +100 mv and to 58% compared to CAS. These findings indicate that OSA process can result in excess sludge yield reduction, COD removal, improvement in the sludge settlement as well as phosphorous removal efficiency from 19% to 42% [9, 10].
Demir et al., studied the efficiency of OSA process in reducing biological sludge and found out that the cellular mass production coefficient in a conventional activated sludge system equipped with an OSA reactor reduced from 0.52 to 0.2 g biomass/g COD after 50 days of operation with an ORP of −250 mv. Additionally, the MLSS concentration reduced from 3000 to 2500 mg/l and this process had a good efficiency in nitrogen and phosphorus removal compared to the control reactor [11].
Novak et al., applied SBR reactor for nutrients removal and sludge reduction while the reactor was operated 4 cycles per day. It was shown that establishing anaerobic-aerobic and anoxic cycles in the reactor led to 60% reduction in sludge production and a considerable decrease in nutrients in comparison to control reactor [12].
Vitanza et al., have investigated the excess biological sludge volume minimization by an OSA lab-scale plant in anaerobic phase of the conventional activated sludge with real influent wastewater. The results demonstrated that in addition to good settlement and appropriate efficiency in COD, BOD, and nitrogen removal, cellular mass production coefficient value (Y) reduced from 0.6 to 0.4 and 0.33 g biomass/g COD. The ORP value was −160 mv, the wastewater influent COD average was 390 mg/l, COD removal efficiency was 76%, ammonia nitrogen removal was 82% and phosphorous removal was maximally 28%. This study was similar to the one conducted by Wang et al. The results achieved from the MLE-OSA are consistent with the mentioned studies [13].
Takdastan et al. studied Effect of Oxic-Settling Anoxic Process (OSA) on Operation Parameters and Biological Excess Sludge Reduction in Activated Sludge as One of the solutions for sludge production is to reduce that via decreasing the yield coefficient by oxic-settling anoxic process with different oxidation reduction potential (ORP). Results showed that in anoxic and anaerobic phase of the sludge holding tank, the sludge storage after 7 h in the reactor with ORP = −238 decreased the yield coefficient from 0.58 in the control reactor to 0.25 g of biomass in g of COD. Consequently, the excess sludge decreased by almost 60%. On the other hand, the SVI reduced to less than 40 ml/g, compared to the control reactor (92 ml/g). Using holding tanks in aerobic conditions with ORP greater than 230 mv could cause appropriate settling and lead to a high efficiency of COD, Nitrogen and phosphorous removal from wastewater [14, 15].
One of the benefits of the MLE-OSA modified process is the reduction of biological sludge along With decreasing the yield coefficient by oxic-settling anoxic process with different oxidation reduction.
Potential (ORP) in biological reactors. As an alternative solution of sludge reduction, recently a Biological treatment combined inserting anaerobic/anoxic holding tank such as MLE has been developed for minimizing excess sludge production [16]. There is therefore considerable impetus to explore and develop strategies and technologies for reducing excess sludge production in biological wastewater treatment processes [17, 18]. (i) Endogenous metabolism,; (ii) uncoupling metabolism (iii) oxic settling-anaerobic [19, 20]; (iv) alkaline heat treatment [20, 21]; (v) oxidation of a part of produced sludge is done by such oxidizing materials as chlorine and ozone [22, 23].
According to recent studies, despite the necessity for nitrogen and phosphorous removal from effluent, MLE process is not efficient. Hence, the aim of this study is to modify MLE process and integrate it with OSA process in order to effectively remove the nitrogen and phosphorous, enhance sludge settlement ability, reduce excess biological sludge, decrease the costs, and better protect the environment. The novelty of this research is the use of a real wastewater fed in an MLE-OSA pilot plant. Indeed, in recent years almost all the studies report the feasibility of the OSA process in laboratory-scale plant fed with synthetic wastewater, whereas very few experimental works are related to OSA pilot plants using real wastewater.
Material and methods
Pilot study
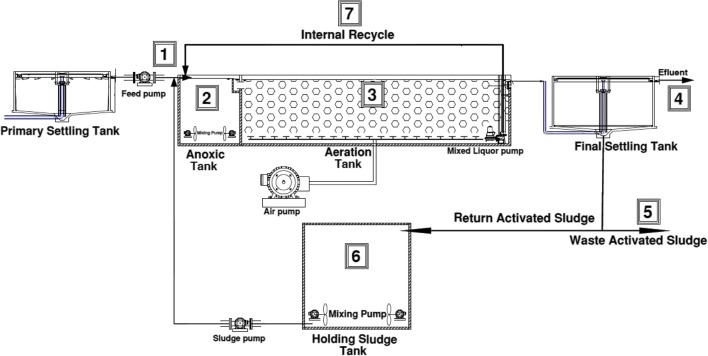
To accomplish this research, a pilot study was designed and conducted with the modified MLE process using OSA technique, as shown in Fig. 1. As it is illustrated, in the return sludge line of MLE process, one anaerobic/anoxic holding reservoir has been inserted and the sampling sites at the time of operation have also been labelled with number.
Fig. 1.
The general schematic of MLE-OSA pilot study
Start-up and operation of the pilot study
To start up the pilot study, the contents of an aeration tank and an anoxic tank of Sari Treatment Plant were used with an average MLSS of 3000 ± 35 mg/L. Peristaltic pumps were also used to precisely supply inflow (Qin) of 23 L/h, 80% recirculation of the activated sludge (QRAS) of 18.4 L/h, and 147% of internal recycleor mixed liquor recycle (MLR) of 32 L/h. Several aeration pumps with a capacity of 25 L/min were used to supply and maintain the concentration of dissolved oxygen (DO) at about 2–3 mg/L in aeration reactor. Bubble diffuser was embedded at the bottom of the aeration tank for uniform air distribution. After starting up the pilot with a real urban wastewater for each of the proposed conditions, a 45- to 60-day period lasted for operation and maintenance of a sustainable state for the system. The results of all analyses were satisfactory with less than 10% variations during the timespan. And therefore, it was concluded that the system has reached the steady state. Four categories of experiments performed at each sampling station included: (1) Control indexes for monitoring and maintaining the environmental optimal conditions as well as the function of microorganisms including temperature, pH, and dissolved oxygen (DO) tests. (2) Operating parameters for maintaining optimal conditions, such as determining sludge quality and system performance including mixed liquor suspended solids (MLSS) in the aeration tank, sludge volume index (SVI), and sludge retention time (SRT). (3) Main parameters entitled appropriated criteria for achieving sustainable conditions including COD, TSS and pH of the effluent. (4) Determining nutrients comprising nitrogen and phosphorus. All the mentioned parameters were performed according to “Standard Method for the Examination of Water and Wastewater”, edition 2014 [24].
After the three pilot studies of MLE, MLE-OSA4, and MLE-OSA6 processes reached a steady state, the MLE system was used as the control system to be compared with the modified OSA technique. To investigate the aims of the study, modified process was done using sludge holding tank (SHT) in 2 periods with 70 and 107 l capacities and hydraulic retention times of 4 and 6 h in return sludge line.
The determined physicochemical parameters in another 45-day period of operation and maintenance have been analyzed and investigated both daily and weekly to evaluate the quality of effluent for organic matter and nutrients removal, sludge production rate, sludge properties, and the performance of the modified MLE-OSA process. Moreover, it was compared with MLE process.
Materials and equipment
All the materials used in the lab were purchased from Merck Co, Germany. The equipment contained ORP meter model: AZ instrument corp., pH meter model: AQUALYTIC, DO meter AQUALYTIC model: AL20Oxi, weighing scale made by METTLER model PJ300, spectrophotometer HACH model DR6000.
Results
In this research, three processes were investigated including MLE, MLE-OSA4, and MLE-OSA6 with 4 and 6-h hydraulic retention time, respectively, for urban wastewater treatment in order to remove phosphorus and nitrogen during 45-day periods of operation and maintenance. The results will be presented in the following sections.
Wastewater characteristics
The primary settling tank effluent of Sari Wastewater Treatment Plant was used to supply real wastewater for pilot feeding. Its characteristics are presented in Table 1. As it is illustrated, the pH of the influent wastewater was in neutral range, while it had a considerable amount of organic matter, nitrogen and phosphorus.
Table 1.
Characteristics of wastewater used as influent of MLE-OSA pilot
| Parameter | Min | Max | Average |
|---|---|---|---|
| COD | 171 | 351 | 269 ± 32 |
| BOD5 | 149 | 273 | 216 ± 25 |
| TN | 30 | 53 | 41 ± 4 |
| TP-P | 2.43 | 8.47 | 3.96 ± 0.83 |
| pH* | 7.47 | 7.77 | 7.6 ± 0.076 |
*Al as mg/L except pH
The processes’ efficiency in phosphorus removal
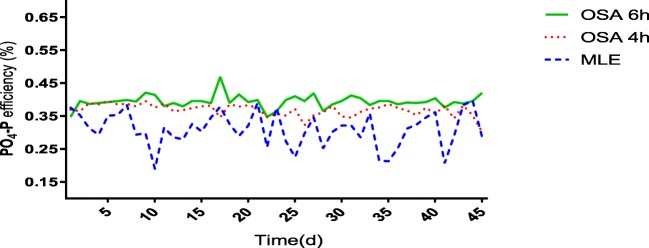
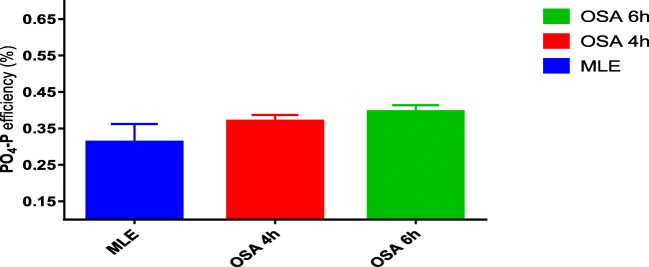
Figures 2 and 3 display the phosphorous removal efficiency fluctuations in the 45-day period of operation and maintenance of the studied processes. As it is shown, the calculated average values of phosphorus removal rate during the 45-day period of each process after reaching the steady state in the processes of MLE, MLE-OSA4 and MLE-OSA6 were 31 ± 5.2, 36.8 ± 1.9 and 39.4 ± 1.9%, respectively. According to Figures, the rate of phosphorous removal efficiency in the MLE-OSA4 and in MLE-OSA6 increased by 15.7% and 21.3% compared to the control process or MLE, respectively.
Fig. 2.
Variation of phosphorus removal efficiency in the studied processes during the reactor operation period
Fig. 3.
Variation of phosphorus removal efficiency in the studied processes
The processes’ efficiency in nitrogen removal
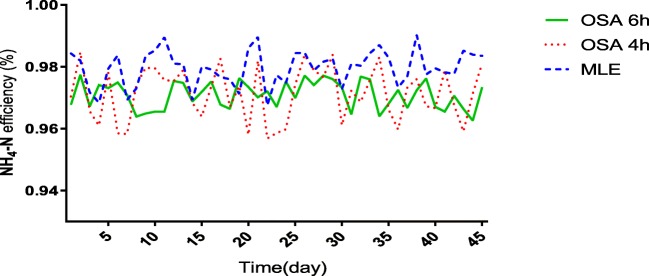
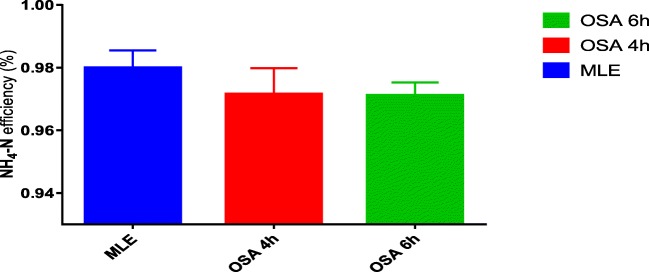
Changes in the calculated ammonia nitrogen removal efficiency values over a 45-day period of operation and maintenance in the studied processes when the reactor reached the steady state are illustrated in Figs. 4 and 5. As it is shown in Fig. 4, the average percentages of ammonia nitrogen removal efficiency were 97.96 ± 0.6, 97.13 ± 0.8 and 97.08 ± 0.4 in MLE, MLE-OSA4, and MLE-OSA6 processes, respectively. Ammonia nitrogen (NH4-N) removal efficiencies in MLE-OSA4 and MLE-OSA6 processes decreased by 0.85% and 0.89% compared to the MLE, respectively, as clearly demonstrated in Figs. 4 and 5.
Fig. 4.
Variation of ammonia nitrogen (NH4-N) removal efficiency in the studied processes during time
Fig. 5.
Variation of ammonia nitrogen (NH4-N) removal efficiency average in the studied processes
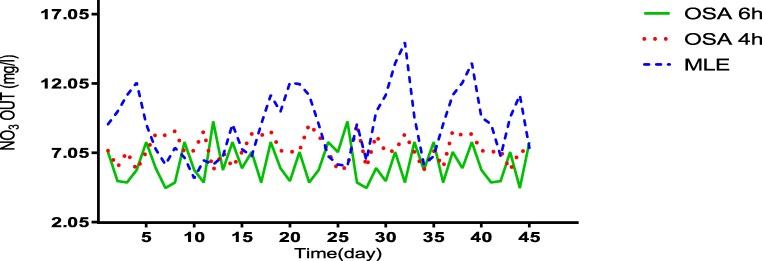
Figures 6 and 7 show the nitrate concentration changes in the effluent during the 45-day period of operation and maintenance of the studied processes after reaching the reactor to the steady condition. The average of nitrate concentration at MLE, MLE-OSA4 and MLE-OSA6 processes were 9.073 ± 2.404, 7.324 ± 0.991 and 6.236 ± 1.340 mg/L, respectively. According to Figs. 6 and 7, the nitrate concentration in the effluent of MLE-OSA4 and MLE-OSA6 has decreased by 19.27% and 31.26%, respectively, compared to the effluent NO3-N concentration in the control process or MLE.
Fig. 6.
Variation of nitrate concentration in the effluent at the studied processes during time
Fig. 7.
Variation of nitrate concentration in the effluent at the studied processes
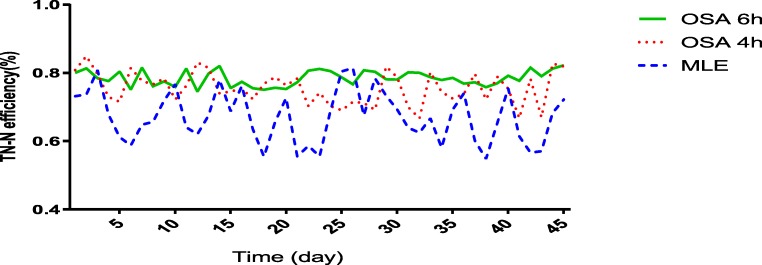
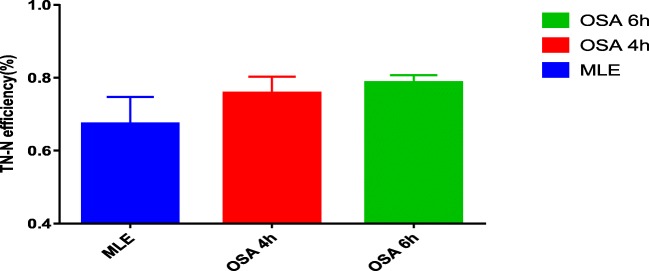
Changes in the total nitrogen removal efficiency in the 45-day period of operation and maintenance of the studied processes after reaching the reactor to the steady state are summed up in Figs. 8 and 9. The average percentages of total nitrogen removal efficiencies at MLE, MLE-OSA4 and MLE-OSA6 processes were 67.2 ± 7.6, 75.6 ± 4.8 and 78.5 ± 2.2, respectively.
Fig. 8.
Variation of total nitrogen removal efficiency in effluent at the studied processes during time
Fig. 9.
Variation of total nitrogen removal efficiency average in effluent at the studied processes during time
As it is demonstrated in Figs. 8 and 9, the total nitrogen removal efficiencies in MLE-OSA4 and MLE-OSA6 processes increased by 3.69% and 14.39% compared to MLE, respectively.
Processes comparison
The efficiency of three processes under study in removal of total nitrogen, nitrogen nitrate, ammonia nitrogen and phosphorous is displayed in Table 2. The data presented in the table show a better efficiency of modified process in the removal of the mentioned parameters.
Table 2.
Capability of MLE, MLE-OSA4 and MLE-OSA6 in nitrogen and phosphorous removal (percentage) and their concentrations in effluent (mg/L)
| Process | PO4−3 | TN-N | NH4+-N | NO3-N | |||
|---|---|---|---|---|---|---|---|
| Effluent concentration | Removal efficiency% | Effluent concentration | Removal efficiency% | Effluent concentration | Removal efficiency% | Effluent concentration | |
| MLE | 2.39 | 31.2 | 11.37 | 67.18 | 0.38 | 97.97 | 9.07 |
| MLE-OSA4 | 2.15 | 36.82 | 9.02 | 75.56 | 0.68 | 97.13 | 7.32 |
| MLE-OSA6 | 1.99 | 39.42 | 8.43 | 78.46 | 0.76 | 97.09 | 6.23 |
Discussion
The processes’ efficiency in phosphorus removal
The results revealed that the average values of phosphorus removal efficiency in the 45-day period of operation and maintenance after reaching the steady state in MLE, MLE-OSA4 and MLE-OSA6 processes were 31 ± 5.2, 36.8 ± 1.9, and 39.4 ± 0.9%, respectively. According to Fig. 2, it can be concluded that, inserting anaerobic/anoxic holding tank in the return sludge line increases the phosphorous removal efficiency in MLE-OSA4 up to 15.7% and in MLE-OSA6 up to 21.3% compared to the control process or MLE. It can be interpreted that phosphorous has a vital role in the cell energy transfer mechanism through ATP and polyphosphates. By generating energy in the oxidation and reduction reactions, ADP is converted to ATP along with an energy of 7.4 Kcal per mole. This energy is saved in phosphorus bond and when the cell consumes the energy, ATP is converted to ADP and as a result phosphorus will be released [6]. Numorous bacteria can store a lot of phosphorous in the form of polyphosphates in their own cells. PAOs, in anaerobic conditions, absorb fermentation products (volatile fatty acids) in their cells and continuously release phosphorus from the stored polyphosphates. In aerobic conditions, the energy is generated by oxidation of stored products and the intracellular polyphosphates storage will increase. The phosphate storage in the form of intracellular polyphosphate in the tissue of slow-growing bacteria (PAOs) leads to the removal of phosphorus from the liquid phase, its reduction in the wastewater effluent and as a result disposal of phosphorus rich sludge [25].
Studies have pointed out that OSA process can increase the phosphorus removal. According to the Chudoba et al., the phosphorus removal efficiency in the conventional activated sludge process with OSA (CAS-OSA) in the presence of PAOs,was about 19% to 42% (PO43−-P). This result is almost similar to the results achieved by the present study. On the other hand, Ye et al., have reported phosphorus removal in CAS-OSA efficiency was about 48% to 58% (TP), which is slightly more than that of the present study [10, 26]. According to Troiani et al., the phosphorus removal in CAS-OSA process, without comparing with the CAS process, was 62% (TP) which is more than what we found the present study [10, 26, 27]. Similarly, Saby et al., found out that the phosphorus removal efficiency in the MBR process modified by OSA was about 28–63%, which is greater than the results of this study [28].
According to Datta et al., the phosphorus removal efficiency in the SBR process modified with OSA process was about 90%, which was a lower percentage of phosphorus removal in comparison to the control process [29].
Goel and Noguera showed the enhanced biological phosphorus removal (EBPR) in the SBR-OSA process and reported that SBR-OSAEBPR had a phosphorus removal of 98% which was more than EBPR SBR control (84%). The reason for increase in the phosphorus removal efficiency in the enhanced process is the biological phosphorus removal (EBPR) process, which is described by utilizing the OSA process through the intermittence of active sludge recirculation by anaerobic and aerobic conditions [30]. This process could reduce the excess sludge and phosphorus concentration simultaneously. This finding is due to the ability of the OSA process in the selection of fermentative bacteria for the formation of fermentation in anaerobic tank of volatile fatty acids that increase the metabolism of EBPR [29, 30].
Wang et al., examined the phosphorus biological removal performance and efficiency. Moreover, the structure of the microbial community was analyzed to discover the effect of the inserted anaerobic tank in the OSA process on the function and efficeincy of bilogical removal of phosphorus. The total phosphorus (TP) amount in aerobic sludge of the OSA process was twice the value of the reference process, while the amount of phosphorus in the sediment was almost equal in both processes.
The result showed that the biological phosphorous accumulation leads to higher phosphorous removal efficiency in OSA system. It can be concluded that in OSA system, some phosphate accumulator bacteria may exist that have the ability to absorb excess phosphate in aerobic conditions. However, most of the microbiological analysis results reported in the articles indicate that a large number of identified bacteria exist in the OSA anoxic reactor whose existence and role require further investigation [7].
Zhou et al., worked on the conventional activated sludge process with anaerobic/anoxic phases or AO equipped with OSA. They reported a decline in the phosphorus removal efficiency in A + OSA (33.6%) compared to AO (43.9%). The present research results demonstated that the effluent phosphorous removal in 45-day period of operation and maintenance had an increase for the MLE process from 18.9–37.5%, for MLE-OSA4 from 30.2 to 39.6%, and finally for MLE-OSA6 from7.8–34.46% (Fig. 2). [31, 32].
Efficiency of processes in ammonia nitrogen removal
Ammonia nitrogen removal efficiency had a slight decrease in a pilot modified system equipped with the OSA technique in the 45-day period of each process after reaching the steady state (MLE-OSA4 and MLE-OSA6 were 97.13%, 97.08%, respectively) in comparison to MLE (average 97.96%). This was due to the anaerobic degradation of nitrifiers in a sludge holding tank (SHT) [33]. Cell destruction and lysis, and ammonification under anaerobic condition and apoptosis in SHT occur at 4- and 6-h retention time. The cell destructed protoplasm releases the ammonia nitrogen or ammonium ion into the surrounding solution; subsequently with the returning of sludge from anoxic to aerobic tank, part of the ammonium ion is absorbed under the assimilation process, and some other part is oxidized by the nitrified bacteria and is converted to nitrate (biological nitrification), and the remainder is disposed by effluent. Therefore, the ammonia nitrogen removal efficiency in MLE-OSA4 and MLE-OSA6 decreases by 0.85% and 0.89%, respectively, in comparison with the control process (MLE) [34]. Since the effluent ammonia nitrogen standard is 2.5 mg/L, the increase to 0.89% may not prevent us from achieving the global wastewater standards.
Nitrate concentration in effluent
The effluent nitrate concentration average value after reaching the steady state in the 45-day period in control system (MLE) was 9.037 ± 2.404 mg/L, though it decreased in the MLE-OSA4 and MLE-OSA6 processes to 7.324 ± 0.991 mg/L and 6.236 ± 1.340 mg/L respectively. This is the logical result of using sludge holding tank (SHT) and denitrification that occurred in it. The increase in denitrification in the OSA process leads to a decrease in nitrate in effluent in MLE-OSA4 and MLE-OSA6 19.27% and 31.26% in comparison with the MLE process, respectively. The results are in agreement with the study conducted by Saby et al., who found out that there was a significant nitrate concentration reduction in the effluent in OSA which was attributed to denitrification [28].
The efficiency of processes in removing total nitrogen
The amount of total nitrogen removal efficiency average concentration after reaching the steady state in the 45-day period of operation and maintenance in the control system (MLE), MLE-OSA4 and MLE-OSA6 processes were 67.2 ± 0.076, 75.6 ± 0.048, and 78.5 ± 0.022%, respectively. This finding on the total nitrogen removal efficiency average differences in the pilot study revealed that TN removal rate increased in MLE-OSA4 and MLE-OSA6 processes up to 3.69% and 14.39%, respectively, in comparison with the control system (MLE).
The total nitrogen removal efficiency using CAS-OSA reported by Ye et al., was 28–30% [26], Li et al., was 72.8% [35] Wang et al., was 59% [7] andTroiani et al., was 79% [27] which were all consistent with the results of this research. Though the nitrogen removal efficiency in SBR-OSA has been reported at about 100% in Datta et al. studies [29].
Zhou et al. worked on conventional activated sludge process with anaerobic/anoxic phases or AO equipped with OSA and reported nitrogen removal efficiency, in terms of NH4-N, less than that of the control system (MLE), while it was higher than the control system in terms of TN [32]. They also mentioned a lower nitrification efficiency in the A + OSA process, which could be attributed to the anaerobic cellular degradation of nitrifying microorganisms in the anaerobic reactor. However, the TN average removal efficiency in A + OSA was higher than the AO system due to the availability of a more amount of carbon source produced from cell lysis and hydrolysis reactions which were used for denitrification in the anoxic reservoir [31].
In term of nitrogen removal, most of the researchers such as Datta et al. [29], Troiani et al. [27], Ye et al. [26] showed no negative impact of OSA process on nitrogen removal. According to the self-destruction process in the sludge holding tank (SHT) and releasing of cBOD (organic carbon) and its transfer to the anoxic reactor with return line, increase in BOD:TKN ratio resulted in increase in nitrate removal efficiency in the denitrification process. Table 3 reveals the results of both previous studies and the present study on various active sludge process equipped with OSA for the nitrogen and phosphorus removal.
Table 3.
Nitrogen and phosphorus removal reported in previous studies [21]
| Reference | phosphorous removal efficiency | Nitrogen removal efficiency | Wastewater type | Process | ||
|---|---|---|---|---|---|---|
| Control | OSA | Control | OSA | |||
| Chudoba (1992) | 1–16 a | 19–42 a | – | – | synthetic | CAS-OSA |
| Ye (2008) | 49 C | 48–58 c | b30 | b28–30 | synthetic | CAS-OSA |
| Wang (2008) | – | 63 c | – | b59 | – | CAS-OSA |
| Troiani (2011) | 54 c | 62 c | b67 | b79 | – | CAS-OSA |
| Saby (2003) | 64c | 28–63 c | – | – | synthetic | MBR-OSA |
| Datta (2009) | 95 a | 90 a | d100 | d100 | synthetic | SBR-OSA |
| Goel and Noguera (2006) | 84 a | 98 a | – | – | synthetic | SBR-OSA |
| Zhou (2015) | – | – | b43e83 | b57e77 | Urban | OSA + A |
| This Study | 31c | 36 c | e70.23 | e78.88 | Urban | MLE-OSA4 |
| This Study | 31c | 39 c | e70.23 | e79.98 | Urban | MLE-OSA6 |
aPercentage based on PO43–P removal
bPercentage based on TN removal
cPercentage based on TP removal
dPercentage based on NH3-N removal
ePercentage based on NH4-N removal
Conclusion
This study demonstrates that the modified MLE-OSA system has an acceptable performance for nutrients, nitrogen and phosphorous removal efficiency. The average removal efficiency for contaminants such as phosphorous and total nitrogen in the MLE system modified with OSA were also more than the control system and their amount in the effluent were always less than the MLE system.
Acknowledgements
This article is extracted from the Ph.D thesis and belongs to the Ahvaz Branch Islamic Azad University. It is also a part of the research project No 7337/150. The authors would like to aknowledge Mazandaran Water & Wastewater Co, Health Science Research Center of Mazandaran University of Medical Sciences, Mr. Ehsan Mehdizadeh, the responsible operator of the Sari Sewage Treatment Plant and his colleagues, the officials and staff of Sari Sewage Treatment Plant. Finally we appreciate the lab chief for his support of this project.
Compliance with ethical standards
Conflict of interest
The author declare that they have no conflict of interest.
Footnotes
Modified Ludzack Ettinger
Internal Recycle
Mixed Liquor Recycle
Oxic Settling Anaerobic Process
Publisher’s note
Springer Nature remains neutral with regard to jurisdictional claims in published maps and institutional affiliations.
Contributor Information
Behzad Nikpour, Email: bezazadnikpour_2005@yahoo.com, Email: behzadnikpour_2005@yahoo.com.
R. Jalilzadeh Yengejeh, Email: r.jalilzadeh@iauahvaz.ac.ir
A. Takdastan, Email: Afshin_ir@yahoo.com
A. H. Hassani, Email: ahh1346@gmail.com
M. A. Zazouli, Email: zazoli49@yahoo.com
References
- 1.Zazouli MA, Safarpour M, Dobaradaran S, Veisi F. Modeling of nitrate removal from aqueous solution by fe-doped TiO2 under UV and solar irradiation using response surface methodology. Global Nest J. 2015;17(2):379–388. doi: 10.30955/gnj.001577. [DOI] [Google Scholar]
- 2.Mohseni-Bandpi A, Elliott DJ, Zazouli MA. Biological nitrate removal processes from drinking water supply-a review. J Environ Health Sci Eng. 2013;11(1):35. doi: 10.1186/2052-336X-11-35. [DOI] [PMC free article] [PubMed] [Google Scholar]
- 3.Zazouli MA, Dianatitilaki R, Safarpour M. Nitrate removal from water by Nano zero Valent Iron in the presence and absence of ultraviolet light. Journal of Mazandaran University of Medical Sciences. 2014;24(113):151–161. [Google Scholar]
- 4.Naghizadeh A, Mahvi A, Vaezi F, Naddafi K. Evaluation of hollow fiber membrane bioreactor efficiency for municipal wastewater treatment. J Environ Health Sci Eng. 2008;5(4):257–268. [Google Scholar]
- 5.Naghizadeh A, Mahvi AH, Mesdaghinia AR, Alimohammadi M. Application of MBR technology in municipal wastewater treatment. Arab J Sci Eng. 2011;36(1):3–10. doi: 10.1007/s13369-010-0007-7. [DOI] [Google Scholar]
- 6.Metcalf W. Wastewater engineering: treatment and reuse. New York: McGraw Hill; 2003. Metcalf and Eddy wastewater engineering: treatment and reuse. [Google Scholar]
- 7.Wang J, Zhao Q, Jin W, Lin J. Mechanism on minimization of excess sludge in oxic-settling-anaerobic (OSA) process. Front Environ Sci Eng China. 2008;2(1):36–43. doi: 10.1007/s11783-008-0001-4. [DOI] [Google Scholar]
- 8.Khursheed A, Sharma MK, Tyagi VK, Khan AA, Kazmi AA. Specific oxygen uptake rate gradient–another possible cause of excess sludge reduction in oxic-settling-anaerobic (OSA) process. Chem Eng J. 2015;281:613–622. doi: 10.1016/j.cej.2015.06.105. [DOI] [Google Scholar]
- 9.Chudoba P, Morel A, Capdeville B. The case of both energetic uncoupling and metabolic selection of microorganisms in the OSA activated sludge system. Environ Technol. 1992;13(8):761–770. doi: 10.1080/09593339209385207. [DOI] [Google Scholar]
- 10.Chudoba P, Chudoba J, Capdeville B. The aspect of energetic uncoupling of microbial growth in the activated sludge process-OSA system. Water Sci Technol. 1992;26(9–11):2477–2480. doi: 10.2166/wst.1992.0766. [DOI] [Google Scholar]
- 11.Demir Ö, Filibeli A. The investigation of the sludge reduction efficiency and mechanisms in oxic–settling–anaerobic (OSA) process. Water Sci Technol. 2016;73(10):2311–2323. doi: 10.2166/wst.2016.076. [DOI] [PubMed] [Google Scholar]
- 12.Novak JT, Chon DH, Curtis BA, Doyle M. Biological solids reduction using the cannibal process. Water Environ Res. 2007;79(12):2380–2386. doi: 10.2175/106143007X183862. [DOI] [PubMed] [Google Scholar]
- 13.Vitanza R, Diociaiuti T, De Arana-Sarabia ME, Colussi I, Cortesi A, Gallo V. Preliminary evaluation of sludge minimization by a lab-scale OSA (Oxic-Settling-Anaerobic) system. Chem Eng Trans. 2016;49:469–474. [Google Scholar]
- 14.Takdastan A, Karimi F, Orooji N. Effect of Oxic-settling anoxic process on operation parameters and biological excess sludge reduction in sequencing batch reactor activated sludge. Journal of Mazandaran University of Medical Sciences. 2018;28(162):128–140. [Google Scholar]
- 15.Takdastan A, Eslami A. Application of energy spilling mechanism by para-nitrophenol in biological excess sludge reduction in batch-activated sludge reactor. Int J Energy Environ Eng. 2013;4(1):26. doi: 10.1186/2251-6832-4-26. [DOI] [Google Scholar]
- 16.Takdastan A, Mehrdadi N, Azimi A, Torabian A, Bidhendi G. Investigation of intermittent chlorination system in biological excess sludge reduction by sequencing batch reactors. J Environ Health Sci Eng. 2009;6(1):53–60. [Google Scholar]
- 17.Takdastan A, Azimi AA, Jaafarzadeh N. Biological excess sludge reduction in municipal wastewater treatment by chlorine. Asian J Chem. 2010;22(3):1665. [Google Scholar]
- 18.Fazelipour M, Takdastan A, Jou MS. Survey on chlorine application in sequencing batch reactor waste sludge in order to sludge minimization. Asian J Chem. 2011;23(7):2994. [Google Scholar]
- 19.Takdastan A, Mehrdadi N, Torabian A, Azimi AA, Bidhendi GN. Investigation of excess biological sludge reduction in sequencing bach reactor. Asian J Chem. 2009;21(3):2419–2427. [Google Scholar]
- 20.Takdastan A, Pazoki M. Study of biological excess sludge reduction in sequencing batch reactor by heating the reactor. Asian J Chem. 2011;23(1):29–33. [Google Scholar]
- 21.Pazoki M, Takdastan A, Jaafarzadeh N. Investigation of minimization of excess sludge production in sequencing batch reactor by heating some sludge. Asian J Chem. 2010;22(3):1751–1759. [Google Scholar]
- 22.Bortoli M, Kunz A, Prá MC, Silva ML, Cé A, Soares HM. Simultaneous removal of nitrogen and organic carbon from swine wastewater using the pre-denitrification/nitrification process. Rev Ambient Água. 2019;14(2).
- 23.Wałęga A, Chmielowski K, Młyński D. Nitrogen and phosphorus removal from sewage in biofilter–activated sludge combined systems. Pol J Environ Stud. 2019;28:1939–1947. doi: 10.15244/pjoes/89898. [DOI] [Google Scholar]
- 24.Federation WE, American Public Health Association . Standard methods for the examination of water and wastewater. Washington, DC: American Public Health Association (APHA); 2014. [Google Scholar]
- 25.Bitton G. Wastewater microbiology. Hoboken: Wiley; 2005. [Google Scholar]
- 26.Ye FX, Zhu RF, Li Y. Effect of sludge retention time in sludge holding tank on excess sludge production in the oxic-settling-anoxic (OSA) activated sludge process. Journal of Chemical Technology & Biotechnology: International Research in Process, Environmental & Clean Technology. 2008;83(1):109–114. doi: 10.1002/jctb.1781. [DOI] [Google Scholar]
- 27.Troiani C, Eusebi AL, Battistoni P. Excess sludge reduction by biological way: from experimental experience to a real full scale application. Bioresour Technol. 2011;102(22):10352–10358. doi: 10.1016/j.biortech.2011.08.124. [DOI] [PubMed] [Google Scholar]
- 28.Saby S, Djafer M, Chen GH. Effect of low ORP in anoxic sludge zone on excess sludge production in oxic-settling-anoxic activated sludge process. Water Res. 2003;37(1):11–20. doi: 10.1016/S0043-1354(02)00253-1. [DOI] [PubMed] [Google Scholar]
- 29.Datta T, Liu Y, Goel R. Evaluation of simultaneous nutrient removal and sludge reduction using laboratory scale sequencing batch reactors. Chemosphere. 2009;76(5):697–705. doi: 10.1016/j.chemosphere.2009.02.040. [DOI] [PubMed] [Google Scholar]
- 30.Goel RK, Noguera DR. Evaluation of sludge yield and phosphorus removal in a cannibal solids reduction process. J Environ Eng. 2006;132(10):1331–1337. doi: 10.1061/(ASCE)0733-9372(2006)132:10(1331). [DOI] [Google Scholar]
- 31.Zhou Z, Qiao W, Xing C, Wang C, Jiang LM, Gu Y, Wang L. Characterization of dissolved organic matter in the anoxic–oxic-settling-anaerobic sludge reduction process. Chem Eng J. 2015;259:357–363. doi: 10.1016/j.cej.2014.07.129. [DOI] [Google Scholar]
- 32.Zhou Z, Qiao W, Xing C, An Y, Shen X, Ren W, Jiang LM, Wang L. Microbial community structure of anoxic–oxic-settling-anaerobic sludge reduction process revealed by 454-pyrosequencing. Chem Eng J. 2015;266:249–257. doi: 10.1016/j.cej.2014.12.095. [DOI] [Google Scholar]
- 33.Salem S, Moussa MS, Van Loosdrecht MC. Determination of the decay rate of nitrifying bacteria. Biotechnol Bioeng. 2006;94(2):252–262. doi: 10.1002/bit.20822. [DOI] [PubMed] [Google Scholar]
- 34.Chen GH, An KJ, Saby S, Brois E, Djafer M. Possible cause of excess sludge reduction in an oxic-settling-anaerobic activated sludge process (OSA process) Water Res. 2003;37(16):3855–3866. doi: 10.1016/S0043-1354(03)00331-2. [DOI] [PubMed] [Google Scholar]
- 35.Li X, Liu X, Wu S, Rasool A, Zuo J, Li C, Liu G. Microbial diversity and community distribution in different functional zones of continuous aerobic–anaerobic coupled process for sludge in situ reduction. Chem Eng J. 2014;257:74–81. doi: 10.1016/j.cej.2014.07.028. [DOI] [Google Scholar]
- 36.Ferrentino R, Langone M, Merzari F, Tramonte L, Andreottola G. A review of anaerobic side-stream reactor for excess sludge reduction: configurations, mechanisms, and efficiency. Crit Rev Environ Sci Technol. 2016;46(4):382–405. doi: 10.1080/10643389.2015.1096879. [DOI] [Google Scholar]


