Abstract
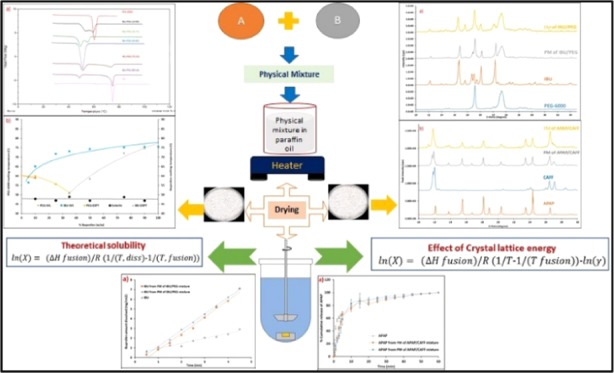
In the literature, it is reported that eutectics lead to the enhanced dissolution of a poorly soluble compound. However, the solubility theory suggests that since crystal structures of two components are unchanged that all else being equal, the dissolution rates of a fused mixture (FM) should be the same as a physical mixture (PM). The influence of crystal lattice energy on dissolution profiles was investigated using the PM and FM. Experimental phase diagrams constructed using differential scanning calorimetry data were compared with those theoretically derived. Deviation of the experimental phase diagram curves from the theoretical model indicates the nonideal behavior of both systems (ibuprofen/poly(ethylene glycol)-6000 and acetaminophen/caffeine). Both the binary systems showed an increase in the dissolution rate of the PM and FM. However, the dissolution from the PM was comparable with the FM’s dissolution profile. The theoretical solubility calculations using the modified solubility equation showed that the use of the eutectic temperature instead of the drug’s melting point should give a 3–4-fold increase in drug solubility. However, the correlation between dissolution and solubility calculation showed that the FM did not improve the dissolution when compared with the respective PM’s dissolution profile. The proposed explanation is that the unchanged crystal lattice energy in eutectics still limits the solubility and therefore the dissolution rate.
1. Introduction
The solubility and permeability behavior of drugs play a major role in bioavailability. Bioavailability of poorly soluble drugs from the Biopharmaceutics Classification System (BCS) class II category has been a major challenge for the pharmaceutical industry as before a drug can be absorbed from the gut, it must first be soluble in the relevant body fluid.1 Examples of drugs with solubility problems include ibuprofen (IBU), chloramphenicol, fenofibrate, digoxin, griseofulvin, phenytoin, and sulphathiazole in their free base or free acid form.2 The solubility of new drugs has been decreasing for years as new more complicated molecules have been identified through the high-throughput target-specific screening. Several approaches have been employed to enhance the solubility of poorly soluble compounds including (1) nanosizing and micronization, (2) formation of amorphous or metastable crystalline phases alone or in a polymer matrix, (3) formation of eutectic mixtures, (4) co-crystal and salt formation, (5) complexation, and (6) solid dispersion of the drug in the hydrophilic polymer matrix.3−13
Solid dispersion is widely used in the development of dosage forms for enhanced solubility and dissolution of an active pharmaceutical ingredient (API).11 Solid dispersions can be classified into two broad groups based on the solid state of the drug substance in the system, i.e., amorphous and crystalline. The amorphous form of hydrophobic drugs is typically known to improve dissolution in aqueous media over the crystalline form.14,15 The disadvantage of developing the amorphous system is its long-term stability and phase-transformation issues.16−18 Therefore, the solid dispersion delivery system where the drug is maintained in a crystalline form is usually viewed as the best alternative. Crystalline solid dispersions, in which the drug and carrier exist in a crystalline form, can be categorized into eutectics and monotectic. Eutectic mixtures are often confused with and categorized as solid dispersions, but, in fact, the eutectic mixture is a mixture of two or more components that do not chemically interact but at a certain ratio inhibits the crystallization process of one another, resulting in a system with a lower melting point compared to either of the pure components.19 An eutectic system is the combination of APIs and/or excipients, depending upon the desired performance. A simple eutectic mixture consists of two compounds, which at the eutectic composition are completely miscible in the liquid state but show little or no miscibility in the solid state.20 The crystal structures in a eutectic mixture remain unchanged, save disorder introduced during formation, from the parent components, indicating i.e., the eutectic is not a co-crystal or different crystal form of either component. Ideal eutectic compositions and eutectic temperatures can be estimated with the modified van’t Hoff equation.21,22 The literature suggests that eutectic mixtures may or may not be a simple physical mixture (PM) of two different crystalline phases. Based on the fusion properties of the pure components, they may have defined microstructure formation compared to the physical mixture.23−25 In the literature, it has been reported that the formation of eutectics enhances the drug dissolution rate due to the formation of microstructures, solid solutions, interfacial disorders, or melting point depression. However, a less studied dimension is the effect of crystal lattice energy on the dissolution rate of eutectics, consisting of a drug and crystalline polymer. One reason for the lack of the study is the limited understanding of the mechanism by which a drug’s dissolution rate is supposedly increased from a eutectic mixture. It has been reported that the factors that affect the eutectic formation include a thermodynamic function of the melting point and heat of fusion, both the parameters are a measure of enthalpy and entropy.
It is hypothesized that, if the microstructure, i.e., the particle size of the target analyte(s), remains constant in the physical mixture (PM) and fused mixture (FM), any enhancement in eutectic dissolution depends primarily on the formation of that microstructure, i.e., effective particle size/surface area and crystal quality (i.e., degree of disorder) in a eutectic mixture. If it was true, the physical mixture and fused mixture is expected to show similar dissolution profiles. Significant improvement in the dissolution rate is more likely due to the solubilization effect from highly soluble “carrier” compounds in the eutectic couple. Therefore, the question is, can a fused mixture contribute to the enhanced solubilization of poorly soluble compounds and if so, what is the underlying mechanism for enhancing the dissolution?
In this work, the authors have attempted to assess eutectic formation predictability and understand the contribution of crystal lattice energy to the dissolution behavior of APIs in two different binary mixtures. These are ibuprofen–poly(ethylene glycol)-6000 (IBU/PEG) and acetaminophen–caffeine (APAP/CAFF). Ibuprofen and caffeine are known to form a eutectic with PEG-6000 and acetaminophen, respectively. PEG-6000 is a large hydrophilic molecule compared to ibuprofen, which is expected to improve ibuprofens’ wettability, leading to an increase in solubility (at least a local cosolvent effect). The literature supports that the IBU/PEG system increases the dissolution rate and extent of ibuprofen.26−28 However, that enhancement may be due to a combination of the particle size, crystal quality, and the solubilization effect of PEG-6000.24,29−31 To understand the involvement of crystal lattice energy in dissolution enhancement of eutectics, it is necessary to control (or eliminate) the solubilization effect of the polymer or hydrophilic matrix, PEG in the current study. To that end, the APAP/CAFF system was selected as a model system. The APAP/CAFF system consists of two small molecules with approximately similar aqueous solubility under the conditions used, so there should be no significant improvement in solubilization imparted between them. The specific aims of this study were (a) understanding the contribution of crystal lattice energy in dissolution, (b) developing analytical methods to determine the eutectic formation, and (c) studying the dissolution behavior of the eutectic system.
2. Results and Discussion
2.1. Phase Diagram and Differential Scanning Calorimetry (DSC)
The binary temperature vs composition (T–χ) phase diagram provides graphical information on the equilibrium phases present at a given temperature. The phase diagram explains the behavior of two immiscible crystalline solids from a completely miscible melt.7,32 A binary T–χ phase diagram can be generated using the Schröder–van Laar (SVL) equation (eq 1), which is based on the ideal mixing theory.33 Similarly, thermal transition data from DSC can be used to generate an empirical phase diagram. In this research, phase diagrams were generated using DSC data and the SVL model. Predicted and experimental phase diagrams were generated to understand the role of ideal mixing in the formation of eutectics. The closer the agreement between the experimental curves from the phase diagram and the SVL-predicted model, the more ideal the system is said to be.
| 1 |
where R is the gas constant, ΔHfusion is the enthalpy of fusion of the pure component, TM is the melting temperature of the pure component, TE is the measured eutectic temperature of the system, and X is the mole fraction of the components.
2.1.1. Ibuprofen–Poly(ethylene glycol)-6000 System
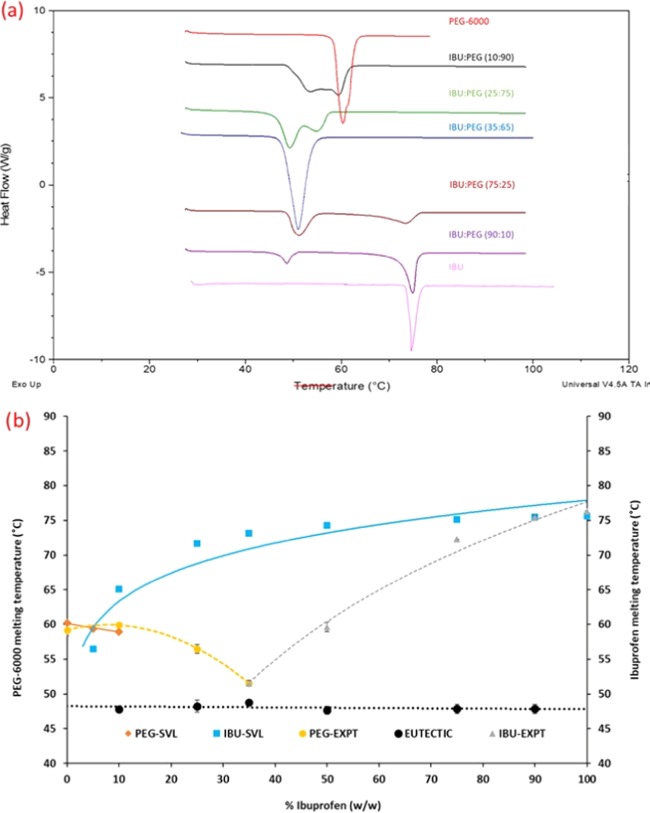
The Schröder–van Laar (SVL) equation model was used to predict the ideal eutectic composition of the IBU/PEG system. The experimental values for DSC analysis are shown in Table 1. The DSC curves were overlaid to construct an IBU/PEG experimental phase diagram. Both the predicted and experimental phase diagrams show that the addition of PEG leads to a decrease in the melting point of ibuprofen as it approaches the eutectic temperature (TE). At the eutectic composition, the binary system is invariant. When the eutectic mixture is heated above the eutectic temperature, the mixture melts into a liquid. This defines the solidus boundary for the IBU/PEG binary system. DSC scans of IBU/PEG solid dispersions below and above their respective eutectic compositions exhibited two endothermic events, with the lower-temperature endotherm corresponding to the melting of the eutectic mixture and the high-temperature endotherm due to the melting of either the pure excess polymer or the excess crystalline drug (Figure 1a). Theoretical curves from the phase diagram were compared with the experimental results, showing the difference in eutectic composition as well as the eutectic melting temperature. According to the theoretical curves, the eutectic composition is 5% in ibuprofen with a eutectic temperature of 59 °C. However, the experimental phase diagram shows that ibuprofen is 35% of the total eutectic composition with a 48.91 °C TE (Figure 1b). The differences reflect the nonideal behavior of the IBU/PEG system.33
Table 1. Experimental Results from DSC Analysis of the IBU/PEG Binary System.
| melting
or depressed melting temperature of (°C) |
T | ||
|---|---|---|---|
| ratio of IBU/PEG | ibuprofen | PEG-6000 | temperature at solidus curve (°C) |
| 100:0 | 76.32 | ||
| 90:10 | 74.93 | 46.9 | |
| 75:25 | 72.27 | 48.76 | |
| 50:50 | 58.69 | 46.88 | |
| 35:65 | 50.95 | 50.95 | 48.91 |
| 25:75 | 55.62 | 46.98 | |
| 10:90 | 59.96 | 47.82 | |
| 0:100 | 60.32 | ||
Figure 1.
(a) Overlaid DSC thermograms of the IBU/PEG system. (b) Comparison between the phase diagram generated using the Schröder–van Laar (SVL) equation model and DSC study.
2.1.2. Acetaminophen–Caffeine System
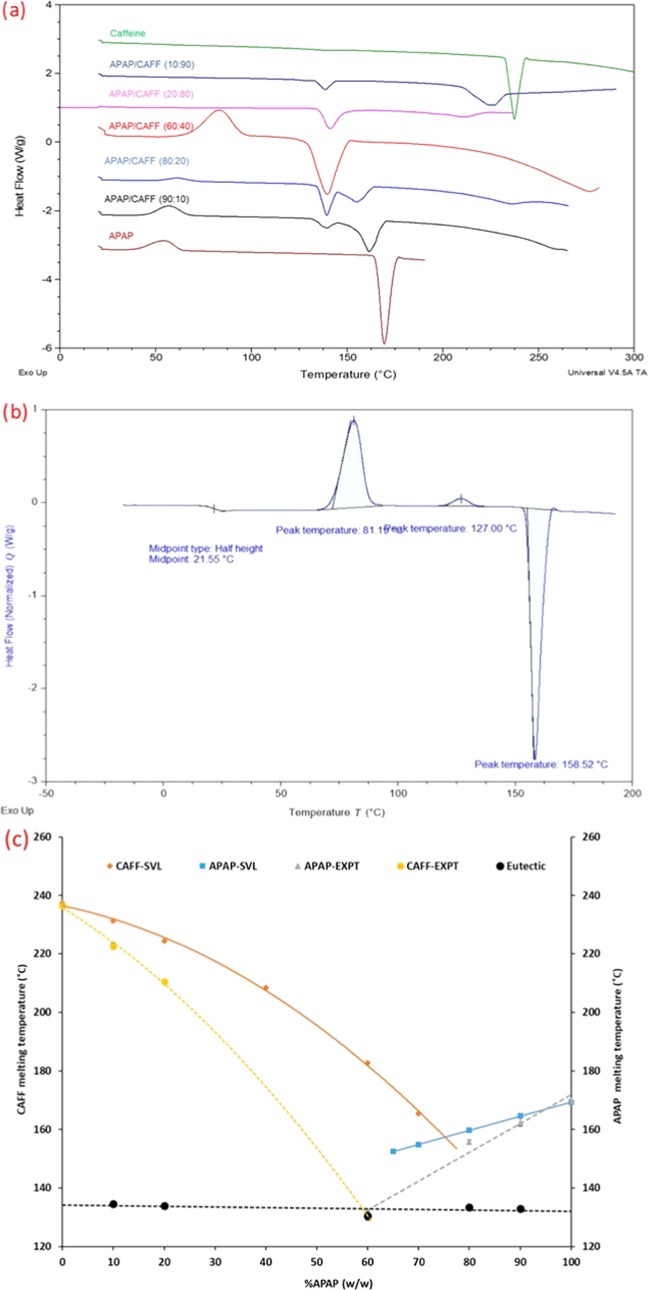
Similar to the IBU/PEG system, the SVL model was used to construct a phase diagram for the APAP/CAFF binary system. DSC thermograms of different ratios of APAP/CAFF were overlaid to construct an experimental phase diagram. Experimental values from DSC analysis are mentioned in Table 2. The theoretical eutectic curves were then superimposed on to the experimental phase diagram to understand the ideal behavior of the eutectic mixture. DSC thermograms of neat acetaminophen showed an exothermic event at 56 °C, indicating the recrystallization of amorphous APAP (Figure 2a).34 The DSC thermogram of neat APAP shows the presence of Tg at 21.6 °C, which confirms the recrystallization of amorphous APAP (Figure 2b). However, the neat APAP does not show the exothermic event at 56 °C in contrast to the binary mixtures. This might be because the neat APAP was tested under DSC as received while binary mixtures were premelted. APAP/CAFF at different ratios, except at the eutectic composition APAP/CAFF system, showed two endothermic transitions. The first endothermic event represents the eutectic temperature (TE), while the second endothermic event represents the melting of the pure component (TM). The second endotherm indicates the presence of the component, which is present in excess in the binary mixture. The SVL model predicted the eutectic composition at 75% APAP with a eutectic temperature of approximately 149.41 °C. However, the experimental results showed a significant difference in both eutectic parameters. Based on the experimental results, APAP/CAFF forms a eutectic system when 60% of APAP is present in the system and TE is close to 131.46 °C. The deviation of experimental eutectic parameter values from the theoretical curves indicates the nonideal behavior of the eutectic mixture (Figure 2c). Compared to the IBU/PEG system, APAP/CAFF is closer to the theoretical curves, which indicate less involvement of entropy of mixing during the formation of the APAP/CAFF eutectic system. The higher entropy of mixing could explain the complete offset of the IBU/PEG curve from the theoretical curve and predicted eutectic parameters. Experiments were carried out twice at each composition level, and the results indicated that the shift in the solidus curve temperature is about ±2 °C (data showed in the Supporting Information). The shift in the solidus curve temperature is because of small but unavoidable experimental or analytical variations.
Table 2. Experimental Results from DSC Analysis of the APAP/CAFF Binary System.
| melting
or depressed melting temperature of (°C) |
|||
|---|---|---|---|
| ratio of APAP/CAFF | APAP | CAFF | temperature at solidus curve (°C) |
| 100:0 | 169.30 | ||
| 90:10 | 161.48 | 133.35 | |
| 80:20 | 155.1 | 134.31 | |
| 60:40 | 131.46 | ||
| 20:80 | 210.62 | 134.99 | |
| 10:90 | 224.34 | 133.63 | |
| 0:100 | 237.38 | ||
Figure 2.
(a) Overlaid DSC thermograms of the APAP/CAFF system, (b) DSC thermogram of neat APAP as received from the vendor, and (c) comparison between the phase diagram generated using the Schröder–van Laar (SVL) equation model and DSC study.
2.1.3. Effect of the Mixture on the Melting Temperature of an Individual Component in a Binary System
Shifting or the depressed melting temperature of the component in the DSC study indicates the possibilities of interactions between both components present in the system. In a binary system, if one component (such as a crystalline drug) is soluble in the molten mass of the second component at the second component’s melting temperature, then the system could form a eutectic system. The higher solubility of the crystalline drug in the eutectic mixture results in either a weak affinity of the drug molecule to the crystalline solid or a strong affinity toward the molten mass of the second component.29,35 IBU/PEG and APAP/CAFF eutectic systems exhibit complete miscibility in a liquid state and complete immiscibility in the solid state. In these kinds of binary systems, the liquid phase interaction between the unlike components is expected to be stronger than that of the like components.26 Cooling of the melt at the eutectic composition leads to the crystallization of both the phases spontaneously and proceeds with the crystallization of minor phases in the interstitial spaces of the primary phase.24,26 According to Tammann’s rule, the lower melting component tends to be a major phase and the component with a higher melting point is a minor phase.36 Therefore, in IBU/PEG and APAP/CAFF systems, PEG and APAP are major phases, respectively. During cooling of melts other than at the eutectic composition, only one component spontaneously starts to crystallize, thereby rendering the remaining liquor richer in the other component. This was indicated by the two-melting events in the DSC thermogram at compositions other than the eutectic composition. The ibuprofen liquidus line for an ideal binary liquid mixture of IBU/PEG was determined by eq 1 and was observed at a higher temperature than those determined experimentally. Similarly, in the APAP/CAFF system, the liquidus lines for caffeine determined by (eq 1) were observed at a higher temperature. This gives a further indication that the minor phase, i.e., ibuprofen and caffeine, was attractively interacting with the primary phase PEG and acetaminophen, respectively. The existence of interaction may be evidenced by the estimation of the fusion excess enthalpy by applying eq 2, using the experimental data shown in Table 2.
| 2 |
| 3 |
where Wi is the mass fraction of the two components and ΔHf,i is the enthalpy of fusion of the two components.
The calculated ΔHf,excess value for IBU/PEG and APAP/CAFF systems is −7.14 and −30.6 J/gm, respectively. In this way, the negative values of the fusion excess enthalpy of the eutectic mixture indicate the fine dispersion or the molecular clusters of ibuprofen crystals and caffeine crystals in the bulk of PEG and acetaminophen, respectively.24,31,37−39 The nondimensional fusion entropy (ΔSf°) for the pure components and respective eutectic mixtures is shown in Table 3. Fusion entropy was calculated using the enthalpy of fusion and fusion temperature.40,41 Components from both the systems have ΔSf° > 2R, which indicates nondimensional entropy of fusion.23,24 Fusion entropy data shows that the eutectic mixtures have higher ΔSf values than the minor crystalline component of the eutectic systems. This suggests that the eutectic mixture has a higher thermodynamic state compared to the minor component from IBU/PEG and APAP/CAFF systems. As reported in the literature, the higher thermodynamic state could be the manifestation of excessive micronization.41
Table 3. Experimental Values of the Thermodynamic Function of Fusion Enthalpy and Fusion Entropy.
| sr. no. | component | ΔHf (J/g) | ΔSf (J/(mol K)) | ΔSf°/R |
|---|---|---|---|---|
| 1 | ibuprofen | 130.2 | 76.9 | 9.2 |
| 2 | PEG-6000 | 179.6 | 18.3 | 2.2 |
| 3 | IBU/PEG (35:65) | 155.3 | 45.1 | 5.4 |
| 4 | APAP | 178.7 | 135.02 | 16.2 |
| 5 | caffeine | 114.2 | 43.4 | 5.2 |
| 6 | APAP/CAFF (60:40) | 123.3 | 82.65 | 9.9 |
2.2. Powder X-ray Diffraction (PXRD) Studies
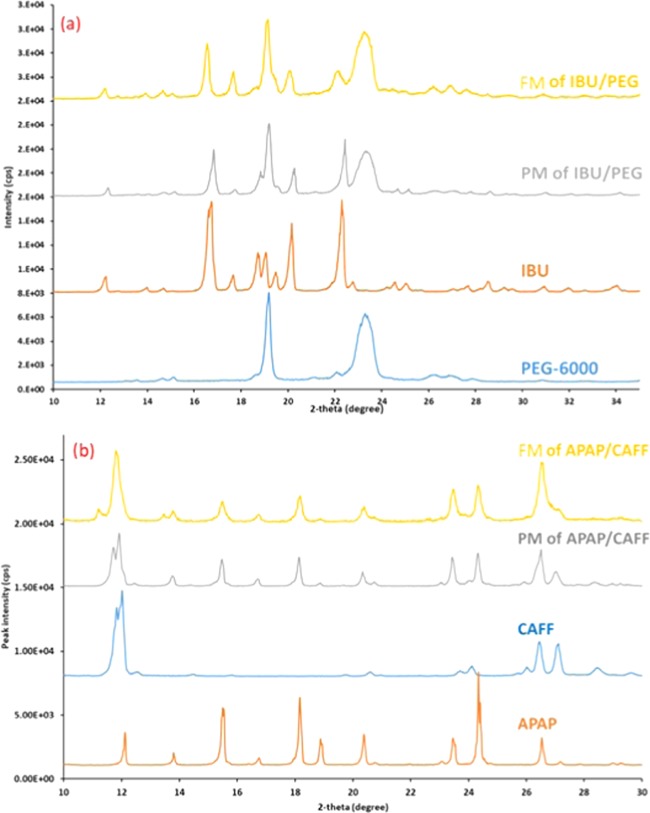
In the X-ray diffraction studies, the powder pattern corresponding to both components in the mixture was assessed by taking reference powder diffraction patterns of an individual component of the eutectic system (Figure 3). PXRD pattern shows the crystalline peaks of ibuprofen in the IBU/PEG system and crystalline peaks for acetaminophen and caffeine in the APAP/CAFF system (Figure 4a,b). This illustrates the solid-state stability of one component in the presence of the second component. However, the crystalline peaks of neat ibuprofen, acetaminophen, and caffeine were more intense and sharper compared to the peaks observed in their respective eutectic mixtures. It was also apparent that the relative intensities of the observed peak varied, which is in accordance with the published literature, suggesting that peak broadening could be due to preferred orientation caused by the growth of anisotropic crystals from a melted sample and particle size reduction.42 Similar results were reported for physical mixtures and solid dispersions of ketoprofen–PEG-6000 systems in the solid state.43 Powder pattern of the pure components and eutectic mixtures in each system superimposed well with individual components. Although the small changes in the peak intensities were observed, no change/shifts in peak position indicated the solid-state stability of ibuprofen with PEG and acetaminophen with caffeine. This supports the researchers’ idea that the eutectic systems can be formed by the fusion method without altering the solid-state properties of the individual component.
Figure 3.
(a) Overlaid powder pattern of components from the IBU/PEG system. (b) Overlaid powder pattern of components from the APAP/CAFF system.
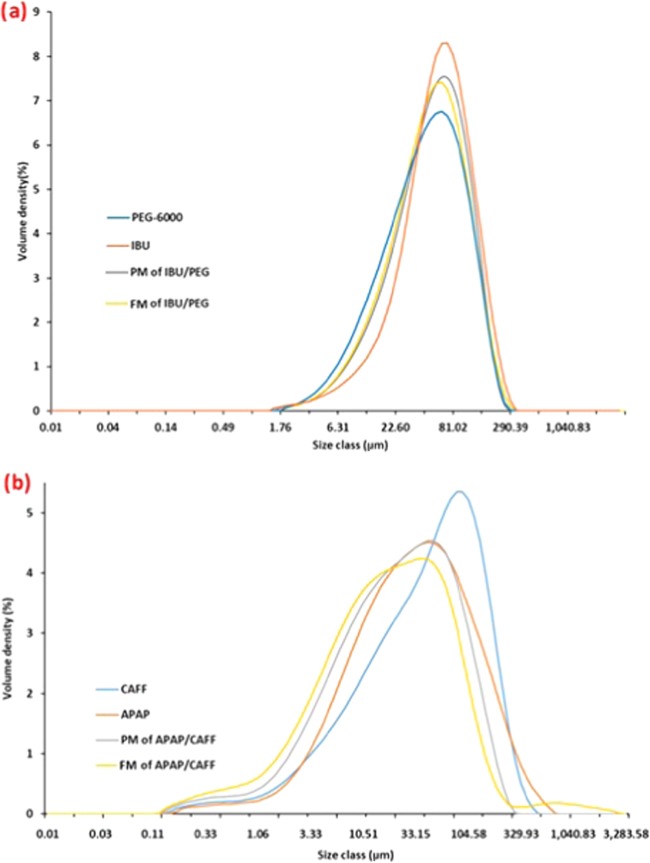
Figure 4.
(a) Particle size distribution (PSD) of components from the IBU/PEG system. (b) Particle size distribution of components from the APAP/CAFF system.
2.3. Particle Size Distribution Studies
The solidified material of both eutectic systems was grounded further before subjecting to dissolution studies. To eliminate or lower the influence of variation in particle size in dissolution, particles with similar particle size distribution (PSD) were selected for dissolution analysis. The PM and FM from the IBU/PEG system showed unimodal PSD with D50 of 51.9 and 51.2 μm, respectively (Figure 4a and Table 4a). Similarly, PM and FM from the APAP/CAFF system showed a unimodal PSD with D50 of 23.5 and 19 μm, respectively (Figure 4b and Table 4b). The PM and FM with a particle size less than 100 μm were compressed to form a compact using Wood’s apparatus.
Table 4. Particle Size Distribution Data of Components from (a) the IBU/PEG System and (b) the APAP/CAFF System.
| (a) | |||
|---|---|---|---|
| sample name | D10 (μm) | D50 (μm) | D90 (μm) |
| ibuprofen | 18.10 | 59.60 | 140.00 |
| PEG-6000 | 11.60 | 45.60 | 122.00 |
| PM of IBU/PEG | 14.20 | 51.90 | 126.00 |
| FM of IBU/PEG | 14.30 | 51.20 | 134.00 |
| (b) | |||
|---|---|---|---|
| sample name | D10 (μm) | D50 (μm) | D90 (μm) |
| caffeine | 5.24 | 45.80 | 159.00 |
| acetaminophen | 5.29 | 32.40 | 153.00 |
| PM of APAP/CAFF | 3.32 | 23.50 | 98.90 |
| FM of APAP/CAFF | 2.47 | 19.00 | 90.40 |
2.4. Effect of Eutectic Temperature on the Theoretical Solubility of Drugs
Forming a eutectic system of a poorly soluble compound is touted as one of the alternatives to improve its solubility in an aqueous medium. The solid dispersion of poorly soluble drugs in a hydrophilic matrix has been reported to improve the solubility and dissolution rate. The eutectic composition has a lower melting point than that of either of the pure components. So theoretically, lowering the melting point might be expected to result in increased solubility. However, the thermodynamic counter-argument hypothesized demanded testing. To test this hypothesis, the solubility of ibuprofen in the IBU/PEG system and acetaminophen and caffeine solubility in the APAP/CAFF system was estimated from the theory using drugs’ melting temperature (TM) vs the eutectic temperature (TE) of the system (eq 4).
| 4 |
where R is the gas constant, ΔHfusion is the enthalpy of fusion of the pure component, Tdiss is the temperature at which the solubility or dissolution test is performed, TM or TE is the measured melting temperature of the pure component or eutectic temperature of the system, and X is the mole fraction of the component.
Assuming the same activity coefficient, the theoretical solubility of ibuprofen, acetaminophen, and caffeine was calculated using the dissolution system temperature of 37 °C, the TE of the respective binary system, and the TM of the pure component(s) (Table 5). Based on the calculation, ibuprofen has a theoretical solubility using TE of 25.34 mg/mL and using the TM of ibuprofen is 12.68 mg/mL. This predicts that forming an ibuprofen eutectic with PEG should increase drugs’ solubility approximately by 2-fold if TE is, in fact, the controlling quantity. Similar results were found with the APAP/CAFF system. The solubility at 37 °C of acetaminophen at TE is calculated to be 0.57 mg/mL and at TM of acetaminophen is 0.12 mg/mL. While the solubility of caffeine at TE is 10.05 mg/mL and at TM of caffeine is 2.55 mg/mL. Therefore, according to the estimates, the eutectic of APAP/CAFF should exhibit an increase in the solubility of the individual components approximately by 3.5-fold. This predicts that the dissolution rate of ibuprofen in IBU/PEG and acetaminophen, caffeine in the APAP/CAFF system at the eutectic composition should be higher by some proportional amount. These results were compared with the in vitro dissolution testing data to test the hypothesis.
Table 5. Experimental Data Used for the Theoretical Solubility Calculation of Individual Components from a Binary System.
| temperature
of (K) |
||||
|---|---|---|---|---|
| component | heat of fusion (kJ/mol) | melting of neat drug | melting of eutectic mix | dissolution test performed |
| ibuprofen | 26.82 | 348.75 | 322.06 | 310.15 |
| APAP | 59.74 | 442.45 | 404.61 | 310.15 |
| caffeine | 22.17 | 510.53 | 404.61 | 310.15 |
2.5. In Vitro Dissolution Studies
Both binary systems were tested for their dissolution performance, as described in the methods section. Per USP, pH 7.2 phosphate buffer was the dissolution media to test the solubility/dissolution performance of ibuprofens. At pH 7.2, ibuprofen dissociates very rapidly, which, in turn, increases its release rate. This makes it difficult to determine its dissolution rate constant. Therefore, the authors have selected a dissolution medium in which ibuprofen remains unionized during dissolution, which helps in estimating the dissolution rate constant. However, ibuprofen-free acid has poor aqueous solubility and wettability, which limits the solubility in pH 1.2, so acetonitrile was used as a cosolvent in the dissolution medium to increase its solubility. Wood’s apparatus for measuring intrinsic dissolution was used to provide a more objective data set for comparing the dissolution behavior of the physical mixtures, a fused mixture, and neat drugs.
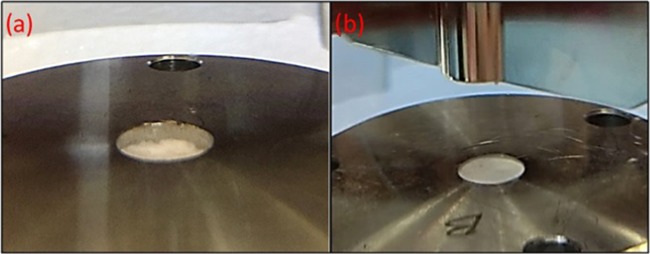
After an initial 5 min of dissolution run, the compact of IBU/PEG in Wood’s apparatus showed an uneven surface, indicating a change in the surface area (Figure 5a). However, in the case of neat drugs, the surface was intact for a longer time and showed a linear relationship between drug release and time (Figure 5b). However, for comparison purposes of PM and FM, only the first 5 min data was considered to calculate the dissolution rate constant. However, the complete profile was compared to demonstrate the percent cumulative release of drugs from PM, FM, and neat drugs.
Figure 5.
(a) Photograph of Wood’s apparatus in dissolution media showing the uneven surface of the IBU/PEG powder compact. (b) Photograph of Wood’s apparatus in dissolution media showing the intact surface of the neat ibuprofen powder compact.
The results showed that the dissolution rate of ibuprofen from PM and FM increased markedly as compared to the drug alone. However, the dissolution rate from the FM was no higher than the PM. This is in contrary to the literature, supporting the claim of an increase in the dissolution rate of the drug due to its incorporation into a eutectic mixture as well as the estimated solubility calculation using the eutectic temperature as the controlling fusion event. In fact, the dissolution rates from the PM and FM showed similar dissolution rates, i.e., 1.623 and 1.663 mg/(cm2 min), respectively (Figure 6a). Both mixtures showed a 100% ibuprofen release in approximately 15 min, however the drug alone took a much longer time (Figure 6b). The drug alone showed much slower dissolution compared to PM and FM, i.e., 0.540 mg/(cm2 min) (Table 6a) due to the absence of the hydrophilic PEG, which constitutes up to 65% (w/w) of the binary mixtures. The presence of PEG in the system improves the drug’s wetting by the dissolution medium and can act locally as a cosolvent, which could result in an increased dissolution compared to the drug only. If so, then ibuprofen dissolution should and was observed to increase by making a physical mixture of ibuprofen with PEG without making a fused mixture. This indicates that in the IBU/PEG system, it is not the eutectic, but the presence of PEG causing the increase in the dissolution rate. This supports the hypothesis that if crystal lattice energy is not changed in the eutectic mixture, then the solubility and dissolution study results from FM will be comparable to the results from the PM, all else being equal.
Figure 6.
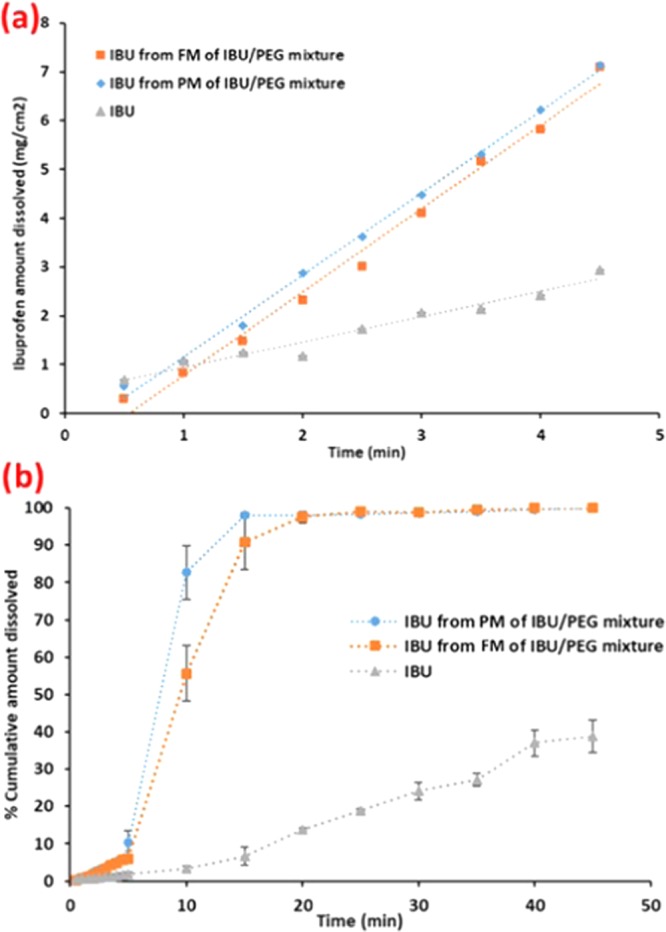
(a) Intrinsic dissolution plot of neat ibuprofen, IBU from PM and FM of the IBU/PEG mixture; (b) % cumulative amount dissolved profile of neat ibuprofen, IBU from PM and FM of the IBU/PEG mixture in 0.1 M HCl with acetonitrile (30% v/v).
Table 6. Dissolution Rate of (a) the IBU/PEG System; (b) APAP in the APAP/CAFF System; and (c) CAFF in the APAP/CAFF System.
| (a) | ||
|---|---|---|
| sr. no. | sample name | dissolution rate (mg/(cm2 min)) ± SD |
| 1 | ibuprofen | 0.540 ± 0.014 |
| 2 | IBU from PM of IBU/PEG | 1.623 ± 0.278 |
| 3 | IBU from FM of IBU/PEG | 1.663 ± 0.447 |
| (b) | ||
|---|---|---|
| sr. no. | sample name | dissolution rate (mg/min) ± SD |
| 1 | APAP from PM of APAP/CAFF | 7.123 ± 2.23 |
| 2 | APAP from FM of APAP/CAFF | 8.833 ± 1.438 |
| (c) | ||
|---|---|---|
| sr. no. | sample name | dissolution rate (mg/min) ± SD |
| 1 | CAFF from PM of APAP/CAFF | 6.396 ± 1.355 |
| 2 | CAFF from FM of APAP/CAFF | 7.180 ± 1.329 |
Further, a eutectic was formed in the absence of a solubilizing compound (e.g., PEG). A second binary mixture of acetaminophen and caffeine (APAP/CAFF) system was selected and its dissolution performance was studied. As mentioned earlier, because of the powder incompressibility issue, intrinsic dissolution was not a choice. Therefore, tablet dissolution was further used to study the effect of the eutectic mixture on the dissolution performance of a binary mixture of APAP/CAFF. PM and FM mixtures were blended with 66% (w/w) silicified microcrystalline cellulose (SMCC) and compressed such that hardness of the tablets ranged between 14 and 16 kPa. Figure 7 shows the dissolution profile of the APAP/CAFF system. The dissolution rates of APAP and CAFF in PM and FM were approximately similar, showing no significant difference in the dissolution rate between FM and PM (Table 6b,4c). This demonstrates that the eutectic formation of APAP/CAFF did not drastically improve the dissolution rate, so the solubility as compared to PM. This supports the observations from the IBU/PEG system that if crystal lattice energy was unchanged and local contact between the components kept constant in FM and PM, then solubility and dissolution results should not differ significantly.
Figure 7.
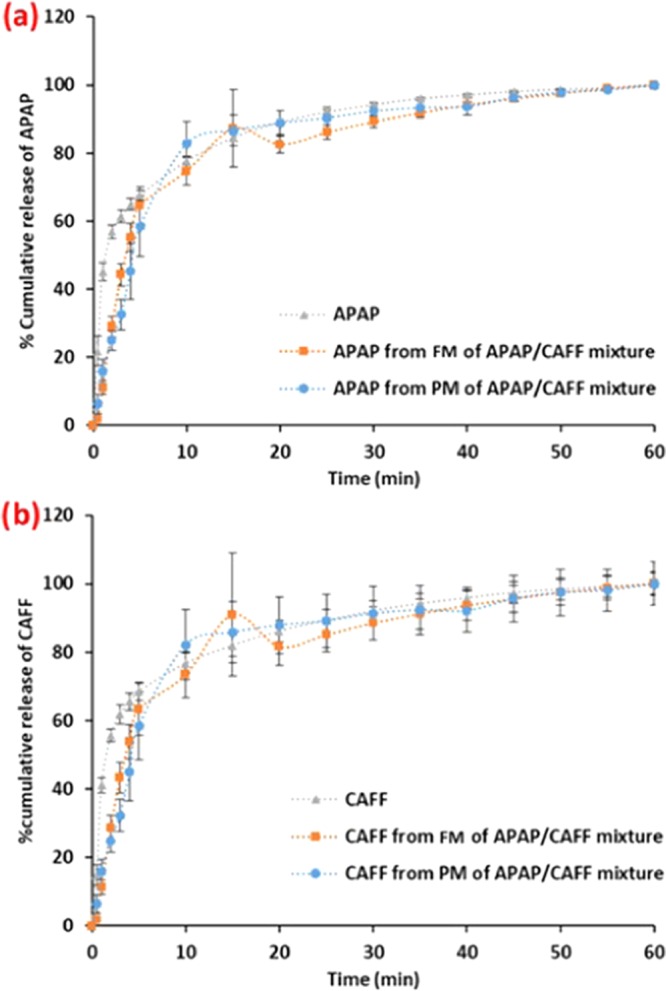
(a) Dissolution profile of neat acetaminophen, APAP from PM and FM of the APAP/CAFF mixture in deionized water. (b) Dissolution profile of neat caffeine, CAFF from PM and FM of the APAP/CAFF mixture in deionized water.
Different thermodynamic models are published in the literature to determine the ideal or real solubility of the compound. These models include the van’t Hoff equation and ideal models. Based on the ideal model, if the solution is ideal, then the solubility of the compound can be calculated using eq 5a, where the effect of the activity coefficient was considered as negligible.
| 5a |
where R is the gas constant, ΔHfusion is the enthalpy of fusion of the pure component, T is the temperature at which the solubility test is performed, TM is the measured melting temperature of the pure component, and X is the mole fraction of the component.
However, most often the resulting solutions are nonideal and the activity coefficient ln(γ) plays a major role in determining the real solubility of the compound in a given media. Therefore, on the basis of the activity coefficient method, the equilibrium solubility of the compound may be expressed by the simplified equation (eq 5b).
Based on the simplified real solubility expression (eq 5b), an improvement in dissolution or the solubility of the drug compound in its eutectic mixture is entirely dependent on the factors of the activity coefficient in the medium and the crystal lattice (energy and melting point).44 So, if crystal lattice energy is unchanged in the eutectic and improvement in the dissolution rate is as noted then all else being equal, enhancements must be because of increase local contact, i.e., microstructure and/or the solubilizing power of the other component (e.g., PEG). However, if the local contact is kept at a constant range, then we should not see any difference in dissolution or solubility between FM and PM.
| 5b |
3. Conclusions
Eutectic mixtures have been investigated for pharmaceutical purposes, and a number of works claim an increase in solubilization and dissolution of drug formulation due to the eutectic formation. Based on thermodynamics, it was hypothesized that the crystal lattice energy of the two components is unchanged that all else being equal, the dissolution rates of the eutectic should be the same as a physical mixture. With the combination of the results obtained from two different binary systems, it may be concluded that if the crystal lattice energy is not changed in eutectic mixtures and the local contact between both the components is kept constant, then a physical mixture (PM) and a fused mixture (FM) of the same components will yield similar dissolution profiles.
The results show that the presence of a hydrophilic compound as one of the components in a physical or fused mixture will tend to increase the dissolution rate of a poorly soluble drug by solubilizing the drug during dissolution, making it appears as if the increase is related to the eutectic. PXRD studies showed that the crystalline pattern crystallinity of the target analyte is not changed; however, lower peak intensities have been noted, which could be due to the preferred orientation, masking effect by the second component from the binary mixture and/or some disorder in the crystalline components.
A theoretical calculation using the eutectic melting point instead of the drug’s melting point showed a 3–4-fold increase in drug’s predicted solubility and therefore the intrinsic dissolution rate. However, the data show that the release from the FM did not improve the dissolution of IBU/PEG or APAP/CAFF when compared with their respective PM’s dissolution profiles. The hypothesized explanation is that the unchanged crystal lattice energy in eutectics limits the solubility (and therefore dissolution rate) is consistent with the results being substantially the same. As discussed, using the simplified real solubility expression (eqs 5a and 5b) change in dissolution so the solubility of the drug in the eutectic mixture is dependent on two major factors, which are the activity coefficient of the media and crystal lattice (energy and melting point). This leads to the conclusion that if there is no change in the crystal lattice energy and the local contact is kept at a constant range, then FM and PM will have the same dissolution rate.
4. Experimental Section
4.1. Materials
Ibuprofen (IBU), acetaminophen (APAP), and caffeine (CAFF) were obtained from Fagron Inc. Poly(ethylene glycol) (PEG-6000 PF) was purchased from Clariant. Silicified microcrystalline cellulose (Prosolv SMCC-HD 90) was obtained from JRS Pharma. All materials were of pharmaceutical or analytical grade as appropriate. Deionized water was generated in-house using the Sigma-Millipore system.
4.2. Preparation of Solid Dispersion
Solid dispersions of ibuprofen (IBU) with poly(ethylene glycol) (PEG-6000 PF) and acetaminophen (APAP) with caffeine (CAFF) were prepared by the fusion method. Approximately, 1000 mg of the physical mixture (PM) of IBU/PEG and APAP/CAFF was prepared by geometric mixing. Each mixture was placed in a glass vial, which was immersed in mineral oil and heated at 80 °C (for IBU/PEG) and 240 °C (for APAP/CAFF). The fused mixture was stirred to ensure complete mixing and then allowed to cool to room temperature keeping undisturbed. The solidified material was gently grounded with a mortar pestle and size fractions were separated through the nest of sieves. Particles having a size <100 μm were collected and used for further studies. Grounded materials were stored in a desiccator containing drierite (anhydrous calcium sulfate) for approximately 24 h before analysis.
4.3. Generation of the Eutectic Phase Diagram by Differential Scanning Calorimetry (DSC)
The eutectic phase diagrams were constructed using the data obtained from differential scanning calorimetry (DSC). The grounded solidified material (5.0 ± 0.2 mg) from each fused mixture was weighed in Tzero aluminum DSC pans. The pans were nonhermetically sealed and subjected to analysis using a differential scanning calorimeter (Q2000, TA Instruments). Before the sample analysis, indium was used to calibrate DSC for the baseline, temperature, and cell constant at a heating rate of 5 °C/min. During sample analysis, fused samples were heated at a constant rate of 5 °C/min and a dry nitrogen purge was maintained at 50 mL/min. Each mixture of IBU/PEG and APAP/CAFF was heated from 20 to 100 °C and 20 to 250 °C, respectively. The results were analyzed using the Universal Analysis 2000 software (TA Instruments, New Castle, DE).
4.4. Powder X-ray Diffraction (PXRD)
PXRD patterns of the samples were recorded at room temperature (25.0 ± 2.0 °C) on a Smartlab scanning diffractometer (Rigaku Corporation, Tokyo, Japan) using copper Kα radiation with a potential of 44 kV and 40 mA power. The analysis was performed in a continuous mode with a scan rate of 0.2°/min over an angular range of 5–35° 2θ. Obtained diffractograms were analyzed with the PDXL-2 diffraction software (Rigaku Data Analysis Software). Data was used to determine any possible changes in the crystalline patterns of ibuprofen, acetaminophen, and caffeine in respective binary mixtures.
4.5. Particle Size Distribution (PSD)
Particle size distributions were determined using a laser diffraction particle size analyzer (Mastersizer 3000, Malvern Instruments, Westborough). Binary mixtures at eutectic composition, ibuprofen, PEG-3000, acetaminophen, and caffeine were tested for particle size analysis. Approximately, 0.5 ± 0.1 g of the sample was used for particle size analysis. Reported data of D10, D50, and D90 were the mean of the triplicate study.
4.6. Dissolution Studies
Powdered samples of IBU/PEG at their eutectic composition were compressed at 88 MPa using the Wood’s die using a Carver press. The Wood’s apparatus containing the compressed powdered sample or tablet of the fused mixture made from the fusion method, physical mixture, and neat drugs was tested for dissolution performance using USP dissolution apparatus type II (Symphony 7100/Opt-Diss 410, Distek Inc., NJ) at a speed of 50 rpm and a temperature of 37 ± 0.2 °C. The dissolution performance of the IBU/PEG system was tested in 0.1 M HCl with acetonitrile (30% v/v), and a single wavelength calculation method was used to calculate the % ibuprofen release. However, APAP/CAFF was not compressible in the Wood’s die; therefore, dissolution performance was tested using tablet dissolution. Because of powder incompressibility, silicified microcrystalline cellulose (SMCC) was used to improve the compressibility of APAP/CAFF. Each tablet containing 66% of SMCC and 34% of APAP/CAFF was compressed between 150 and 200 MPa to achieve a target tablet hardness of 15 kPa. Deionized water was used as a dissolution media to test dissolution performance of APAP/CAFF tablets. The multicomponent method was selected to determine the % release of APAP and CAFF from the mixtures. The standard solution of the individual active pharmaceutical ingredient was prepared separately by dissolving in respective dissolution media and scanned through a wavelength of 200–400 nm to determine the λmax.
Acknowledgments
The author would like to thank Lachman Institute for Pharmaceutical Analysis, Arnold and Marie Schwartz College of Pharmacy and Health Sciences, and Long Island University for providing us the laboratory support to conduct the research work.
Supporting Information Available
The Supporting Information is available free of charge at https://pubs.acs.org/doi/10.1021/acsomega.9b03886.
Differential scanning calorimetric data for IBU/PEG-6000 and APAP/CAFF binary systems (PDF)
The authors declare no competing financial interest.
Supplementary Material
References
- Ganesan P.; Narayanasamy D. Lipid nanoparticles: A challenging approach for oral delivery of BCS Class-II drugs. Future J. Pharm. Sci. 2018, 191. 10.1016/j.fjps.2018.04.001. [DOI] [Google Scholar]
- Lindenberg M.; Kopp S.; Dressman J. B. Classification of orally administered drugs on the World Health Organization Model list of Essential Medicines according to the biopharmaceutics classification system. Eur. J. Pharm. Biopharm. 2004, 58, 265–278. 10.1016/j.ejpb.2004.03.001. [DOI] [PubMed] [Google Scholar]
- Savjani K. T.; Gajjar A. K.; Savjani J. K. Drug solubility: importance and enhancement techniques. ISRN Pharm. 2012, 2012, 195727 10.5402/2012/195727. [DOI] [PMC free article] [PubMed] [Google Scholar]
- Taheri A. Formulation, optimization and characterization of gemfibrozil nanocrystals prepared by wet milling technique. Asian J. Pharm. 2015, 9, 19–22. 10.4103/0973-8398.150032. [DOI] [Google Scholar]
- Singh D.; Bedi N.; Tiwary A. K. Enhancing solubility of poorly aqueous soluble drugs: critical appraisal of techniques. J. Pharm. Invest. 2018, 48, 509–526. 10.1007/s40005-017-0357-1. [DOI] [Google Scholar]
- Serajuddin A. T. Solid dispersion of poorly water-soluble drugs: Early promises, subsequent problems, and recent breakthroughs. J. Pharm. Sci. 1999, 88, 1058–1066. 10.1021/js980403l. [DOI] [PubMed] [Google Scholar]
- Chiou W. L.; Riegelman S. Pharmaceutical applications of solid dispersion systems. J. Pharm. Sci. 1971, 60, 1281–1302. 10.1002/jps.2600600902. [DOI] [PubMed] [Google Scholar]
- Babu N. J.; Nangia A. Solubility advantage of amorphous drugs and pharmaceutical cocrystals. Cryst. Growth Des. 2011, 11, 2662–2679. 10.1021/cg200492w. [DOI] [Google Scholar]
- Klein S.; Wempe M. F.; Zoeller T.; Buchanan N. L.; Lambert J. L.; Ramsey M. G.; Edgar K. J.; Buchanan C. M. Improving glyburide solubility and dissolution by complexation with hydroxybutenyl-β-cyclodextrin. J. Pharm. Pharmacol. 2009, 61, 23–30. 10.1211/jpp.61.01.0004. [DOI] [PubMed] [Google Scholar]
- Gajera B. Y.; Shah D. A.; Dave R. H. Development of an Amorphous Nanosuspension by Sonoprecipitation-Formulation and Process Optimization using Design of Experiment methodology. Int. J. Pharm. 2019, 348. 10.1016/j.ijpharm.2019.01.054. [DOI] [PubMed] [Google Scholar]
- Araya-Sibaja A. M.; Vega-Baudrit J. R.; Guillén-Girón T.; Navarro-Hoyos M.; Cuffini S. L. Drug Solubility Enhancement through the Preparation of Multicomponent Organic Materials: Eutectics of Lovastatin with Carboxylic Acids. Pharmaceutics 2019, 11, 112 10.3390/pharmaceutics11030112. [DOI] [PMC free article] [PubMed] [Google Scholar]
- Górniak A.; Karolewicz B.; Żurawska-Płaksej E.; Pluta J. Thermal, spectroscopic, and dissolution studies of the simvastatin–acetylsalicylic acid mixtures. J. Therm. Anal. Calorim. 2013, 111, 2125–2132. 10.1007/s10973-012-2641-7. [DOI] [Google Scholar]
- Park E. S.; Rhee Y. S.; Park C. W.; Oh T. O.; Kim J. Y.; Ha J. M.; Shin J. H.. Eutectic Mixture Comprising Celecoxib and Poloxamer. US20130296280A1, 2013.
- Murdande S. B.; Pikal M. J.; Shanker R. M.; Bogner R. H. Solubility advantage of amorphous pharmaceuticals: I. A thermodynamic analysis. J. Pharm. Sci. 2010, 99, 1254–1264. 10.1002/jps.21903. [DOI] [PubMed] [Google Scholar]
- Hancock B. C.; Parks M. What is the true solubility advantage for amorphous pharmaceuticals?. Pharm. Res. 2000, 17, 397–404. 10.1023/A:1007516718048. [DOI] [PubMed] [Google Scholar]
- Bhugra C.; Pikal M. J. Role of thermodynamic, molecular, and kinetic factors in crystallization from the amorphous state. J. Pharm. Sci. 2008, 97, 1329–1349. 10.1002/jps.21138. [DOI] [PubMed] [Google Scholar]
- Bhattacharya S.; Suryanarayanan R. Local mobility in amorphous pharmaceuticals—characterization and implications on stability. J. Pharm. Sci. 2009, 98, 2935–2953. 10.1002/jps.21728. [DOI] [PubMed] [Google Scholar]
- Ambike A. A.; Mahadik K.; Paradkar A. Stability study of amorphous valdecoxib. Int. J. Pharm. 2004, 282, 151–162. 10.1016/j.ijpharm.2004.06.009. [DOI] [PubMed] [Google Scholar]
- Cherukuvada S.; Nangia A. Eutectics as improved pharmaceutical materials: design, properties and characterization. Chem. Commun. 2014, 50, 906–923. 10.1039/C3CC47521B. [DOI] [PubMed] [Google Scholar]
- Cherukuvada S.; Guru Row T. N. Comprehending the formation of eutectics and cocrystals in terms of design and their structural interrelationships. Cryst. Growth Des. 2014, 14, 4187–4198. 10.1021/cg500790q. [DOI] [Google Scholar]
- Law D.; Wang W.; Schmitt E. A.; Long M. A. Prediction of poly (ethylene) glycol-drug eutectic compositions using an index based on the van’t Hoff equation. Pharm. Res. 2002, 19, 315–321. 10.1023/A:1014499119549. [DOI] [PubMed] [Google Scholar]
- Oberoi L.; Alexander K.; Riga A. Evaluation of an index based on van’t Hoff equation to predict PEG-drug eutectic composition. J. Therm. Anal. Calorim. 2004, 78, 83–89. 10.1023/B:JTAN.0000042156.21899.de. [DOI] [Google Scholar]
- Jain H.; Khomane K. S.; Bansal A. K. Implication of microstructure on the mechanical behaviour of an aspirin–paracetamol eutectic mixture. CrystEngComm 2014, 16, 8471–8478. 10.1039/C4CE00878B. [DOI] [Google Scholar]
- Law D.; Wang W.; Schmitt E. A.; Qiu Y.; Krill S. L.; Fort J. J. Properties of rapidly dissolving eutectic mixtures of poly(ethylene glycol) and fenofibrate: the eutectic microstructure. J. Pharm. Sci. 2003, 92, 505–515. 10.1002/jps.10324. [DOI] [PubMed] [Google Scholar]
- Craig D. Polyethyelene glycols and drug release. Drug Dev. Ind. Pharm. 1990, 16, 2501–2526. 10.3109/03639049009058544. [DOI] [Google Scholar]
- Newa M.; Bhandari K. H.; Kim J. O.; Im J. S.; Kim J. A.; Yoo B. K.; Woo J. S.; Choi H. G.; Yong C. S. Enhancement of solubility, dissolution and bioavailability of ibuprofen in solid dispersion systems. Chem. Pharm. Bull. 2008, 56, 569–574. 10.1248/cpb.56.569. [DOI] [PubMed] [Google Scholar]
- Newa M.; Bhandari K. H.; Li D. X.; Kim J. O.; Yoo D. S.; Kim J.-A.; Yoo B.-K.; Woo J.-S.; Choi H.-G.; Yong C.-S. Preparation and evaluation of immediate release ibuprofen solid dispersions using polyethylene glycol 4000. Biol. Pharm. Bull. 2008, 31, 939–945. 10.1248/bpb.31.939. [DOI] [PubMed] [Google Scholar]
- Newa M.; Bhandari K. H.; Lee D. X.; Sung J. H.; Kim J. A.; Yoo B. K.; Woo J. S.; Choi H. G.; Yong C. S. Enhanced dissolution of ibuprofen using solid dispersion with polyethylene glycol 20000. Drug Dev. Ind. Pharm. 2008, 34, 1013–1021. 10.1080/03639040701744095. [DOI] [PubMed] [Google Scholar]
- Vippagunta S. R.; Wang Z.; Hornung S.; Krill S. L. Factors affecting the formation of eutectic solid dispersions and their dissolution behavior. J. Pharm. Sci. 2007, 96, 294–304. 10.1002/jps.20754. [DOI] [PubMed] [Google Scholar]
- Lacoulonche F.; Chauvet A.; Masse J.; Egea M.; Garcia M. An investigation of FB interactions with poly(ethylene glycol) 6000, poly (ethylene glycol) 4000, and poly-ϵ-caprolactone by thermoanalytical and spectroscopic methods and modeling. J. Pharm. Sci. 1998, 87, 543–551. 10.1021/js970443+. [DOI] [PubMed] [Google Scholar]
- Podolinsky V.; Taran Y. N. Influence of adsorption on structure formation in eutectic systems. J. Cryst. Growth 1981, 52, 82–87. 10.1016/0022-0248(81)90173-1. [DOI] [Google Scholar]
- Carstensen J. T.; Carstensen J. T.. Pharmaceutical Principles of Solid Dosage Forms; Technomic: Lancaster, PA, 1993. [Google Scholar]
- Bi M.; Hwang S.-J.; Morris K. R. Mechanism of eutectic formation upon compaction and its effects on tablet properties. Thermochim. Acta 2003, 404, 213–226. 10.1016/S0040-6031(03)00185-0. [DOI] [Google Scholar]
- Qi S.; Avalle P.; Saklatvala R.; Craig D. Q. An investigation into the effects of thermal history on the crystallisation behaviour of amorphous paracetamol. Eur. J. Pharm. Biopharm. 2008, 69, 364–371. 10.1016/j.ejpb.2007.10.008. [DOI] [PubMed] [Google Scholar]
- Newa M.; Bhandari K. H.; Kim J.-A.; Yoo B.-K.; Choi H.-G.; Yong C.-S.; Woo J.-S.; Lyoo W.-S. Preparation and evaluation of fast dissolving ibuprofen-polyethylene glycol 6000 solid dispersions. Drug Delivery 2008, 15, 355–364. 10.1080/10717540801952431. [DOI] [PubMed] [Google Scholar]
- Savchenko P. The nature of eutectics. Russ. J. Inorg. Chem. 1959, 4, 186–189. [Google Scholar]
- Naima Z.; Siro T.; Juan-Manuel G.-D.; Chantal C.; René C.; Jerome D. Interactions between carbamazepine and polyethylene glycol (PEG) 6000: characterisations of the physical, solid dispersed and eutectic mixtures. Eur. J. Pharm. Sci. 2001, 12, 395–404. 10.1016/S0928-0987(00)00168-8. [DOI] [PubMed] [Google Scholar]
- Rai U.; Singh O.; Singh N. B. Some thermodynamic aspects of organic eutectic in a monotectic type system. Can. J. Chem. 1987, 65, 2639–2642. 10.1139/v87-436. [DOI] [Google Scholar]
- Singh N.; Singh N. B.; Rai U.; Singh O. Structure of eutectic melts; binary organic systems. Thermochim. Acta 1985, 95, 291–293. 10.1016/0040-6031(85)80059-9. [DOI] [Google Scholar]
- Rai U.; Rai R. Phase diagram and thermochemical properties of organic eutectic in a monotectic system. Bull. Mater. Sci. 1998, 21, 203–206. 10.1007/BF02744970. [DOI] [Google Scholar]
- Yadav J. P. A.; Bansal A. K.; Jain S. Molecular Understanding and Implication of Structural Integrity in the Deformation Behavior of Binary Drug–Drug Eutectic Systems. Mol. Pharmaceutics 2018, 15, 1917–1927. 10.1021/acs.molpharmaceut.8b00077. [DOI] [PubMed] [Google Scholar]
- Dinge A.Eutectic Mixtures of Drugs with Poor Aqueous Solubility-Solid State Characterization and Dissolution Studies; Temple University Libraries, 2012. [Google Scholar]
- Margarit M. V.; Rodríguez I. C.; Cerezo A. Physical characteristics and dissolution kinetics of solid dispersions of ketoprofen and polyethylene glycol 6000. Int. J. Pharm. 1994, 108, 101–107. 10.1016/0378-5173(94)90320-4. [DOI] [Google Scholar]
- Chiou C. T.; Manes M. Application of the Flory–Huggins theory to the solubility of solids in glyceryl trioleate. J. Chem. Soc., Faraday Trans. 1 1986, 82, 243–246. 10.1039/f19868200243. [DOI] [Google Scholar]
Associated Data
This section collects any data citations, data availability statements, or supplementary materials included in this article.


