

Abstract
For sorption studies, the saturation vapor pressure p0 above an adsorbate is of great significance. For example, it is needed for the determination of the pore size distribution, the Laplace pressure, and the chemical potential. Above the bulk triple point, T3bulk, this pressure is identical with the saturation vapor pressure above the bulk liquid. However, below T3, the correct value of p0(T) is controversial. Nanoconfined fluids exhibit a shift of the freezing and melting temperatures in comparison to the bulk state. Thus, the adsorbed fluid is supercooled in a certain temperature range below T3bulk. Here, we show that it is possible to determine the appropriate saturation vapor pressure above the nanoconfined supercooled liquid experimentally. For this purpose, we have performed sorption measurements with liquid argon in nanoporous Vycor glass in the temperature range of the supercooled liquid and at temperatures above the bulk triple point. In order to determine the unknown and temperature-dependent saturation vapor pressure of the supercooled confined adsorbate, p0(T), we use the Kelvin equation relating this quantity to the pore radius, rP(p0), that is independent of temperature. The knowledge of the absolute values for the liquid–vapor surface tension of the supercooled adsorbate, γlv(T), is not required. However, we presuppose that its dependence on the unknown vapor pressure, γlv(p0), is bulk-like. Our results indicate that the saturation vapor pressure above the supercooled nanoconfined liquid corresponds to that above supercooled bulk argon (i.e., to the pressure obtained by an extension of the usual vaporization curve to T < T3). We expect that this method can be used for the determination of p0 above other supercooled adsorbates.
1. Introduction
The saturation vapor pressure p0 above an adsorbed liquid or solid is of great relevance for sorption studies, and several quantities are influenced by its value. Thus, the calculation of the chemical potential Δμ of pore condensate (in relation to the bulk state) and of the Laplace pressure pL via the Kelvin equation requires the saturation vapor pressure.1−6 The Laplace pressure causes both a deformation of the porous matrix—a phenomenon known as sorption-induced deformation—and a change of the elasticity of the adsorbate.5−11 Thus, without the correct value for the saturation vapor pressure, adsorption stress and the extent of deformation cannot be calculated.5 Also, for the determination of the pore size of a nanoporous material (via standard sorption methods), the knowledge of p0 is indispensable.12−14 The pore size, in turn, influences various properties of adsorbed fluids, for example, its phase transitions, crystalline structure, and elastic properties, as well as the flow of liquids through nanopores.1,2,6,7,15−25 Isothermal sorption measurements with liquid nitrogen or argon are the most common experimental techniques for the determination of pore size distributions.12−14
The saturation vapor pressure above argon (or any other substance) depends significantly on temperature (see the phase diagram of argon, Figure 1). For example, an increase of temperature causes an increase of the vapor pressure above liquid argon (see vaporization curve (red line) in Figure 1). This holds not only for the vapor pressure above the liquid but also for that above the solid (see the sublimation curve (blue line) in Figure 1). The vapor pressure above a supercooled liquid (below the bulk triple point, T3bulk) is higher than that above the solid at the same temperature.27 As a result of supercooling, the usual vaporization curve is extended below the bulk triple point (see the red dotted line in Figure 1).27
Figure 1.
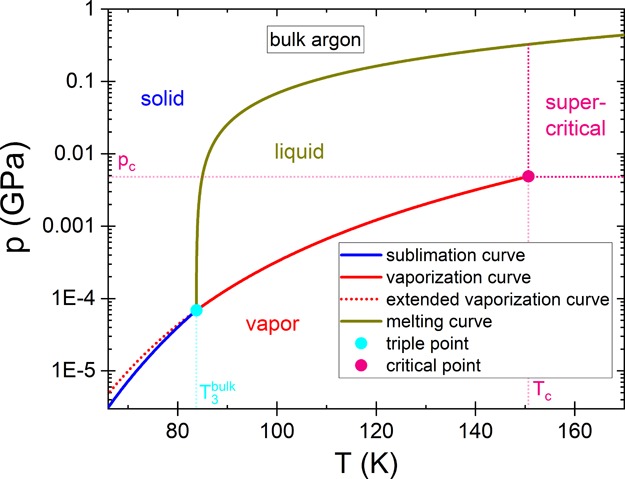
Pressure–temperature phase diagram of bulk argon. As it is well-known, the sublimation, melting, and vaporization curves correspond to the conditions where two phases are in equilibrium (solid–vapor, solid–liquid, or liquid–vapor). The vapor pressure above argon (or also other substances) depends significantly on temperature and the phase state. The temperature dependence of the vapor pressure above the solid (sublimation pressure, see blue line) differs from that above the liquid (see red line). If argon is supercooled, the usual vaporization curve is extended to temperatures below T3bulk = 83.8 K. Thus, the vapor pressure above supercooled argon generally deviates from the vapor pressure above the solid at the same temperature, and the extended vaporization curve (see red dotted line) is not identical to the sublimation curve. For information about the data used to construct the phase diagram, see ref (26).
However, for sorption measurements below the triple point of the bulk adsorbate, the value of p0 is not unambiguously defined. In nanopores, the melting and freezing temperatures are lowered, and in a certain temperature range below T3bulk, the adsorbate can still be liquid, that is, it is supercooled.16,28,29 The correct value for the saturation vapor pressure above the confined supercooled argon remains controversial,13,14 as it might deviate both from the sublimation pressure of bulk argon and from the extended vaporization pressure.
Previously, it was argued that argon cannot be used for the determination of the pore size below its triple point because of the unknown value of the saturation vapor pressure.13,14 However, Neimark at al. have compared the pore size distributions at 87 and 77 K for MCM-41, that is, for porous materials with an “hexagonal array of quasi-cylindrical” pores.27 Their results indicate that the pore sizes determined (using nonlocal density functional theory) from the desorption branch are similar at both temperatures, if for p0, at 77 K, the value of the extended vapor pressure of liquid bulk argon is used (i.e., the vaporization curve is extended below T3bulk using the same analytical expression as for T > T3).30 It remained open, whether this can be generalized to porous materials other than MCM-41.
For bulk substances, it is comparatively simple to determine the saturation vapor pressure above the (supercooled) liquid or solid (i.e., to measure directly the (extended) vaporization or sublimation curve). However, it is generally not straightforward to specify the saturation vapor pressure above a nanoconfined supercooled liquid: in a sorption experiment, below T3bulk, it is not possible to increase the vapor pressure up to its saturation value (see Section 3). Nevertheless, it is possible to determine experimentally the appropriate saturation vapor pressure above a nanoconfined supercooled fluid, as we shall show. For this purpose, we have performed an analysis of sorption measurements below and above the bulk triple point. The proposed method is based on the independence of the pore size distribution on temperature and the relation between pore size and saturation vapor pressure. As a simple model system, we use liquid or supercooled argon in nanoporous Vycor glass.
2. Method
We have performed several isothermal sorption measurements with liquid and supercooled argon. Our nanoporous sample is a piece of the well-known porous Vycor glass.31,32 The sample was placed in a closed metallic container on the cold head of a cryostat, which is connected to a temperature controller. For a schematic drawing and a more detailed description of the experimental setup, please see refs (33) and (34). All measurements were performed with the same sample. Before the measurements, it was cleaned using hydrogen peroxide and washed with distilled water (according to the recommendation of Corning, Inc.).31 After placing the sample into the sample cell, it was heated to ≈30 °C and evacuated for several hours. A higher temperature was not possible for outgassing because the sample cell is mounted on the cold head of a cryostat (maximum temperature permitted according to the manufacturer (Leybold): 40–50 °C). After measurements at two temperature values (labeled “series 1”), the sample was removed from the sample cell and stored in a desiccator before the other measurements (labeled “series 2”) were performed. The porous sample was filled and drained by changes of pressure in a gas distribution system that is connected to the sample cell via a metallic capillary. The molar amount of the adsorbate in the pores, n, at a particular pressure p can be calculated using either the ideal gas equation or the transit time of ultrasonic shear waves (see refs (12), (35), and (36)). During every isothermal sorption measurement, the pressure p is successively increased until the pores are completely filled (maximum molar amount: n0) at the saturation vapor pressure, p0. Thereafter, the filling fraction of the pores, f = n/n0, is again reduced by a stepwise decrease of the pressure p.
Figure 2 shows exemplarily the filling fraction f of a nanoporous Vycor glass sample with liquid argon at 86 K as a function of the vapor pressure p, that is, at a temperature above T3bulk = 83.8 K. As it is well known, the adsorption process starts with the formation of adsorbate layers on the pore surface.12 With increasing pressure p, the thickness of these layers increases up to a certain pressure above which capillary bridges form.12,13 When all pores are filled with capillary bridges, but the saturation vapor pressure is not yet reached, there still remain curved menisci at the pore ends. Only the increase of p up to the saturation vapor pressure pmax = 884.5 mbar causes a flattening of these menisci (see schematic sketches in Figure 2). During the initial desorption process, the reduction of p again causes the formation of curved liquid–vapor interfaces at the pore ends. At a certain value for the pressure (that depends in particular on the pore size), the capillary bridges vanish again, and the pores are emptied (the steep part of the desorption branch).
Figure 2.

Filling fraction f = n/n0 of a nanoporous Vycor glass sample with liquid argon as a function of the vapor pressure p at 86 K during adsorption (closed symbols) and desorption (open symbols). Complete saturation of the pores is reached at the saturation vapor pressure of liquid bulk argon, pmaxmeasured = 884.5 mbar. The pressure pD denotes the steepest point of the desorption branch. This pressure corresponds to the pore radius with the highest occurrence (see analysis). The sketches show schematically the filling of the pores in different pressure ranges.
The temperature range of our measurements between ≈76 and ≈86 K covers the complete liquid regime of argon in our nanoporous Vycor glass sample up to the normal boiling point.29,36,37 Previous measurements29 have shown that the adsorbed argon starts to freeze near the temperature value of 75.8 K in the nanopores of our Vycor glass samples (i.e., it freezes below the bulk freezing/melting temperature Tmbulk ≈ T3 ≈ 84 K);2,28 the normal boiling temperature of argon is ≈87.3 K (see ref (38)). Thus, for temperatures between ≈76 and ≈84 K, the adsorbed argon remains liquid-like, that is, it is supercooled.29
3. Results and Discussion
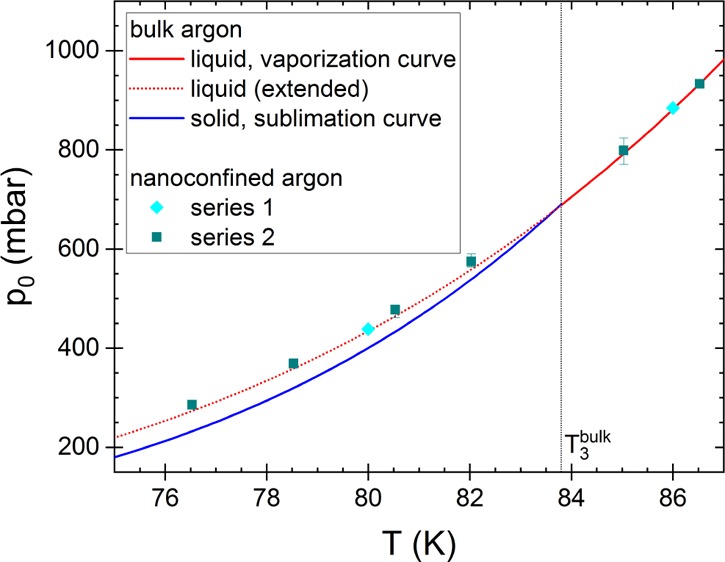
Generally, in sorption experiments on porous media, the pressure in the sample cell can only be increased up to the saturation vapor pressure at the temperature of the isothermal measurement, that is, pmaxmeasured = p0 holds. Any further argon added into the sample cell will condense at its walls. Figure 3 displays sorption isotherms with liquid argon in nanoporous Vycor glass at two temperature values, that is, below and above the bulk triple point (80 and 86 K). The reduction of temperature by only 6 K lowers the saturation vapor pressure by more than a factor of two. Figure 4 illustrates the temperature dependence of the saturation vapor pressure above liquid or solid bulk argon for the complete temperature range of our measurements (76 K ≲ T ≲ 86 K). The measured values determined as the maximum pressure reachable during sorption experiments at different temperatures in two series of measurements with the same sample39 are virtually identical with the literature values for p0, that is, they correspond to the values given by the vaporization and sublimation curves, respectively (cp. with Figure 1; for detailed information on the data used, see ref (26)). Thus, this result confirms that
 |
1 |
Figure 3.
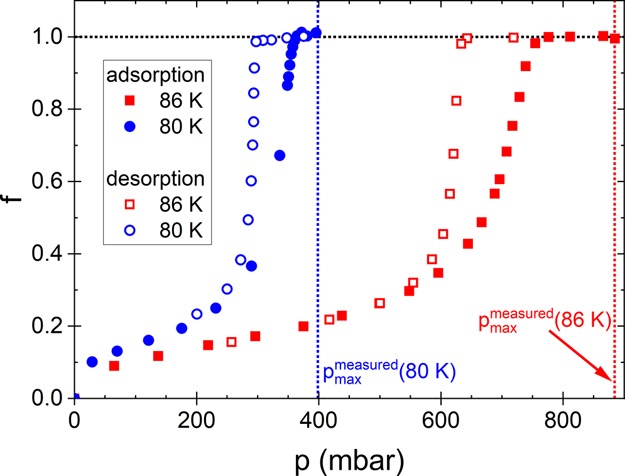
Filling fraction of the pores of Vycor glass with argon as a function of the vapor pressure p at two temperatures, one below and one above T3bulk = 83.8 K. At the lower temperature (80 K) the filling of the pores is achieved at considerably lower values for the pressure. Both the adsorption and desorption branches are shifted to lower pressure values. The maximum pressure, pmax, decreases from 884.5 mbar at 86 K to 398.3 mbar at 80 K.
Figure 4.

Saturation vapor pressure above liquid and solid bulk argon as a function of temperature. The lines show the saturation pressure above liquid and solid bulk argon known from the literature (sublimation and vaporization curves; for information about the data used, see ref (26)). At the triple point of bulk argon (T3bulk = 83.8 K), both curves have different slopes. In addition, we have determined the pressure values experimentally from two series of sorption experiments [series 1: diamonds (at 80 and 86 K); series 2: squares (at various temperatures)]. During sorption isotherm above T3, the pressure in the sample cell increases until the porous sample is completely saturated with liquid argon at the saturation vapor pressure above liquid bulk argon, p0bulk,liquid (see red symbols; the red arrow indicates the path p(t) followed during an adsorption isotherm). Below T3, the maximum pressure p that can be reached in the sample cell is equal to the saturation vapor pressure above solid bulk argon, p0bulk,solid (see blue symbols; blue arrow: path p(t) followed during an adsorption isotherm), because the vapor sublimates at the walls of the cell. However, as the supercooled adsorbate in the nanopores is liquid-like, it may have a higher saturation vapor pressure (see the dotted blue arrow: part of the adsorption path that is not accessible in the experiment. The question mark indicates that the true saturation vapor pressure, p0, is unknown.).
Above T3bulk, the nanopores are completely saturated when the vapor pressure p0 is attained, that is, f = 1 holds (see sketch in Figure 5a). Below T3bulk, the pressure in the sample cell can only be increased up to the saturation vapor pressure above solid bulk argon, pmax = p0bulk,solid, where solid argon starts to sublime at the walls of the measurement cell. However, in contrast to this bulk argon outside the sample, the adsorbate in the pores remains liquid-like in a certain temperature range below the bulk triple point (76 K ≲ T ≲ 83.8 K).29 As the adsorbate is not solid but liquid-like, we may expect that the saturation vapor pressure for the adsorbate is somewhat higher than that above solid bulk argon, p0 > p0bulk,solid. In consequence, it is not possible to achieve a complete saturation of the pores during sorption measurements below the bulk triple point. Nevertheless, for porous Vycor glass, the measurements show that the pores are basically completely filled, as the plateau value (f ≈ 1) is already reached (see Figure 3 for T = 80 K). Only the menisci at the liquid–vapor interface near the surface of the sample still have a certain curvature (because p0 < p0ads,supercooled), which does not noticeably influence the filling fraction (see the sketch in Figure 5b). These menisci will not flatten by the addition of further argon in the sample cell (as long as there is still vapor in the sample cell). Summarizing, it is not possible to attain the saturation vapor pressure above the nanoconfined supercooled argon below the triple point of bulk argon. This observation raises the question of how to determine the appropriate pressure for the supercooled argon. In the following, we will demonstrate that a pore size analysis offers this possibility.
Figure 5.
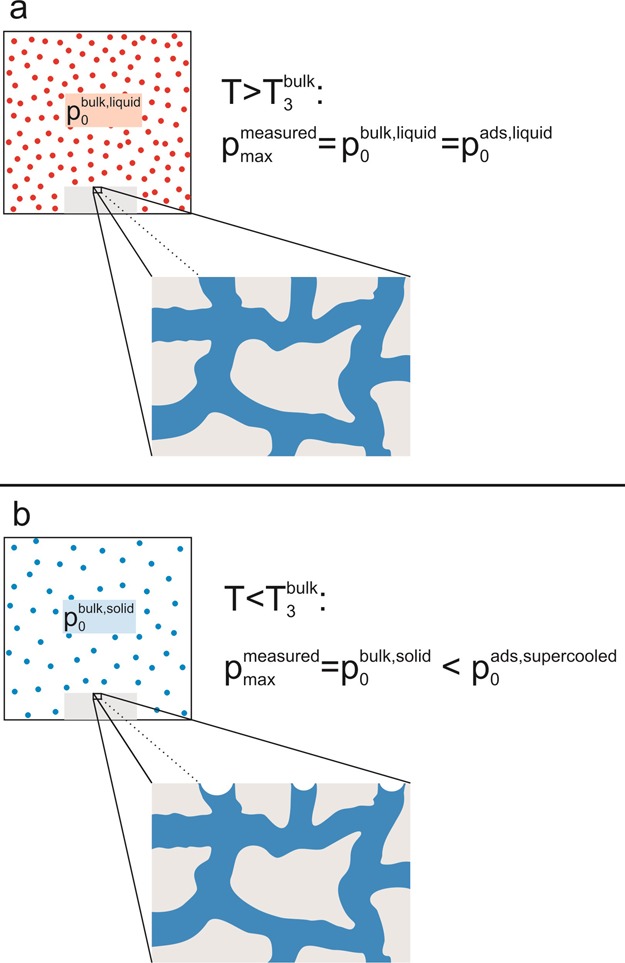
Above the triple point of bulk argon, the pores of the porous sample are completely saturated at the vapor pressure of liquid bulk argon, p0bulk,liquid (see panel a). However, below T3, complete saturation of the pores cannot be achieved. The maximum pressure that can be reached in the sample cell is the saturation vapor pressure above solid bulk argon, p0bulk,solid. However, the adsorbed argon remains liquid-like in a certain temperature range. Thus, we can expect that the adsorbate has a higher saturation vapor pressure than solid bulk argon, that is, p0 > p0bulk,solid. In consequence, the adsorbate in the pores exhibits curved liquid–vapor interfaces at the pore ends (see panel b).
As the plateau value of isothermal adsorption is reached also during the measurements done below T3bulk (see Figure 3 above ≈360 mbar for T = 80 K), the pores are filled, even if the actual saturation vapor pressure is not reached. The curved menisci occur at the pore ends and have no impact on the spatial distribution of the pore condensate, that is, they should not alter the desorption process.40 Consequently, the form of the measured desorption branch is not changed, and an analysis of the pore size distribution will supply the correct values, assuming that the appropriate parameters are used.
The dependence of the filling fraction on the relative pressure contains information about the average pore radius and the pore size distribution.12−14 We will utilize this information to deduce the correct saturation vapor pressure above the adsorbed fluid (for T < T3bulk). In the classical method, the desorption branch is used to deduce the pore size distribution. In the steep part, the pores are successively emptied and capillary bridges disappear (see Figures 2 and 8).12 The Kelvin equation relates the relative pressure p/p0 with the radius of withdrawing menisci (the Kelvin radius rK) via12
| 2 |
with the gas constant R, the molar volume of the adsorbate, Vm, and the liquid–vapor surface tension, γlv, at the temperature of the isothermal sorption measurement. For argon, complete wetting of the adsorbed liquid is generally presupposed, that is, a contact angle of θ = 0° between the curved menisci and the surface layer, so that cos(θ) = 1 holds.
Figure 8.
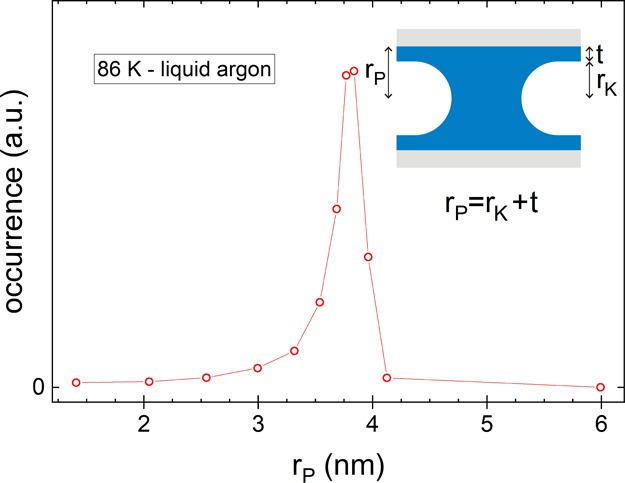
Pore size distribution for the nanoporous Vycor glass sample obtained by the analysis of the desorption branch of a sorption isotherm with liquid argon at 86 K. For its calculation, we have used the Kelvin and Halsey equations (see text).
The pore radius rP = rK + t is the sum of the Kelvin radius and the thickness t of the remaining layer on the pore surface (see Figure 8). For an approximation of the thickness t of this argon layer, usually, empirical equations are used, such as the Halsey equation.12 This equation relates the relative pressure p/p0 to the thickness t of the adsorbed layer consisting of z monolayers via12
| 3 |
where u denotes the thickness of one argon monolayer. This thickness u, in turn, can be estimated from the density ρliquid of bulk argon via u ≈ [M/(ρliquidNA)]1/3 with the molar mass, M = 39.948 g/mol, and the Avogadro constant NA.34
As mentioned above, a reduction of the relative pressure results in a successive emptying of the porous material. The slope of the desorption branch at a particular relative pressure p/p0 can be regarded as a measure of the occurrence of the radius of the pores emptying at that pressure. Thus, the derivative of the filling fraction f with respect to the relative pressure yields the pore size distribution with the aid of the Kelvin and Halsey equations.
For the analysis, we have to know Vm, γlv (see eq 2), and u (see eq 3) at the temperatures studied. Above the triple point of bulk argon, T3bulk, we have used the literature values for the density of liquid bulk argon ρliquid to determine the molar volume Vm = M/ρliquid (see Figure 6a). For the temperature range below T3 ≈ 83.8 K, we have used extrapolated values for the density of liquid bulk argon. From a previous study, we know that for supercooled argon, the temperature dependence of the adsorbed argon’s density is similar to that of liquid bulk argon.36 This finding supports the use of the extrapolated values of the molar volume of liquid bulk argon below T3bulk (see Figure 6a).44 From the density values, we also calculate the thickness of an argon monolayer, u (see eq 3). The temperature dependence of u is negligible in the temperature range studied (u ≈ 0.36 nm for 76 K ≲ T ≲ 86 K, see Figure 6b).
Figure 6.

(a) Molar volume Vm of liquid bulk argon as a function of temperature. The values are calculated using the following equation (based on experimental data for the saturated liquid):41,42 ρliquid = ρc exp(b1θ0.334 + b2θ2/3 + b3θ7/3 + b4θ4), with θ = 1 – T/Tc, Tc = 150.687 K, ρc = 535.6 kg/m3, b1 = 1.5004262, b2 = −0.31381290, b3 = 0.086461622, and b4 = −0.041477525.43 The data below the bulk triple point are extrapolated using the same equation. (b) The thickness of an argon monolayer, u, was approximated from the density via the relation u = [M/(ρNA)]1/3 (see text below eq 3). In the temperature range studied (76 K ≲ T ≲ 86 K), u is almost constant.
The determination of the appropriate surface tension is a more complicated issue. One may argue that the surface tension can be lowered in nanopores.46,47 It is known that the surface tension depends on the curvature of the interface.48−51 The effect of variation of the surface tension with the curvature becomes noticeable for radii below approximately 10 nm.52 However, for liquid argon, the effect on the calculated pore size would be comparatively small for the pore size of Vycor glass and, in particular, the effect would be almost independent of temperature (the Kelvin equation has to be corrected using a multiplier [correction factor] that is almost independent of temperature, see the information in refs (48) and (52)). Therefore, above T3bulk, the use of the bulk values for the surface tension will not noticeably affect the temperature dependence of the calculated pore size. From experimental data, Lemmon and Penoncello established the following equation for the liquid–vapor surface tension of bulk argon:45 γlv = γ0(1 – T/Tc)x, with γ0 = 37.898063 mN/m and x = 1.278.53 Again, we also need the values below the bulk triple point. We will not simply extend the validity range of this relation for the surface tension below the bulk triple point because surface tension is related to the unknown saturation vapor pressure that we want to determine.54 It is obvious that a decrease in surface tension results in a lower energy barrier for the atoms to escape into the vapor and hence in a higher saturation vapor pressure.54 Indeed, the following empirical relation between the two quantities was proposed (for various liquids)54
| 4 |
with constants a and b and molecular weight M. In the temperature range of our measurements, we can neglect the low density of the argon vapor, ρvapor, in the denominator, and eq 4 becomes
| 5 |
with the molar volume of liquid argon, Vm = M/ρliquid. Although eq 4 is an empirical relation, Pollara deduced eq 5 also via a “semithermodynamical reasoning”. Figure 7 shows the validity of this relation for bulk argon in the temperature range 83.8 K ≤ T ≤ 100 K, that is, the linear relation between T ln(p0) and γVm2/3. Assuming that this relation (eq 5) holds both in bulk and nanoconfinement for liquid and supercooled argon, we may substitute γlv in the Kelvin equation (eq 2) by a function of p0 using eq 5 with the parameters stated in the legend to Figure 7
| 6 |
Figure 7.

Relation between T ln(p0) and γlvVm2/3 for bulk argon for 83.8 K ≤ T ≤ 100 K, that is, above T3bulk. For the calculation, we have used the data of the vaporization curve (for p0 in Pa; see ref (26)), molar volume Vm (in m3/mol; see Figure 6), and the liquid–vapor surface tension γlv (in N/m; equation established by Lemmon and Penoncello;45 see text). Obviously, the parameters a and b in eq 5 are constant in this temperature range. A fit to the data yields a = −1.02779 × 10⁸ ± 4803 and b = 2211.13 ± 0.05.
Thus, we do not have to extrapolate absolute values for the liquid–vapor surface tension (equation by Lemmon and Penoncello, see above) to temperatures below the bulk triple point. The analysis via eq 6 (for temperatures below T3bulk) assumes only a bulk-like pressure dependence γlv(p0) on the possibly altered vapor pressure (see eq 5). (Note that eq 6 is not necessarily universally valid: for other liquids, it may be necessary to combine eq 2 with a different relation γlv(p0) instead of eq 5.)
With the method described above, we have calculated the pore size distribution of our porous Vycor glass sample at 86 K, that is, in the liquid regime near the normal boiling temperature, where the vapor pressure p0 = p0bulk,liquid is known (see Figure 8). We denote the radius with the highest occurrence as rPD = 3.8 nm; that is, the value of rP at the steepest point of the desorption branch (see Figure 2 at p = pD).
A variation of temperature in the range of 76 K ≲ T ≲ 86 K should not noticeably alter the pore size distribution or the average pore size. Because of the low value of the thermal expansion coefficient of nanoporous Vycor glass (≈8 × 10⁻⁷ K–1; value from ref (55)), we can assume that the pore size of the empty sample does not appreciably differ in this small temperature range. Also, the sorption-induced deformation of the porous glass, which is related to the so-called solvation pressure (that includes the Laplace pressure), has no noticeable effect on the pore size of the sample. The maximum deformation caused by the adsorption of liquid argon is in the range of ΔV/V0 = 3Δl/l0 ≈ 1 × 10⁻³ (see ref (11)). Furthermore, in the temperature range studied (76 K ≲ T ≲ 86 K), the sorption-induced deformation of the sample varies by less than ΔV/V0 ≈ 2.3 × 10⁻⁴ (see Figure 1 in ref (11); Δl ≈ 0.2 μm, l0 ≈ 2.66 mm).
To simplify the analysis, we use in the following the requirement that the pore radius with the highest occurrence, rPD, is constant. This pore radius is related to the pressure pD with the highest value for the slope df/d(p/p0) (see above) via the Kelvin and Halsey equations (eqs 3 and 6)
| 7 |
where the constant is the value of rPD evaluated in the temperature range T3bulk < T < Tboiling (in our case rPD = 3.8 nm see Figure 8). Therefore, we can determine the unknown saturation vapor pressure of the adsorbed liquid by solving this equation numerically for p0. The measured values for the steepest point of the desorption isotherm, pD, are shown in Figure 9 as a function of temperature.
Figure 9.
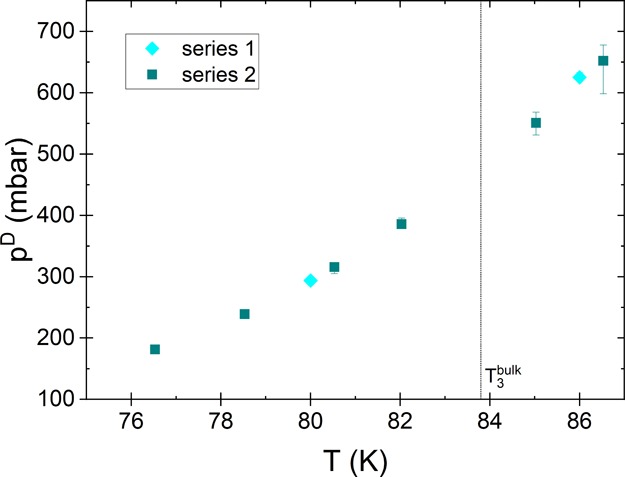
Temperature dependence of the measured pressure of the steepest point of the desorption isotherm, pD. The figure shows that the steep part of the isotherm shifts to lower pressure values with decreasing temperature.
Thus, we can use sorption measurements below the bulk triple point to determine the saturation vapor pressure (above the supercooled liquid) experimentally using eq 7. The result of these calculations is shown in Figure 10. The analysis for T < T3bulk reveals that the saturation pressure above the supercooled liquid is indeed higher than the vapor pressure over solid argon (sublimation pressure of bulk argon), and the values are similar to the extrapolated values of the vapor pressure over liquid argon, that is,
| 8 |
holds for T < T3bulk. For the extrapolation of the usual saturation vapor pressure (above the bulk liquid) to temperature belowT3, we have used the same analytical expression as above the bulk triple point, that is, we have extended the vaporization curve of bulk argon below T3bulk (see the vaporization curve in Figure 1 and ref (26)).
Figure 10.
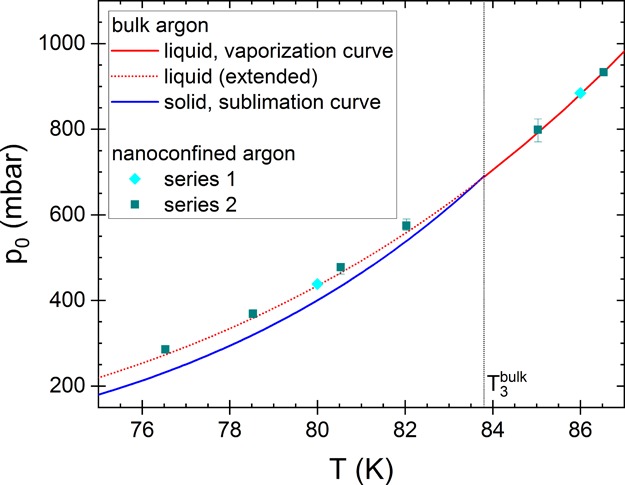
Comparison of the saturation vapor pressure above the adsorbed argon as well as that above bulk argon above and below the bulk triple point, T3bulk. Above T3, the saturation pressure above the adsorbed argon is about equal to that above liquid bulk argon (as expected), and below T3bulk, it is about equal to the saturation vapor pressure above the supercooled liquid bulk argon. The solid lines correspond to the literature values for liquid and solid bulk argon (see Figure 4). For an extrapolation of the saturation vapor pressure above liquid bulk argon below T3, we have used the same equation as for liquid argon above T3bulk (dotted line; extended vaporization curve; see text and Figure 1).
Our experimental data thus support the analysis of Neimark et al.27 who have determined the pore size distribution of MCM-41 at 87 and 77 K using nonlocal density functional theory. At the latter temperature, they used the extrapolated values above supercooled bulk argon (the extended vaporization curve) for the saturation vapor pressure above the supercooled liquid. With this procedure, they obtained similar pore size distributions at both temperatures, which indirectly indicated that the saturation vapor pressure above a supercooled nanoconfined liquid is similar to that extrapolated value (and differs from the pressure on the sublimation curve). Although for argon in Vycor, we found that relation 8 is valid, this may not be the case for other systems. In particular, for nanoporous systems with smaller pore sizes than that of Vycor, we may expect deviations because of interactions between the adsorbate and pore surface. Deviations may also occur in systems with a stronger interaction between pore surface and adsorbate . When nanoconfinement changes the molecular arrangement of the adsorbate (e.g., of alkanes24), this might also affect the saturation vapor pressure (and the surface tension). In addition, note that this experimental method enables the detection of such deviations because the analysis does not rely on relation 8.
For our porous system, a change of temperature obviously did not cause a change of the desorption mechanism. For other porous systems that empty via cavitation56−58 or exhibit a change of the desorption mechanism with temperature,59 it could be advantageous to use the adsorption branch for the determination of the appropriate saturation vapor pressure. The analysis can be performed in an analogous manner. The only difference is that the Kelvin equation has to be corrected because of the cylindrical menisci (the factor 2 has to be omitted in eq 2). In any case, it is of particular importance to use isotherms reflecting equilibrium transitions (the waiting time after each filling step has to be sufficiently long to allow for a spatial rearrangement of the adsorbate). For example, it took us typically two weeks to measure a complete adsorption and desorption isotherm (see Figure 3). Generally, the analysis may not remain limited to the pore size with the highest occurrence, rPD. However, when the form of the pore size distribution is studied as a function of temperature, the adsorption and desorption steps must be narrow (and similar) at all temperatures as they influence the calculated distribution.
Concluding, we would like to emphasize the importance of knowing the correct saturation vapor pressure above the adsorbed fluid. Errors in p0ads can give rise to misleading interpretations, for example, when studying the pore size distribution. If we would use eqs 2 and 3 with the measured values pmax (see Figure 4) instead of the correct values for p0 (see Figure 10) to evaluate the pore size, we would obtain the results shown in Figure 11. Considering the fact that the pore size does not change with temperature (i.e., rPD = rKD + tD = const.), these results could be explained by a change in the wetting of the adsorbed argon (see factor cos(θ) in eq 2). Certainly, it is known that temperature influences the contact angle.60,61 Thus, complete wetting may be present at higher temperatures, but this could change when decreasing the temperature. The analysis would implicate a considerable change in the wetting; that is, the contact angle would have to change from θ = 0° at 86 K to θ ≈ 60° at 76.5 K (cos(θ) ≈ 0.5, see Figure 11c). We consider such an increase to be too large for a temperature change of only 9.5 K, particularly because it is not related to any phase transition.62
Figure 11.

Consequences of an erroneous data analysis using incorrect values for the saturation vapor pressure. (a) Apparent Kelvin radius rKD divided by cos(θ) and (b) apparent thickness tD of the argon layer remaining on the pore surface as a function of temperature calculated using p0ads = pmax for both T > T3bulk and T < T3. The pore size rPD = rKD + tD could be kept constant assuming a significant decrease of cos(θ) with decreasing temperature (see panel c), corresponding to an increase of the contact angle from θ = 0° at 86 K to θ ≈ 60° at 76.5 K.
4. Conclusions and Outlook
Summarizing, we have shown that it is possible to determine the saturation vapor pressure above supercooled argon confined in nanoporous Vycor glass. In sorption experiments, this pressure cannot be measured directly because below the triple point of bulk argon, the pressure in the sample cell can only be increased up to the saturation vapor pressure above solid argon (sublimation curve). Now, our analysis shows that the appropriate saturation vapor pressure above the supercooled liquid can be evaluated using sorption experiments. The method relies on the temperature independence of the pore size. Using the Kelvin equation that relates the pore size to the saturation vapor pressure, we determine the appropriate values for p0 below the bulk triple point via a reference measurement above T3bulk. This analysis requires that a relation γlv(p0) between surface tension and saturation vapor pressure is known, even though the absolute values of p0 and γlv are unknown. Depending on the liquid under investigation, this may not necessarily be eq 5 we have used for argon but another specific relation, either empirically derived or based on theoretical thermodynamics. Be that as it may, such relations γlv(p0) can usually be established for the bulk state. Their validity in the supercooled state is an essential assumption in our analysis—but it is less demanding than assuming bulk values for γlv(T).
The results for argon indicate that the vapor pressure is similar to that above supercooled bulk argon. We expect that this experimental method can be generalized to other adsorbates and porous materials with low thermal expansion. Thus, it opens the possibility to determine the saturation vapor pressure above various supercooled adsorbates. Currently, the results indicate that the saturation vapor pressure is the same above supercooled argon in bulk or nanoconfinement. However, further studies (with other adsorbates and also other porous matrices) are necessary before a generalization to other systems. For this purpose, we intend to perform measurements with other supercooled adsorbates (e.g., nitrogen or oxygen) as well as with commonly used porous materials like porous aluminum oxide, porous silicon, or other porous glasses. In general, the proposed method may be used to detect deviations from the (extrapolated) saturation vapor pressure above the bulk liquid (extended vaporization curve). Only the knowledge of the appropriate value for p0 will enable the correct analysis of sorption measurements below the bulk triple point, for example, when interpreting changes in the chemical potential as a result of phase transitions or when studying the effects of the Laplace pressure during sorption-induced deformation.
Acknowledgments
We acknowledge support by the Deutsche Forschungsgemeinschaft (DFG, German Research Foundation) and the Universität des Saarlandes (Saarland University) within the funding program “Open Access Publishing.”
The authors declare no competing financial interest.
References
- Huber P.; Knorr K. Adsorption-desorption isotherms and x-ray diffraction of Ar condensed into a porous glass matrix. Phys. Rev. B: Condens. Matter Mater. Phys. 1999, 60, 12657–12665. 10.1103/physrevb.60.12657. [DOI] [Google Scholar]
- Wallacher D.; Knorr K. Melting and freezing of Ar in nanopores. Phys. Rev. B: Condens. Matter Mater. Phys. 2001, 63, 104202. 10.1103/physrevb.63.104202. [DOI] [Google Scholar]
- Hofmann T.; Wallacher D.; Huber P.; Knorr K. Triple Point Behavior of Ar and N2 in Mesopores. J. Low Temp. Phys. 2005, 140, 91–103. 10.1007/s10909-005-6014-5. [DOI] [Google Scholar]
- Prass J.; Müter D.; Fratzl P.; Paris O. Capillarity-driven deformation of ordered nanoporous silica. Appl. Phys. Lett. 2009, 95, 083121. 10.1063/1.3213564. [DOI] [Google Scholar]
- Gor G. Y.; Huber P.; Bernstein N. Adsorption-induced deformation of nanoporous materials–A review. Appl. Phys. Rev. 2017, 4, 011303. 10.1063/1.4975001. [DOI] [Google Scholar]
- Schappert K.; Pelster R. Influence of the Laplace pressure on the elasticity of argon in nanopores. Europhys. Lett. 2014, 105, 56001. 10.1209/0295-5075/105/56001. [DOI] [Google Scholar]
- Gor G. Y. Adsorption Stress Changes the Elasticity of Liquid Argon Confined in a Nanopore. Langmuir 2014, 30, 13564–13569. 10.1021/la503877q. [DOI] [PubMed] [Google Scholar]
- Balzer C.; Waag A. M.; Gehret S.; Reichenauer G.; Putz F.; Hüsing N.; Paris O.; Bernstein N.; Gor G. Y.; Neimark A. V. Adsorption-Induced Deformation of Hierarchically Structured Mesoporous Silica – Effect of Pore-Level Anisotropy. Langmuir 2017, 33, 5592–5602. 10.1021/acs.langmuir.7b00468. [DOI] [PMC free article] [PubMed] [Google Scholar]
- Vandamme M. Coupling between adsorption and mechanics (and vice versa). Curr. Opin. Chem. Eng. 2019, 24, 12–18. 10.1016/j.coche.2018.12.005. [DOI] [Google Scholar]
- Brochard L.; Vandamme M.; Pellenq R. J.-M.; Fen-Chong T. Adsorption-Induced Deformation of Microporous Materials: Coal Swelling Induced by CO2–CH4 Competitive Adsorption. Langmuir 2012, 28, 2659–2670. 10.1021/la204072d. [DOI] [PubMed] [Google Scholar]
- Schappert K.; Reiplinger N.; Pelster R. Correlation between the Sorption-Induced Deformation of Nanoporous Glass and the Continuous Freezing of Adsorbed Argon. Langmuir 2016, 32, 7741–7746. 10.1021/acs.langmuir.6b01533. [DOI] [PubMed] [Google Scholar]
- Lowell S.; Shields J. E.; Thomas M. A.; Thommes M.. Characterization of Porous Solids and Powders: Surface Area, Pore Size and Density; Kluwer Academic Publishers: Dordrecht, The Netherlands, 2004. [Google Scholar]
- Rouquerol F.; Rouquerol J.; Sing K. S. W.; Llewellyn P.; Maurin G.. Adsorption by Powders and Porous Solids | Principles, Methodology and Applications, 2nd ed.; Academic Press: Oxford, 2014. [Google Scholar]
- Gregg S.; Sing K.. Adsorption, Surface Area, and Porosity; Academic Press: London, 1982. [Google Scholar]
- Huber P. Soft matter in hard confinement: phase transition thermodynamics, structure, texture, diffusion and flow in nanoporous media. J. Phys.: Condens. Matter 2015, 27, 103102. 10.1088/0953-8984/27/10/103102. [DOI] [PubMed] [Google Scholar]
- Christenson H. K. Confinement effects on freezing and melting. J. Phys.: Condens. Matter 2001, 13, R95–R133. 10.1088/0953-8984/13/11/201. [DOI] [Google Scholar]
- Alba-Simionesco C.; Coasne B.; Dosseh G.; Dudziak G.; Gubbins K. E.; Radhakrishnan R.; Sliwinska-Bartkowiak M. Effects of confinement on freezing and melting. J. Phys.: Condens. Matter 2006, 18, R15–R68. 10.1088/0953-8984/18/6/r01. [DOI] [PubMed] [Google Scholar]
- Morishige K.; Mikawa K. Pore Size Dependence of Melting Point for Kr Confined in Crystalline Carbon Pores. J. Phys. Chem. C 2012, 116, 14979–14985. 10.1021/jp303985a. [DOI] [Google Scholar]
- Gor G. Y.; Siderius D. W.; Rasmussen C. J.; Krekelberg W. P.; Shen V. K.; Bernstein N. Relation between pore size and the compressibility of a confined fluid. J. Chem. Phys. 2015, 143, 194506. 10.1063/1.4935430. [DOI] [PMC free article] [PubMed] [Google Scholar]
- Schappert K.; Pelster R. Requirements to Determine the Average Pore Size of Nanoporous Media Using Ultrasound. ACS Omega 2018, 3, 18906–18910. 10.1021/acsomega.8b03091. [DOI] [PMC free article] [PubMed] [Google Scholar]
- Dobrzanski C. D.; Maximov M. A.; Gor G. Y. Effect of pore geometry on the compressibility of a confined simple fluid. J. Chem. Phys. 2018, 148, 054503. 10.1063/1.5008490. [DOI] [PubMed] [Google Scholar]
- Schappert K.; Naydenov V.; Pelster R. Oxygen in Nanopores: A Study on the Elastic Behavior of Its Solid Phases. J. Phys. Chem. C 2016, 120, 25990–25995. 10.1021/acs.jpcc.6b10439. [DOI] [Google Scholar]
- Schappert K.; Pelster R. Strongly enhanced elastic modulus of solid nitrogen in nanopores. Phys. Rev. B: Condens. Matter Mater. Phys. 2013, 88, 245443. 10.1103/physrevb.88.245443. [DOI] [Google Scholar]
- Schappert K.; Gemmel L.; Meisberger D.; Pelster R. Elasticity and phase behaviour of n-heptane and n-nonane in nanopores. Europhys. Lett. 2015, 111, 56003. 10.1209/0295-5075/111/56003. [DOI] [Google Scholar]
- Sun Z.; Kang Y.; Kang Y. Density Functional Study on Enhancement of Modulus of Confined Fluid in Nanopores. Ind. Eng. Chem. Res. 2019, 58, 15637–15648. 10.1021/acs.iecr.9b02437. [DOI] [Google Scholar]
- We have calculated the temperature dependent values for the vapor pressure above liquid bulk argon (vaporization curve) via the equation established by Gilgen et al.42 on the basis of measured values (eq 1 from ref (42)): p0 = pc exp[Tc/T(a1θ + a2θ1.5 + a3θ2 + a4θ4.5)] with θ = 1 – T/Tc, the critical temperature Tc = 150.687 K, the critical pressure pc = 4.863 MPa, and the coefficients a1 = −5.9409785, a2 = 1.3553888, a3 = −0.46497607, and a4 = −1.5399043 (values for coefficients from ref (41)). The data for the vapor pressure determined with the equation of state developed by Tegeler et al.41 (and used by the NIST) deviate not more than ±0.01% from Gilgen’s equation.41 The vapor pressure above solid bulk argon (sublimation curve) was calculated with eq 1.62 from ref (63) (established on the basis of experimental data): p0 = 101325/760·107.6937–417.30/T. For the melting curve we used the modified Simon equation established (on the basis of experimental data) by Hardy et al.64 (see also ref (63)): p0 = A(T + D)c + B with A = 4.9931349 × 10⁵, B = −1484.9379 × 105, c = 1.4305675, and D = −30.179276. The data for the triple point of bulk argon are from Tegeler et al.:41T3bulk = 83.8058 K and p3 = 68.891 kPa.
- Neimark A. V.; Ravikovitch P. I.; Grün M.; Schüth F.; Unger K. K. Pore Size Analysis of MCM-41 Type Adsorbents by Means of Nitrogen and Argon Adsorption. J. Colloid Interface Sci. 1998, 207, 159–169. 10.1006/jcis.1998.5748. [DOI] [PubMed] [Google Scholar]
- Molz E.; Wong A. P. Y.; Chan M. H. W.; Beamish J. R. Freezing and melting of fluids in porous glasses. Phys. Rev. B: Condens. Matter Mater. Phys. 1993, 48, 5741–5750. 10.1103/physrevb.48.5741. [DOI] [PubMed] [Google Scholar]
- Schappert K.; Pelster R. Continuous Freezing of Argon in Completely Filled Mesopores. Phys. Rev. Lett. 2013, 110, 135701. 10.1103/physrevlett.110.135701. [DOI] [PubMed] [Google Scholar]
- Note that Neimark et al.27 used for the vaporization curve the expression from ref (63). The pressure values calculated with this equation differ by less than 0.35% from those calculated with the equation established by Gilgen et al.42 (see ref (26)).
- Data sheet for porous Vycor 7930; Corning, Inc.
- Handbook of Porous Solids; Schüth F., Sing K. S. W., Weitkamp J., Eds.; Wiley-VCH Verlag: Weinheim, Germany, 2002; Vol. 3. [Google Scholar]
- Schappert K.; Pelster R. Unexpected Sorption-Induced Deformation of Nanoporous Glass: Evidence for Spatial Rearrangement of Adsorbed Argon. Langmuir 2014, 30, 14004–14013. 10.1021/la502974w. [DOI] [PubMed] [Google Scholar]
- Schappert K.; Pelster R. Elastic properties and freezing of argon confined in mesoporous glass. Phys. Rev. B: Condens. Matter Mater. Phys. 2008, 78, 174108. 10.1103/physrevb.78.174108. [DOI] [Google Scholar]
- Warner K. L.; Beamish J. R. Ultrasonic measurement of the surface area of porous materials. J. Appl. Phys. 1988, 63, 4372–4376. 10.1063/1.340179. [DOI] [Google Scholar]
- Schappert K.; Pelster R. Temperature Dependence of the Longitudinal Modulus of Liquid Argon in Nanopores. J. Phys. Chem. C 2018, 122, 5537–5544. 10.1021/acs.jpcc.7b12839. [DOI] [Google Scholar]
- Schappert K.; Pelster R. Liquid Argon in Nanopores: The Impact of Confinement on the Pressure Dependence of the Adiabatic Longitudinal Modulus. J. Phys. Chem. C 2018, 122, 27425–27432. 10.1021/acs.jpcc.8b08136. [DOI] [Google Scholar]
- Lemmon E. W.; McLinden M. O.; Friend D. G.. Thermophysical Properties of Fluid Systems. In NIST Chemistry WebBook; Linstrom P. J., Mallard W. G., Eds.; NIST Standard Reference Database Number 69; National Institute of Standards and Technology: Gaithersburg, MD, https://webbook.nist.gov (retrieved October 18, 2019 and January 9, 2020). [Google Scholar]
- We have used the measured saturation pressure at the highest temperature (T > T3bulk) to calibrate our temperature sensor.
- Desorption measurements for partial pore filling in Vycor glass usually show no plateau (see, e.g., Figure 15 in ref (65) for measurements with xenon). Also, the maximum amount of adsorbate reached during our measurements below T3bulk is consistent with the porosity. [For other porous materials with larger nanopores a complete filling of the sample with argon might not be possible as the steep part of the adsorption branch shifts to higher relative pressures with increasing pore size (see Kelvin equation).].
- Tegeler C.; Span R.; Wagner W. A New Equation of State for Argon Covering the Fluid Region for Temperatures From the Melting Line to 700 K at Pressures up to 1000 MPa. J. Phys. Chem. Ref. Data 1999, 28, 779–850. 10.1063/1.556037. [DOI] [Google Scholar]
- Gilgen R.; Kleinrahm R.; Wagner W. Measurement and correlation of the (pressure, density, temperature) relation of argon II. Saturated-liquid and saturated-vapour densities and vapour pressures along the entire coexistence curve. J. Chem. Thermodyn. 1994, 26, 399–413. 10.1006/jcht.1994.1049. [DOI] [Google Scholar]
- The linear approximation for the density that we used in previous studies (see, e.g., Supporting Information for ref (37)) deviates by less than ±0.2% from the values calculated with Tegeler’s equation for 70 K ≤ T ≤ 100 K.
- Note that the absolute value of the adsorbed argon’s density may deviate from that of bulk argon by a few percent (±2–3%) near the normal boiling point,21,36 but this would not noticeably influence the following analysis.
- Lemmon E. W.; Penoncello S. G.. The Surface Tension of Air and Air Component Mixtures. In Cryogenic Engineering, Vol. 39; Kittel P., Ed.; Plenum Press: New York, 1994; pp 1927−1934. 10.1007/978-1-4615-2522-6_236 [DOI] [Google Scholar]
- Takei T.; Mukasa K.; Kofuji M.; Fuji M.; Watanabe T.; Chikazawa M.; Kanazawa T. Changes in density and surface tension of water in silica pores. Colloid Polym. Sci. 2000, 278, 475–480. 10.1007/s003960050542. [DOI] [Google Scholar]
- Knight A. W.; Kalugin N. G.; Coker E.; Ilgen A. G. Water properties under nano-scale confinement. Sci. Rep. 2019, 9, 8246. 10.1038/s41598-019-44651-z. [DOI] [PMC free article] [PubMed] [Google Scholar]
- Tolman R. C. The Effect of Droplet Size on Surface Tension. J. Chem. Phys. 1949, 17, 333–337. 10.1063/1.1747247. [DOI] [Google Scholar]
- Ahn W. S.; Jhon M. S.; Pak H.; Chang S. Surface tension of curved surfaces. J. Colloid Interface Sci. 1972, 38, 605–608. 10.1016/0021-9797(72)90395-5. [DOI] [Google Scholar]
- Nonnenmacher T. F. Size effect on surface tension of small droplets. Chem. Phys. Lett. 1977, 47, 507–508. 10.1016/0009-2614(77)85027-6. [DOI] [Google Scholar]
- Navascués G. Liquid surfaces: theory of surface tension. Rep. Prog. Phys. 1979, 42, 1131–1186. 10.1088/0034-4885/42/7/002. [DOI] [Google Scholar]
- Vogelsberger W.; Marx G. Zur Krümmungsabhängigkeit der Oberflächenspannung kleiner Tröpfchen. Z. Phys. Chem. 1976, 257, 580. 10.1515/zpch-1976-25762. [DOI] [Google Scholar]
- Note that Lemmon et al. used for the critical temperature a value of Tc = 150.6633 K when they established the parameters in this equation.
- Pollara L. Z. Surface Tension and Vapor Pressure. J. Phys. Chem. 1942, 46, 1163–1167. 10.1021/j150423a017. [DOI] [Google Scholar]
- Djemour A.; Sanctuary R.; Baller J. Mobility restrictions and glass transition behaviour of an epoxy resin under confinement. Soft Matter 2015, 11, 2683–2690. 10.1039/c4sm02774d. [DOI] [PubMed] [Google Scholar]
- Grosman A.; Ortega C. Cavitation in Metastable Fluids Confined to Linear Mesopores. Langmuir 2011, 27, 2364–2374. 10.1021/la104777y. [DOI] [PubMed] [Google Scholar]
- Grosman A.; Ortega C.. Adsorption, Cavitation, and Elasticity in Mesoporous Materials. In Nonlinear Elasticity and Hysteresis: Fluid-Solid Coupling in Porous Media; Kim H. A.; Guyer R. A., Eds.; Wiley-VCH Verlag: Weinheim, Germany, 2015; pp 27−56. 10.1002/9783527665068.ch2 [DOI]
- Reichenbach C.; Kalies G.; Enke D.; Klank D. Cavitation and Pore Blocking in Nanoporous Glasses. Langmuir 2011, 27, 10699–10704. 10.1021/la201948c. [DOI] [PubMed] [Google Scholar]
- Morishige K.; Tateishi M.; Hirose F.; Aramaki K. Change in Desorption Mechanism from Pore Blocking to Cavitation with Temperature for Nitrogen in Ordered Silica with Cagelike Pores. Langmuir 2006, 22, 9220–9224. 10.1021/la061360o. [DOI] [PubMed] [Google Scholar]
- Shi B.; Dhir V. K. Molecular dynamics simulation of the contact angle of liquids on solid surfaces. J. Chem. Phys. 2009, 130, 034705. 10.1063/1.3055600. [DOI] [PubMed] [Google Scholar]
- Sullivan D. E. Surface tension and contact angle of a liquid–solid interface. J. Chem. Phys. 1981, 74, 2604–2615. 10.1063/1.441333. [DOI] [Google Scholar]
- Wallacher D.; Soprunyuk V. P.; Kityk A. V.; Huber P.; Knorr K. Capillary sublimation of Ar in mesoporous glass. Phys. Rev. B: Condens. Matter Mater. Phys. 2005, 71, 052101. 10.1103/physrevb.71.052101. [DOI] [Google Scholar]
- Rabinovich V. A.; Vasserman A. A.; Nedostup V. I.; Veksler L. S.. Thermophysical Properties of Neon, Argon, Krypton, and Xenon; Selover T. B., Jr. (English-Language Edition Editor), Ed.; National Standard Reference Data Service of the USSR: A Series of Property Tables, Vol. 10; Springer-Verlag: Berlin, 1988. [Google Scholar]
- Hardy W. H.; Crawford R. K.; Daniels W. B. Experimental Determination of the P-T Melting Curve of Argon. J. Chem. Phys. 1971, 54, 1005–1010. 10.1063/1.1674931. [DOI] [Google Scholar]
- Horikawa T.; Do D. D.; Nicholson D. Capillary condensation of adsorbates in porous materials. Adv. Colloid Interface Sci. 2011, 169, 40–58. 10.1016/j.cis.2011.08.003. [DOI] [PubMed] [Google Scholar]