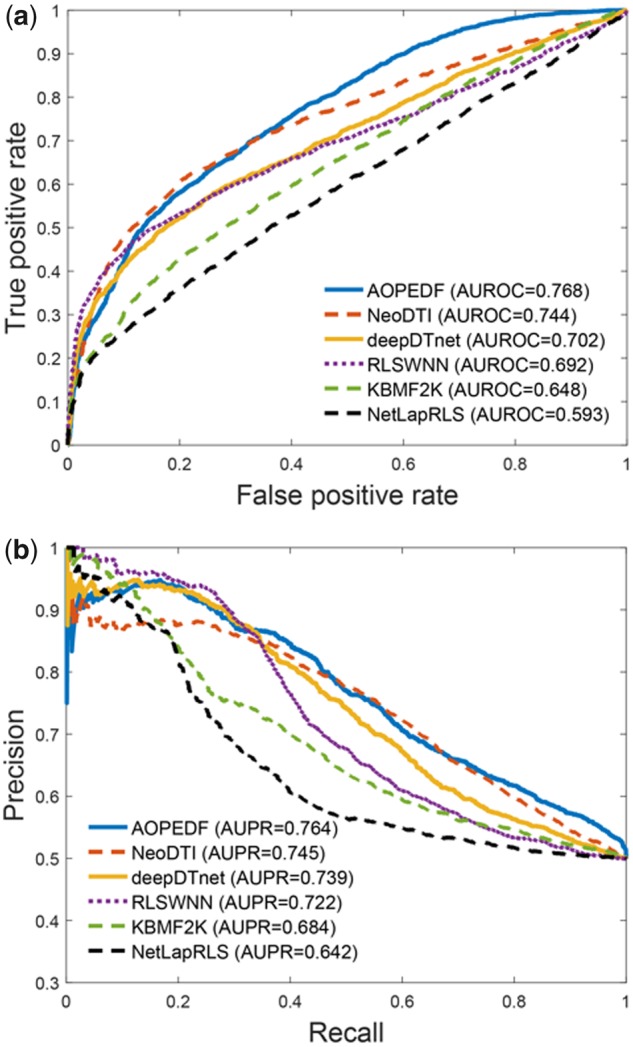
Fig. 3.

Evaluation of AOPEDF on the external validation set collected from the ChEMBL database (see Section 2). (a) ROC curves of prediction results obtained by applying AOPEDF and five previously published methods. (b) PR curves of prediction results obtained by applying AOPEDF and five previously published methods. AUROC, the area under ROC curve; AUPR, the area under PR curve
