

Abstract
Motivation
Genome-wide association studies (GWAS) are a powerful method to detect even weak associations between variants and phenotypes; however, many of the identified associated variants are in non-coding regions, and presumably influence gene expression regulation. Identifying potential drug targets, i.e. causal protein-coding genes, therefore, requires crossing the genetics results with functional data.
Results
We present a novel data integration pipeline that analyses GWAS results in the light of experimental epigenetic and cis-regulatory datasets, such as ChIP-Seq, Promoter-Capture Hi-C or eQTL, and presents them in a single report, which can be used for inferring likely causal genes. This pipeline was then fed into an interactive data resource.
Availability and implementation
The analysis code is available at www.github.com/Ensembl/postgap and the interactive data browser at postgwas.opentargets.io.
1 Introduction
Genome-wide association studies (GWAS) are a powerful method to analyse common diseases in a large cohort. Taking advantage of affordable large-scale genotyping chip technologies, such studies are now routinely run across cohorts large enough to detect even weak associations between common variants and a phenotype of interest. There are now enough GWAS studies to warrant the existence of specialized databases, such as the GWAS Catalog (MacArthur et al., 2017).
Despite this wealth of data, GWAS have not succeeded in translating into many therapeutic success stories (Huang, 2015). The main bottleneck is inferring truly causal genes from the GWAS results that can then be used as drug targets and thus new therapies. This gap between genetics research and translational applications is largely explained by the difficulty in functionally interpreting non-coding variants. Although annotating and prioritizing coding variants are a well-studied problem, determining the regulatory effect of non-coding variants is still difficult. In effect, many of the drug targets tested by the pharmaceutical industry fail to yield a new drug because they are revealed to be unrelated to the phenotype (Cook et al., 2014).
To close this gap, a number of experimental techniques have been developed, such as molecular Quantitative Trait Loci (QTL) (Brem et al., 2002), covariance analysis in chromatin state between distant regions of the genome (Thurman et al., 2012) or sequencing-based assays, such as Promoter-Capture Hi-C (Javierre et al., 2016). Existing pipelines (Shen et al., 2017) integrate all these datasets but they do not connect directly to databases to gather their latest results.
We present here a pipeline that compares GWAS results to a collection of useful cis-regulatory datasets. We have run our pipeline across all GWAS Catalog studies and present the results in an interactive web interface, which can be used to examine the evidence supporting the candidate causal genes.
2 Methods
The analysis automates a number of standard post-GWAS data integration steps as follows:
(Optional) Search through public GWAS databases: GWAS Catalog, GRASP (Leslie et al., 2014) or PheWAS Catalog (Denny et al., 2013), using ontology terms where possible [using the EMBL-EBI Zooma (https://www.ebi.ac.uk/spot/zooma) term suggestion service to map text where possible to ontology terms].
Linkage disequilibrium (LD) expansion. By default, the 1000 Genomes genotypes (The 1000 Genomes Project Consortium, 2015) are used; however, it is possible to replace them with other cohorts, simply by replacing VCF files. Any significant single nucleotide polymorphism (SNP) is connected to nearby common SNPs with a Pearson r2 correlation >0.7.
Clustering. Each significant SNP and its LD neighbours form a cluster. Overlapping clusters in the same study are merged.
Alignment to known regulatory annotations, indicative of whether an SNP has any regulatory effect, in particular, the Ensembl Regulatory Build (Zerbino et al., 2015) and RegulomeDB (Boyle et al., 2012).
Alignment to known cis-regulatory annotations, indicative of whether an SNP regulates a specific gene, in particular, GTEx (GTEx Consortium, 2017), Ensembl VEP (McLaren et al., 2016), Fantom5 (Andersson et al., 2014), ENCODE DNAseI hypersensitivity correlations (Thurman et al., 2012) and Promoter-Capture Hi-C calls (Javierre et al., 2016), each evidence being assigned a weight between 0 and 1.
Computing an aggregate score for each (SNP, Gene) pair by summation of all the scores obtained in steps (4) and (5).
2.1 A deployable pipeline
The pipeline is coded in Python and was designed to be easily installed locally and run privately, whether against public databases or on a private dataset (provided as summary statistics in a tab-delimited file).
2.2 An interactive website
The Open Target post-GWAS web browser allows users to browse through the pre-computed results of the pipeline run across all of GWAS Catalog. If searching from an SNP rsID or a gene symbol the browser displays either a genomic view or a table of associations (see Fig. 1). If searching for a disease, a table of known associations are displayed.
Fig. 1.
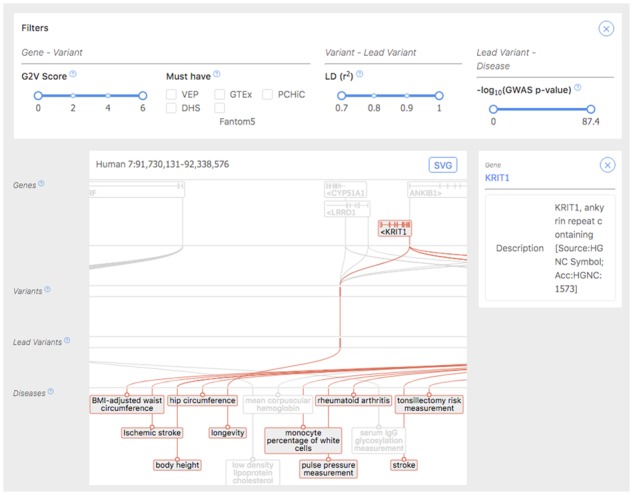
Screenshot of the post-GWAS browser. At the top, dynamic filters control what is displayed. Below, a genomic browser represents a genomic locus with genes, which are connected to nearby regulatory variants, which are in turn in LD with tag SNPs, associated with given phenotypes
3 Results
We ran our pipeline on all GWAS Catalog studies at the time (last update December 7, 2018). This comprised 2092 phenotypes and diseases, described in 3187 publications, and a total of 67 771 significant SNPs. After LD expansion, a total of 923 891 unique SNPs were analysed, each SNP being involved in 290 publications on average. The average run time for each study was 40 min.
4 Conclusions
GWAS is a powerful approach to understanding disease mechanism but requires functional analysis to produce actionable results. The Open Targets post-GWAS pipeline facilitates this process, both through an automated tool and pre-processed results, freeing GWAS analysts from the laborious process of data integration.
Funding
This work was supported by the Open Targets project and EMBL core funds to D.R.Z. and W.J.
Conflict of Interest: none declared.
References
- Andersson R. et al. ; The FANTOM Consortium. (2014) An atlas of active enhancers across human cell types and tissues. Nature, 507, 455–461. [DOI] [PMC free article] [PubMed] [Google Scholar]
- Boyle A.P. et al. (2012) Annotation of functional variation in personal genomes using RegulomeDB. Genome Res., 22, 1790–1797. [DOI] [PMC free article] [PubMed] [Google Scholar]
- Brem R.B. et al. (2002) Genetic dissection of transcriptional regulation in budding yeast. Science, 296, 752–755. [DOI] [PubMed] [Google Scholar]
- Cook D. et al. (2014) Lessons learned from the fate of AstraZeneca’s drug pipeline: a five-dimensional framework. Nat. Rev. Drug Discov., 13, 419–431. [DOI] [PubMed] [Google Scholar]
- Denny J.C. et al. (2013) Systematic comparison of phenome-wide association study of electronic medical record data and genome-wide association study data. Nat. Biotechnol., 31, 1102–1110. [DOI] [PMC free article] [PubMed] [Google Scholar]
- GTEx Consortium. (2017) Genetics effects on gene expression across human tissues. Nature, 550, 204. [DOI] [PMC free article] [PubMed] [Google Scholar]
- Huang Q.J. (2015) Genetic study of complex diseases in the post-GWAS era. Genet. Genomics, 42, 87–98. [DOI] [PubMed] [Google Scholar]
- Javierre B.M. et al. (2016) Lineage-specific genome architecture links enhancers and non-coding disease variants to target gene promoters. Cell, 167, 1369–1384.e19. [DOI] [PMC free article] [PubMed] [Google Scholar]
- Leslie R. et al. (2014) GRASP: analysis of genotype-phenotype results from 1,390 genome-wide association studies and corresponding open access database. Bioinformatics, 30, i185–i194. [DOI] [PMC free article] [PubMed] [Google Scholar]
- MacArthur J. et al. (2017) The new NHGRI-EBI Catalog of published genome-wide association studies (GWAS Catalog). Nucleic Acids Res., 45, D896–D901. [DOI] [PMC free article] [PubMed] [Google Scholar]
- McLaren. et al. (2016) The Ensembl variant effect predictor. Genome Biol., 17, 122. [DOI] [PMC free article] [PubMed] [Google Scholar]
- Shen J. et al. (2017) STOPGAP: a database for systematic target opportunity assessment by genetic association predictions. Bioinformatics, 33, 2784–2786. [DOI] [PubMed] [Google Scholar]
- The 1000 Genomes Project Consortium. (2015) A global reference for human genetic variation. Nature, 526, 68–74. [DOI] [PMC free article] [PubMed] [Google Scholar]
- Thurman R.E. et al. (2012) The accessible chromatin landscape of the human genome. Nature, 489, 75–82. [DOI] [PMC free article] [PubMed] [Google Scholar]
- Zerbino D.R. et al. (2015) The Ensembl regulatory build. Genome Biol., 16, 56. [DOI] [PMC free article] [PubMed] [Google Scholar]