

Abstract

Carbon monoxide (CO) is a signaling molecule in humans. Prior research suggests that therapeutic levels of CO can have beneficial effects in treating a variety of physiological and pathological conditions. To facilitate understanding of the role of CO in biology, molecules that enable fluorescence detection of CO in living systems have emerged as an important class of chemical tools. A key unmet challenge in this field is the development of fluorescent analyte replacement probes that replenish the CO that is consumed during detection. Herein, we report the first examples of CO sense and release molecules that involve combining a common CO-sensing motif with a light-triggered CO-releasing flavonol scaffold. A notable advantage of the flavonol-based CO sense and release motif is that it is trackable via fluorescence in both its pre- and postsensing (pre-CO release) forms. In vitro studies revealed that the PdCl2 and Ru(II)-containing CORM-2 used in the CO sensing step can result in metal coordination to the flavonol, which minimizes the subsequent CO release reactivity. However, CO detection followed by CO release is demonstrated in living cells, indicating that a cellular environment mitigates the flavonol/metal interactions.
Introduction
Carbon monoxide (CO) is a signaling molecule in humans that is generated endogenously via the enzyme-catalyzed breakdown of heme.1 There is significant current interest in understanding the biological effects of CO as well as in advancing its potential use in improving human health.2−10 Related to these goals, significant recent research has focused on the development of systems for monitoring the presence and concentration of CO in living systems. Many methods for the detection of CO have been reported, including gas chromatography, Fourier transform infrared (FTIR), chromogenic detection, electrochemical and myoglobin assays, and commercial CO detectors.11−18 However, many of these approaches are not suitable for real-time detection of CO in living systems. Recently, fluorescence detection-based probes have emerged as useful tools to monitor and detect CO in biological systems.19−46 Three primary types of fluorescent molecular CO sensors have been developed. Palladacycle compounds, such as COP-1 (Figure 1a), exhibit quenched fluorescence for the organic fluorophore due to the presence of Pd(II). Loss of the metal ion following palladium-mediated carbonylation with CO results in the formation of a detectable organic fluorophore.21−28 A second class of CO sensors function via the Pd(0)-mediated cleavage of an allyl propyl ether or carbonate appendage.29−46 This Tsuji–Trost reactivity follows the approach used for sensing palladium in cellular environments.47−49 The first example of this type of sensor, PCO-1, was reported by Pal, et al.29 and resulted in the formation of a coumarin fluorophore (Figure 1b). A third type of proposed CO sensor is based on the CO-mediated reduction of an aryl nitro moiety to a primary amine.50−53 An example of a sensor in this class is the naphthalimide-based sensor COFP (Figure 1c).50 Notably, these sensors have recently been shown to sense only CORM-2 or CORM-3, but not CO in general.53 Outside these three general classes of compounds, a few additional types of fluorescent CO sensors have been reported.20,54,55
Figure 1.
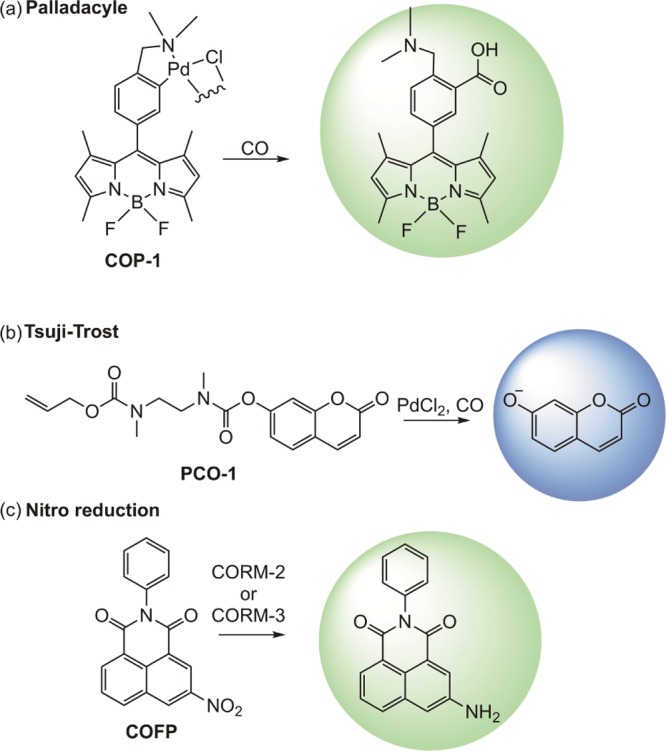
Types of fluorescent sensors (a–c) for detection of CO or CORMs in biological systems. The coloration of the circles indicates the wavelength of the fluorescent emission.
The fluorescent CO probes reported to date share a common drawback. Specifically, the consumption of an equivalent of CO is required during the process of CO sensing. CO-binding metal complexes offer the possibility of colorimetric, spectrochemical, or electrochemical CO sensing without consumption of the analyte, if the CO-binding reaction is reversible.56−67 However, CO-sensing metal complexes that combine CO-binding reversibility with various other useful properties, such as selectivity over other bioanalytes (e.g., reactive oxygen species and reactive nitrogen species), are yet to be developed. Additional challenges in using metal-based CO sensors include the possibility of redox activity of the metal center and/or interactions of the metal center with biological molecules, including proteins and biothiols.68,69
Analyte replacement metal-free molecular fluorescent probes have recently been reported in the context of H2S and formaldehyde (FA) sensing (Figure 2a,b).70,71 The goal of such probes is to enable fluorescent analyte sensing while not disrupting the cellular homeostasis of the analyte. As shown in Figure 2a, H2S sensing via reduction of an aryl azide, followed by self-immolative reactivity involving a linker, results in the release of carbonyl sulfide, which as a substrate for carbonic anhydrase enzymes can result in the regeneration of H2S. The FA sensor outlined in Figure 2b exhibits more synchronous activity, with the capture of the formaldehyde resulting in a structural change that results in subsequent release of a fluorophore and the analyte. Both types of analyte replacement fluorescent probes have been used in cell-based studies, with the FA probes offering the opportunity to detect FA both intracellularly and inside lysosomes.
Figure 2.
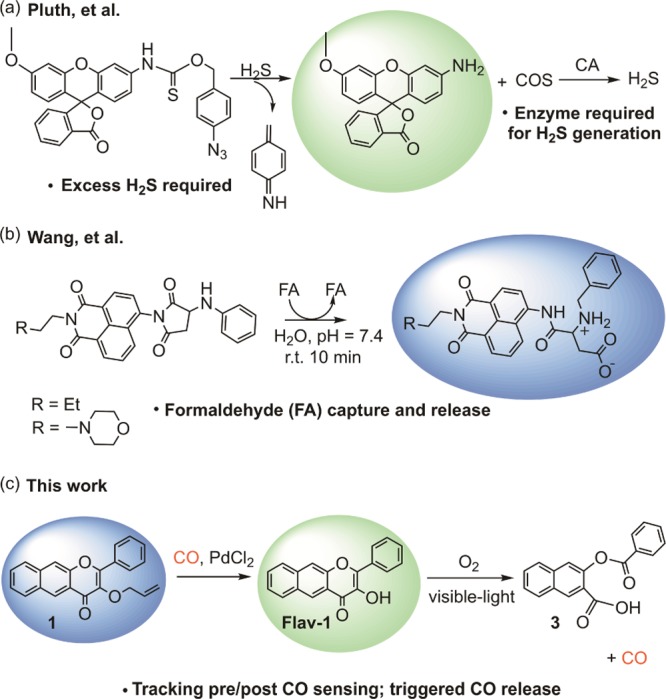
Analyte replacement probes for (a) H2S and (b) formaldehyde (c) CO sense and release molecule developed in this work. The coloration of the spheres indicates the wavelength of the fluorescent emission.
Development of molecular analyte replacement probes for CO requires the design of a detectable CO sensing response coupled with a CO-releasing motif. Herein, we report the progress toward the development of the first analyte replacement fluorescent probes for CO. These probes are comprised of a flavonol-based photoCORM with an allyl ether (1, Figure 2c) or allyl propyl formate (2) motif. CO detection is enabled via Tsuji–Trost-type reactivity in the presence of Pd(II). Our hypothesis was that the CO sensing reaction would result in the formation of the parent flavonol Flav-1(72) which is fluorescent and trackable in cells. Visible light-induced CO release from Flav-1 would then replenish the CO used in the sensing reaction, thus leaving the overall CO level unchanged. Results of in vitro experiments demonstrate that the Flav-1 generated in the Tsuji–Trost-type CO sensing reaction (using either CORM-2 or CO gas as the CO source) interacts with Pd(II) and/or CORM-2 fragments in the reaction mixture, minimizing the subsequent CO release reactivity. However, cell-based studies in human umbilical vein endothelial cells (HUVECs) demonstrate that the cellular environment mitigates the flavonol/metal interactions enabling the desired CO sense and release reactivity.
Results and Discussion
Synthesis and Characterization of 1 and 2
Compounds 1 and 2 were prepared from Flav-1 via one-step reactions with commercially available allyl bromide or allyl chloroformate under basic conditions (Scheme 1). Both were characterized by 1H and 13C{1H} NMR, FTIR, and mass spectrometry (Figures S1–S8). A single crystal of 1 suitable for X-ray crystallography was obtained from dimethyl sulfoxide (DMSO). Details of the X-ray data collection and solution are available in the Supporting Information (Tables S1 and S2). A representation of the structure is shown in Figure 3. The naphthyl-fused 3-hydroxy-4-pyrone ring structure is nearly planar with the phenyl appendage twisting slightly out of this plane. We note that 1 has bond lengths and angles very similar to those of Flav-1 (Table S2).72
Scheme 1. Synthesis of CO-Sensing Flavonol Derivatives.

Figure 3.
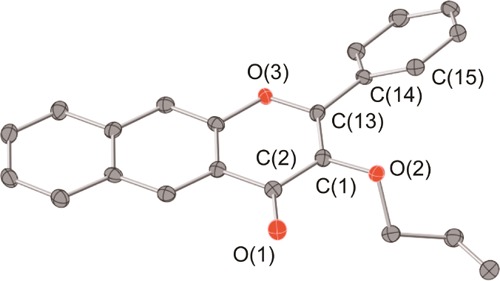
Representation of the X-ray structure of 1.
The spectroscopic properties of 1 and 2 were evaluated and compared with those of Flav-1 and the CO-release product 3. The absorption bands of 1 and 2 in DMSO are centered at 370 and 380 nm, respectively (Figure 4). Excitation into these bands produces emission features with maxima at ∼463 and 458 nm, respectively, for 1 and 2 (Figure 4). Flav-1 has an absorption maximum at 411 nm and emits with a maximum at 550–600 nm depending on solvent conditions.73 The product of CO release 3 does not have absorption or emission features in the visible region.72,73 Thus, the absorption and emission features of 1 and 2 are distinct (Figure 5), indicating that deprotection of 1 or 2 to form Flav-1 and the subsequent release of CO upon illumination to form 3 will be identifiable by both absorption and emission spectroscopy.
Figure 4.

Absorption (a) and emission (b) spectral data for 1–3 and Flav-1 in DMSO.
Figure 5.

Changes in the emission spectra of 1 ((a,b)) and 2 ((c,d)) in 40% DMSO in PBS or 8% DMSO in DMEM upon incubation at 37 °C for 90 min (λex = 370 nm).
Hydrolytic Stability of 1 and 2
The hydrolytic stability of 1 and 2 was evaluated in 40% DMSO in PBS and in 8% DMSO in Dulbecco’s modified Eagle’s medium (DMEM). The intensity of the emission bands of 1 in both solvent mixtures did not change when monitored at 37 °C for 90 min (Figure 5a,b). Thus, 1 is stable with respect to hydrolysis under conditions relevant to cell culture studies. Compound 2 is stable in a solution of 40% DMSO in PBS (10 mM, pH 7.4) over 90 min of incubation at 37 °C (Figure 5c). In contrast, in 8% DMSO in DMEM 2 undergoes hydrolysis with the formation of Flav-1. As shown in Figure 5d, this transformation is evidenced by a decrease in emission intensity at 465 nm along with an increase in emission at ∼600 nm (λex = 411 nm), which corresponds to the formation of Flav-1. Additionally, the formation of Flav-1 was identified by the appearance of its characteristic absorption bands at 396 and 413 nm, respectively, upon incubation of 2 in 8% DMSO in DMEM at 37 °C after 90 min. Because of the hydrolytic instability of 2, further studies of the stability and CO sensing/releasing properties were limited to investigations of 1.
Photostability of 1
The photostability of 1 in DMSO was evaluated using UV–vis upon illumination with 465 nm light (5972 lx; Figure S9a) for 1 h. The probe was found to be stable with respect to light for the tested timeline. The 465 nm light was chosen based on the use of a 460 nm LED array in cellular studies to induce CO release from Flav-1.74 The light stability of 1 was also investigated by 1H NMR in DMSO-d6 over the course of 24 h (Figure S9b) with no change being evident.
Fluorescence Detection of CO Using 1 in 8% DMSO in DMEM or DMSO
The CO sensing properties of 1 were evaluated in 8% DMSO in DMEM (pH = 7.4) or DMSO upon treatment with PdCl2 (2 equiv) and CORM-2 (10 equiv) following 90 min of incubation at 37 °C under dark conditions. The spectral changes expected with CO sensing via the Tsuji–Trost-type reaction were the loss of the emission feature of 1 at ∼465 nm and the growth of an emission at ∼600 nm associated with the formation of Flav-1. An increase in absorbance in the region of 400–450 nm would also be expected for Flav-1 formation. As shown in Figure 6a, an emission at ∼560 nm (λex = 411 nm) that is produced following treatment of 1 with PdCl2/CORM-2 in 8% (v/v) DMSO in DMEM is quenched relative to that expected for complete conversion to Flav-1 (shown vs a 50 μM Flav-1 control sample). The absorption spectral features of the same solution (Figure 6c) show the presence of a band at ∼500 nm which is red-shifted relative to the absorption features of Flav-1 under the same conditions. The absorption spectrum produced upon treatment of 1 with CORM-2/PdCl2 also shows a high baseline absorbance, consistent with possible particulate formation. Based on literature precedent discussed below, these emission and absorption features suggest the formation of Pd(II) and/or Ru(II) complexes of Flav-1 in the deprotection CO sensing reaction mixture. We note that we have previously reported that Flav-1 can exist in its anionic form (deprotonated at the 3-hydroxy position) in buffer/media solutions at pH = 7.4, which likely enhances its metal coordination properties.73
Figure 6.

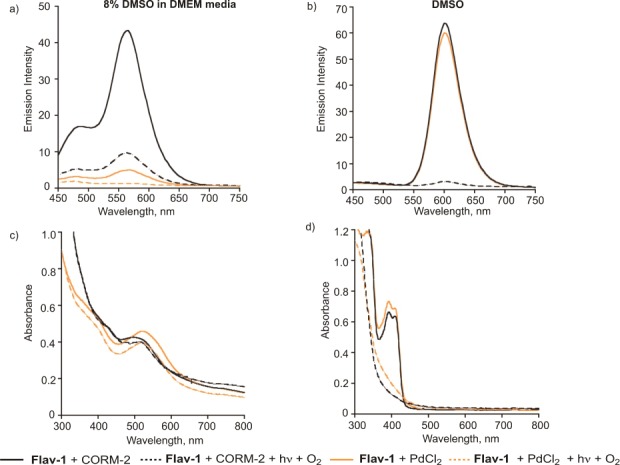
Emission (top) and absorption (bottom) spectra produced upon treatment of Flav-1 (50 μM) with PdCl2 (100 μM) or CORM-2 (500 μM) in (a,c) 8% DMSO in DMEM and (b,d) DMSO after 90 min at 37 °C (λex = 411 nm). In each spectrum, the features produced in the CO-sensing Tsuji–Trost deprotection reaction of 1 are shown. A comparative control spectrum of Flav-1 is shown at the concentration (50 μM) anticipated for full conversion of 1 to Flav-1 in the CO sensing reaction.
To further evaluate the potential formation of Pd(II) or Ru(II) coordination complexes of Flav-1 in the Tsuji–Trost-type CO-sensing reaction of 1, additional control experiments were performed. Shown in Figure 6a,c are the emission and absorption spectral features of Flav-1 in 8% DMSO in DMEM in the presence of added PdCl2 or CORM-2. Notably, the emission of Flav-1 (Figure 6a) is nearly fully quenched in the presence of PdCl2. The absorption spectrum of this solution contains a new absorption band at ∼500 nm. We propose that these features suggest the formation of a [Pd(Flav-1)L2]+-type species in solution. It is important to note that a recently reported series of Pd(II) complexes of 3-hydroxyflavone, [Pd(bpy)(3-HFl-X)]BF4, are nonemissive species at room temperature.75,76 Emission spectra of solutions of Flav-1 in the presence of CORM-2 show some fluorescence emission quenching but less than that produced in the presence of PdCl2 (Figure 6a). In this regard, we note that Ru(II) flavonolato species are emissive when excited in the flavonol-related absorption bands.77−81 The absorption spectrum of Flav-1 in the presence of CORM-2 contains a new band >500 nm. The appearance of this band suggests the formation of a Ru(II) flavonolato complex.
Comparison of the control spectra involving Flav-1 and PdCl2 or CORM-2 to the Tsuji–Trost deprotection reaction mixture of 1 shows that the latter exhibits an intermediate emission quenching relative to those found independently for Flav-1 solutions containing the two heavy metals. An increased absorbance baseline is also present in the CO-sensing deprotection reaction mixture relative to the independent controls. These features suggest that there is likely a mixture of metal flavonolato species, some of which are not soluble in 8% DMSO in DMEM, in the CO-sensing reaction mixture.
Fluorescence Detection of CO Using 1 in DMSO
As shown in Figure 6b, when the Tsuji–Trost-type CO sensing reaction of 1 is performed in DMSO the observed emission for Flav-1 is again quenched relative to a standard sample. The absorption features of this solution (Figure 6d) contain characteristics of Flav-1 but also enhanced absorbance at ∼500 nm. Comparison of the spectral properties of the CO deprotection reaction mixture of 1 in DMSO to independent solutions of Flav-1 in the presence of PdCl2 or CORM-2 (Figures 6b and 7d) showed that in DMSO neither heavy metal causes emission quenching or notable changes of the absorption spectrum. This observation suggests that the conditions of the CO-sensing deprotection reaction of 1 are necessary to produce the unique spectral features of this mixture. This likely relates to the formation of the Flav-1 anion as a product in the Tsuji–Trost reaction (Scheme 1), which facilitates metal binding. Notably, a positive ion ESI-MS analysis of a CO-sensing deprotection reaction mixture of 1 performed following removal of the DMSO and dissolving of the residue in CH3CN revealed a cluster associated with the Pd(II) species [Pd(Flav-1)(CH3CN)2]+ (m/z 475.03; calculated 475.02) (Figure S10). We note that CO sensing experiments performed using CO gas in the presence of PdCl2 in DMSO also produced emission quenching and an absorbance spectrum suggestive of Pd(II) binding to Flav-1 (Figure S11).
Figure 7.

(a) Fluorescent spectral changes produced upon reaction of 1 (50 μM) with PdCl2 (100 μM) in DMSO upon addition of different concentrations of CORM-2 (5–200 μM). (b) Linear increase in fluorescence intensity produced upon reaction of 1 with PdCl2 upon the addition of CORM-2 (5–25 μM). All spectra were measured 15 min after mixing in DMSO at 37 °C (λex = 411 nm).
Sensitivity Studies
Recognizing that the emission intensity of Flav-1 is affected by interactions with Ru(II) and Pd(II), we still estimated a detection limit for 1 in DMSO. With increasing concentrations of CORM-2 in the presence of excess Pd(II), the emission peak for 1 at 465 nm gradually decreases and the emission peak at 603 nm for Flav-1 increases in a dose-dependent response to the amount of CO (Figure 7a). The fluorescence intensity change of Flav-1 at ∼600 nm was found to be linearly proportional to the CORM-2 concentrations in the range of 5–25 μM. The 3σ method was used to estimate a detection limit (3.19 μM).
Selectivity Measurement
The selectivity of the 1 for CO was tested versus anions (Cl–, Br–, I–, AcO–, HS–), amino acids, and biothiols (Glu, Cys, Ser, GSH, and Gly), and H2O2 was examined in DMSO (Figure 8). Blank solutions of the probe without analytes, and solutions containing an excess of CORM-2, were used for comparison. Changes in the fluorescence intensity were recorded after 15 min of incubation of the solutions at 37 °C. As shown in Figure 8, only the addition of CORM-2 induced a significant fluorescence enhancement.
Figure 8.
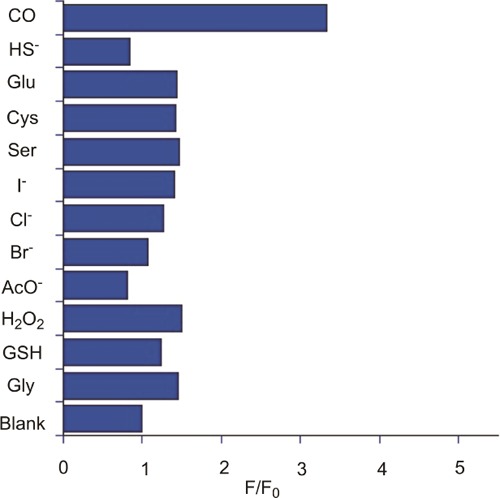
Fluorescent intensity increase at 603 nm (indicating Flav-1 formation) of a solution of 1 (50 μM) with PdCl2 (100 μM) in DMSO upon addition of various analytes (100 μM). All spectra were measured 15 min after mixing in DMSO at 37 °C (λex = 411 nm).
CO Release Reactivity
The coordination of Flav-1 to either Pd(II) or Ru(II) will reduce the visible-light induced CO release reactivity of the flavonol. Specifically, Han, et al. have previously reported that Pd(II) flavonolato complexes [Pd(bpy)(3-HFl-X)]BF4 are unreactive with visible light at ambient temperature.75 Saraf, et al. reported that Ru(II) flavonolato complexes will undergo visible-light-induced CO release but produce significantly less than one equivalent of CO due to trapping of the CO by the Ru(II) center.79 Therefore studies were performed to examine the CO release reactivity of the CO-sensing deprotection mixture versus control solutions. As shown in Figure 9a, as expected based on our prior work,73 illumination of a solution of free Flav-1 in 8% DMSO in DMEM under air results in bleaching of the emission features in the region of 450–750 nm. The absorbance features of Flav-1 (Figure 9c) in the region of 300–800 nm also disappear in this reaction, which corresponds to quantitative CO release and the formation of 3 (Figure 2c).72,73 The CO sensing reaction mixture produced upon treatment of 1 with CORM-2 and PdCl2 also undergoes emission bleaching when exposed to visible light and O2 (Figure 9a). This suggests that the remaining emission signal is likely due to the presence of some free Flav-1 in the mixture. However, the absorption features of the CO-sensing deprotection reaction of 1 change only minimally following 30 min of illumination (Figure 9c), consistent with the majority of the species present in solution being metal complexes of Flav-1 that are unreactive with light.
Figure 9.

Emission (top) and absorption (bottom) spectra of Flav-1 (50 μM) and the Tsuji–Trost CO-sensing reaction of 1 in (a,c) 8% DMSO in DMEM and (b,d) DMSO (λex = 411 nm). Spectra are shown in comparison with those resulting from illumination of the samples with visible light in the presence of O2.
In DMSO, similar results were found. Free Flav-1 undergoes reaction in the presence of O2 and visible light resulting in bleaching of the emission and loss of the absorption features of the flavonol above 350 nm. These changes are consistent with the quantitative formation of 3 and CO. The CO-sensing reaction mixture of 1 undergoes minor bleaching of the emission signal with a modest decrease in the absorption features around 500 nm (Figure 9b,d). We propose that these spectral changes are associated with the presence of some free Flav-1 in solution along with a majority of metal-complexed Flav-1.
To gain insight into the influence of the individual metal ions on the visible light-induced CO release reaction from Flav-1, additional control reactions were performed. As shown in Figure 10a, in the presence of CORM-2 in 8% DMSO in DMEM, a flavonol emission feature is present at ∼560 nm that undergoes significant bleaching upon exposure to O2 and visible light. The absorption spectra of this solution prior to and post visible light exposure under aerobic conditions are generally similar with a band at ∼500 nm. These combined results suggest that the mixture likely contains both free Flav-1 and Ru(II)-coordinated Flav-1. Under the same solution conditions, Flav-1 in the presence of PdCl2 shows significant emission quenching as well as absorption features consistent with metal binding. There is only minimal change upon illumination with visible light in the presence of O2. This indicates that the majority of the Flav-1 is coordinated to Pd(II). In DMSO, the spectral properties are consistent minimal interaction of Flav-1 with the metal ions. Exposure of DMSO solutions of Flav-1 in the presence of PdCl2 or CORM-2 resulted in bleaching as is typically observed for the free flavonol. These results in DMSO show that only under conditions wherein the flavonol anion forms (e.g., the Tsuji–Trost CO-sensing deprotection reaction of 1) are metal complexes of Flav-1 formed.
Figure 10.
Emission (top) and absorption (bottom) spectra of solutions of Flav-1 in the presence of (a,c) CORM-2 or (b,d) PdCl2. Spectral changes associated with illumination of the solutions in the presence of O2 are shown.
Summary of CO-Sensing Reaction, Metal Coordination, and CO Release
Outlined in Scheme 2 is a summary of the in vitro solution chemistry involved in the CO sense and release reactivity of 1. Key take away points are the following: (1) the Tsuji–Trost CO-sensing deprotection reaction of 1 leads to the formation of the anionic form of Flav-1 which in 8% DMSO in DMEM or DMSO results in metal coordination as is evidenced by quenching of the emission signal of the flavonol and absorption spectral changes; (2) exposure of Flav-1 independently to CORM-2 or PdCl2 in 8% DMSO in DMEM shows that coordination of the flavonolato anion to Pd(II) and Ru(II) occurs under these conditions. In DMSO, metal coordination only occurs in the deprotection reaction of 1. This is due to the need for the anion of Flav-1 to form to enable metal complex formation; (3) visible light induced CO release occurs from free Flav-1 (<0.25 equiv based on emission depletion), but only minimally from the metal complexes formed in the reaction mixture. Overall, because metal complexation is predominant in the in vitro CO sensing deprotection reaction mixtures, replenishment of CO is not quantitative in simple solution reaction conditions.
Scheme 2. Tsuji–Trost-Type CO Sensing Reaction of 1.

Formation of the Flav-1 anion results in coordination to CORM-2 fragments and Pd(II). Coordination of the flavonolato anion to these heavy metal ions results in quenching of the flavonol emission and loss of visible light-induced CO release reactivity.
Cellular Uptake and CO Sensing
Hypothesizing that the reaction environment in cells may influence the metal coordination properties of Flav-1, we pursued cell-based studies. We began by examining the cytotoxicity of 1 toward HUVECs using an MTT assay. Compound 1 was found to be nontoxic up to 100 μM (Figure S11). Flav-1 has been previously reported to be nontoxic to HUVECs up to 50 μM.74
The cellular uptake of 1 (50 μM) was confirmed using fluorescence microscopy. Intracellular uptake of 1 was indicated after 24 h of incubation via detection of its blue fluorescent emission (Figure 11). We next investigated the potential application of this probe for fluorescent imaging of CO in cells. HUVECs were incubated with 1 (50 μM) for 15 min, followed by the addition of PdCl2 (2 equiv) and CORM-2 (10 equiv) and incubation for 4 h at 37 °C. Note that PdCl2 and CORM-2 are nontoxic at the concentrations employed as determined by an MTT assay (Figure S12). Appearance of a green emission (Figure 12) indicates that free Flav-1 is present and that 1 can be used to detect CO in cell-based experiments. Illumination of the cells (λill = 488 nm; 42,620 lx) for 60 s leads to the disappearance of the green emission signal consistent with CO release (Figure 12). Note that at this point we cannot quantify the amount of CO generated back into the system as an excess is already present from CORM-2.
Figure 11.

Fluorescence microscopy images of HUVECs incubated for 24 h in DMEM/F-12K with 1. Row 1: media control cells. Row 2: cells exposed to 1. Blue channel: λex = 310–390 nm, λem = 420–470 nm. Size of bar = 20 μm.
Figure 12.

Fluorescent imaging of CO sensing in HUVECs using 1 (50 μM) with 100 μM PdCl2 and 500 μM CORM-2. Row 1: 1 incubated for 4 h followed by the addition of PdCl2 and CORM-2 and additional incubation for 4 h. Row 2: following illumination with 310–390 nm light. Green channel: λex = 310–390 nm, λem = 500–550 nm. Scale bar = 40 μm.
We hypothesize that the ability to produce free Flav-1 in cells via the Tsuji–Trost deprotection of 1 is due to the presence of competing ligands for the metal ions, especially soft ligands such as those containing sulfur donors.82 The binding of Flav-1 to proteins including serum albumin may also limit its interactions with metal ions in the cellular environment.73
Conclusions
CO is a signaling molecule of significant current interest for potential therapeutic uses. There is a substantial need to further understand its biological effects at low concentrations in order to leverage this information into the development of potential new applications. An integral part of studying the biology of CO is being able to detect its presence in biological environments. The goal of analyte replacement probes is to enable the sensing of small molecules such as CO without perturbing the cellular homeostasis of the analyte. Herein we report the first example of a fluorescent molecular CO sense and release system. Compound 1 is trackable in cells via fluorescence prior to both its CO sense and CO release reactions. Under in vitro conditions in 8% DMSO in DMEM or DMSO, the Tsuji–Trost-type CO sensing reactivity results in significant metal coordination of the Flav-1 product, which minimizes subsequent CO release reactivity. However, in a cellular environment under conditions wherein there are competing species for binding either the metal ions or Flav-1, both CO sensing and visible light-induced CO release reactivity are viable. Thus, 1 represents the first trackable analyte replacement photoCORM available for use in living cells. Our future work is directed at examining the biological applications of 1 and analogues.
Experimental Section
General Methods
All chemicals and reagents were obtained from commercial sources and used as received unless otherwise noted. Flav-1 was synthesized according to the literature procedure.72
Physical Methods
1H and 13C{1H} NMR spectra were collected using a Brüker Avance III HD Ascend-500 spectrometer and referenced to residual solvent peak in CDCl3 (1H: 7.26 (singlet) ppm) or DMSO-d6 (1H: 2.50 (multiplet) ppm). J values are given in hertz. Infrared spectra were recorded as potassium bromide pellets using a Shimadzu FTIR-8400. UV–vis spectra were recorded at ambient temperature and 37 °C using a CARY 50Bio or a Hewlett-Packard 8453A diode array spectrometer. Fluorescence emission spectra were collected using a Shimadzu RF-530XPC spectrometer in the range of 295–800 nm, with the excitation wavelength corresponding to the absorption maxima of the analyte in the solvent of choice. The spectra were collected using 1.0 cm quartz cuvettes with excitation and emission slit widths set at 1.5 or 3.0 nm. Mass spectral data for compound characterization were collected at the Mass Spectrometry Facility, University of California, Riverside. ESI-MS spectra of reaction mixtures containing 1, CORM-2, and PdCl2 were collected using a Shimadzu LCMS-2020. A Rayonet photoreactor equipped with RPR-4190A lamps (2450 lx, light intensity) was used for all noncellular light-induced reactions. An Apogee Instruments MQ-500 full spectrum quantum meter was used to determine the photon flux of illumination set ups. Cell imaging was performed using a Zeiss Axio Observer inverted microscope (Carl Zeiss Microscopy, Thornwood, NY) equipped with fluorescence detection.
Synthesis of 1
Flav-1 (100 mg, 0.347 mmol) was combined with K2CO3 (169 mg, 1.04 mmol) in DMF (1 mL) and stirred for 15 min at room temperature under nitrogen. Allyl bromide (410 mg, 3.47 mmol) was then added, and the reaction mixture was stirred overnight at room temperature. The reaction mixture was subsequently heated at 60 °C and stirred for an additional 3 h. After cooling to room temperature, the mixture was diluted with 10 mL of water. The organic phase was extracted with ethyl acetate (3 × 10 mL), washed with saturated NaHCO3 (3 × 10 mL), and dried over Na2SO4. The filtrate was concentrated under reduced pressure to give a pale-yellow solid (80 mg, 70%). 1H NMR (500 MHz, CDCl3); 8.86 (s, 1H), 8.20 (m, 2H), 8.07 (d, J = 8.1 Hz, 1H), 8.00 (s, 1H), 7.93 (d, J = 8.1 Hz, 1H), 7.61 (t, J = 7.3 Hz, 1H), 7.53 (m, 4H), 5.96 (m, 1H), 5.29 (d, J = 16.9 Hz, 1H), 5.16 (d, J = 10.7 Hz, 1H), 4.62 (d, J = 6.0 Hz, 2H); 13C{1H} NMR (500 MHz, CDCl3) 176.2, 157.1, 151.8, 138.8, 136.0, 133.7, 131.4, 131.0, 130.2, 129.7, 129.1, 128.9, 128.6, 127.3, 127.1, 126.1, 123.2, 118.8, 114.3, 73.7 (22 signals expected, 20 observed due to the overlap of signals in the aromatic region). UV–Vis (DMSO, nm) (ε, M–1 cm–1) 380 (5600). ESI/APCI-MS: (relative intensity) calcd. for C22H16O3 [MH]+, 329.1178; found, 329.1173 (100%). FTIR (KBr, cm–1) 1399 (νC–O), 1627 (νC=O).
Synthesis of 2
Flav-1 (100 mg, 0.347 mmol) and triethylamine (0.104 mL) were combined in 5 mL of dry dichloromethane and stirred for 2 h at room temperature under nitrogen. Allyl chloroformate (0.111 mL, 1.04 mmol) was then slowly added. The resulting mixture was stirred overnight at ambient temperature. Water (5 mL) was then added, and the solution was extracted with dichloromethane (3 × 5 mL). The combined organic fractions were dried over Na2SO4, filtered, and concentrated under vacuum to obtain a pale-yellow solid (115 mg, 89%). 1H NMR (500 MHz, CDCl3) δ ppm 8.88 (s, 1H), 8.08 (d, J = 8.9 Hz, 1H), 8.04 (s, 1H), 8.00 (d, J = 5.2 Hz, 2H), 7.94 (d, J = 8.2 Hz, 1H), 7.64 (t, J = 7.55 Hz, 1H), 7.57 (m, 4H), 5.98 (m, 1H), 5.42 (d, J = 17.5 Hz, 1H), 5.31 (d, J = 17.5 Hz, 1H), 4.76 (d, J = 5.5 Hz, 2H); 13C{1H} NMR (125 MHz, DMSO-d6): δ ppm 172.1, 156.7, 151.8, 151.1, 135.7, 132.0, 131.9, 131.5, 129.9, 129.5, 129.4, 129.3, 129.1, 128.3, 127.4, 126.6, 126.5, 121.8, 118.6, 115.0, 69.3 (23 signals expected, 21 observed due to the overlap of signals in the aromatic region). UV–Vis (DMSO, nm) (ε, M–1 cm–1) 330 (6700), 367 (3690). ESI/APCI-MS: (relative intensity) calcd. for C22H14O5 [MH]+, 373.1032; found, 373.1106 (100%). FTIR (KBr, cm–1) 1624 (νC=O), 1769 (νC=O).
Stability Studies of 1 and 2
Solutions of 1 and 2 (50 μM) were prepared in 8% or 40% DMSO in PBS (10 mM, pH = 7.4), or 8% DMSO in media, and were incubated at 37 °C for up to 90 min. Fluorescence spectra were measured every 15 or 30 min to evaluate sensor hydrolytic stability. The photostability of 1 was evaluated using absorption spectroscopy. In brief, a 100 μM solution of 1 in DMSO was subjected to illumination (λill = 465 nm; 5972 lx light intensity) for 1 h. The light stability of 1 was also investigated by 1H NMR in DMSO-d6 over the course of 24 h (Figure S9b).
CO-Sensing Reactivity of 1
To study the CO sensing reactivity of 1, fluorescence emission studies were performed using CORM-2 as the CO source. A solution of 1 (50 μM) in 8% DMSO in DMEM [no fetal bovine serum (FBS)] or neat DMSO was combined with PdCl2 (100 μM in DMSO) and exposed to CO from CORM-2 (500 μM in DMSO). Solutions were incubated at 37 °C for 90 min after which time emission spectra were measured.
Sensitivity Studies
The detection limit of 1 was determined based on the measurement of the fluorescence intensity of 2 upon titration of 50 μM of 1 with various concentrations of CORM-2 (5–200 μM) in the presence of 100 μM PdCl2 in DMSO incubated at 37 °C for 15 min. Each data point was measured in triplicate. The linear response was determined from 5 to 25 μM of added CORM-2. Average emission values were plotted against CORM-2 to determine the slope. The detection limit was then calculated with the following equation: DL = 3 σbl/m, where σbl is the standard deviation of the blank measurements (the blank was measured 10 times) and m is the slope of the linear response.
Selectivity Studies
Selectivity of 1 for CO detection was determined by measuring the changes in fluorescence intensity of 50 μM solutions of 1 in the presence of 100 μM PdCl2 upon addition of various analytes (100 μM) at 37 °C for 15 min. Stock solutions of the analytes NaOAc, NaBr, NaCl, NaI, Na2S, Cys, GSH, Ser, Glu, and Gly were prepared in doubly distilled water. H2O2 (30%) was used as purchased. Blank solutions of the probes without analytes and solutions with excess of CORM-2 were used for comparison. Changes in the fluorescence intensity were recorded after 15 min of incubation of the solutions at 37 °C.
Cell Culture Growth Conditions
HUVECs were obtained from ATCC (Manassas, VA) and cultured in F-12K Medium (Gibco) supplemented with 0.03 mg/mL endothelial cell growth (Sigma-Aldrich), 10% (v/v) FBS (Caisson Laboratories), 0.1 mg/mL heparin (Sigma-Aldrich) and 100 U/mL
Streptomycin–penicillin solution (Gibco). The cells were fed every 3 days with fresh media and subcultured in T-75 flasks at 4000 cells/cm2. Cells were detached by addition of 3 mL of Trypsin–EDTA 1× solution (Caisson Laboratories) for 5 min and then neutralized with 8 mL of fresh media. HUVECs were counted using a Cell Countess instrument (ThermoFisher) according to the manufacturer’s protocol. Only passages 1–6 were used in experiments.
Cytotoxicity
Three independent biological experiments, each with three technical replicates, were performed for 1, CORM-2, and PdCl2 using HUVECs. MTT (3-(4,5-dimethylthiazol-2-yl)-2,5-diphenyltetrazolium bromide) (Sigma-Aldrich) was prepared fresh at 5 mg/mL in sterile PBS solution and filtered through a 0.22 μM PES filter. The cells were seeded in 96-well tissue treated plates (Corning, NY) at 10,000 cells/well in a volume of 190 μL/well and allowed to attach for 24 h. The cells were then treated in triplicate wells with concentrations of 1 ranging from 0.08 to 100 μM to a final DMSO concentration that did not exceed 0.4% (v/v) and incubated for 24 h. The MTT solution (20 μL) was then added to each well and incubated for an additional 4 h. The metabolized formazan pellets were solubilized by adding 200 μL of DMSO, and the absorption was measured by a Modulus Microplate reader (Turner Biosystems) at 560 and 750 nm (background). The final results were obtained upon background signal subtraction followed by division of the obtained values by the absorption of the vehicle control (0.4% DMSO in media) wells. All data were analyzed using GraphPad Prism 7 (La Jolla, California), with values reported as means ± standard error mean. IC50 values were calculated as nonlinear regression with a bottom constraint of zero.
Cellular Uptake and Fluorescence Imaging of 1 in HUVECs
HUVECs were maintained in culture as described above, then seeded into Millicell E-Z-Slide culture chambers (EMD Millipore, Billerica, MA) at an initial density of 10.0 × 10⁴ cells/cm3 and allowed to adhere to the chamber slides for 24 h. The cells were then treated with 1 for 4 h. The compound was prepared as a 25 mM DMSO stock solution and then diluted to a final concentration of 50 μM in the culture, reaching 0.2% (v/v) of final DMSO concentration per slide chamber. The culture chambers were gently washed three times with plain culture to remove residual compound. All of the steps described above were performed in the dark with minimal red-light exposure. Images were acquired at 20× air magnification for 1 (blue channel), λex = 310–390 nm, and a detection wavelength range λem = 420–470 nm. Acquired images were processed by universal adjustment to enhance contrast levels (same settings were applied for all acquired images in each detection channel) using ZEISS ZEN 2.3 Lite software.
CO Detection in Cells
This experiment was performed as described above with the following additions. After 4 h of incubation with 1 and PdCl2 (2 equiv dissolved in DMSO), CORM-2 (10 equiv dissolved in DMSO immediately prior to the experiment) was added. The slides were then incubated for an additional 4 h. The culture chamber was then gently washed three times with plain culture to remove residual compounds. Images were acquired at 20× air magnification. For 1 (blue channel), the following excitation and emission parameters were used: λex = 310–390 nm and a detection wavelength range λem = 420–470 nm. Note that we could not use the GFP excitation and emission parameters that have been typically used for Flav-1(72) and instead used the following parameters: λex = 310–390 nm and λem = 500–550 nm to capture the neutral flavonol emission. Acquired images were processed by universal adjustment to enhance contrast levels (same settings were applied for all acquired images in each detection channel) using ZEISS ZEN 2.3 Lite software.
Acknowledgments
We thank the NIH (R15GM124596 to L.M.B. and A.D.B.; P20GM103546 to the X-ray core facility at the University of Montana), the NSF (CHE-1429195 for Brüker Avance III HD 500 MHz NMR to USU), the Utah Agricultural Experiment Station (project UTA-1178 to A.D.B.), the American Heart Association (grant 18PRE34030099 to T.S.), and the USU Office of Research and Graduate Studies (PDRF Fellowship to T.S.) for the financial support. We thank Josiah Elsberg for assistance with ESI-MS experiments.
Supporting Information Available
The Supporting Information is available free of charge at https://pubs.acs.org/doi/10.1021/acsomega.0c00409.
Author Contributions
The manuscript was written through contributions of all authors. All authors have given approval to the final version of the manuscript.
The authors declare no competing financial interest.
Supplementary Material
References
- Wu L.; Wang R. Carbon monoxide: Endogenous production, physiological functions, and pharmacological applications. Pharmacol. Rev. 2005, 57, 585–630. 10.1124/pr.57.4.3. [DOI] [PubMed] [Google Scholar]
- Ryter S. W.; Otterbein L. E. Carbon monoxide in biology and medicine. BioEssays 2004, 26, 270–280. 10.1002/bies.20005. [DOI] [PubMed] [Google Scholar]
- Motterlini R.; Otterbein L. E. The therapeutic potential of carbon monoxide. Nat. Rev. Drug Discovery 2010, 9, 728–743. 10.1038/nrd3228. [DOI] [PubMed] [Google Scholar]
- Romão C. C.; Blattler W. A.; Seixas J. D.; Bernandes G. J. L. Developing drug molecules for therapy with carbon monoxide. Chem. Soc. Rev. 2012, 41, 3571–3583. 10.1039/c2cs15317c. [DOI] [PubMed] [Google Scholar]
- Ji X.; Damera K.; Zhang Y.; Yu B.; Otterbien L. E.; Wang B. Toward carbon monoxide-based therapeutics: Critical drug delivery and developability issues. J. Pharm. Sci. 2016, 105, 402–416. 10.1016/j.xphs.2015.10.018. [DOI] [PMC free article] [PubMed] [Google Scholar]
- Ji X.; Wang B. Strategies toward organic carbon monoxide prodrugs. Acc. Chem. Res. 2018, 51, 1377–1385. 10.1021/acs.accounts.8b00019. [DOI] [PubMed] [Google Scholar]
- Ling K.; Men F.; Wang W.-C.; Zhou Y.-Q.; Zhang H.-W.; Ye D.-W. Carbon monoxide and its controlled release: Therapeutic application, detection, and development of carbon monoxide releasing molecules (CORMs). J. Med. Chem. 2018, 61, 2611–2635. 10.1021/acs.jmedchem.6b01153. [DOI] [PubMed] [Google Scholar]
- Ismailova A.; Kuter D.; Bohle D. S.; Butler I. S. An overview of the potential therapeutic applications of CO-releasing molecules. Bioinorg. Chem. Appl. 2018, 2018, 8547364. 10.1155/2018/8547364. [DOI] [PMC free article] [PubMed] [Google Scholar]
- Hasegawa U.; van der Vlies A. J.; Simeoni E.; Wandrey C.; Hubbell J. A. Carbon monoxide-releasing micelles for immunotherapy. J. Am. Chem. Soc. 2010, 132, 18273–18280. 10.1021/ja1075025. [DOI] [PubMed] [Google Scholar]
- Yang X.; de Caestecker M.; Otterbein L. E.; Wang B. Carbon monoxide: an emerging therapy for acute kidney injury. Med. Res. Rev. 2019, 10.1012/med.21650. [DOI] [PMC free article] [PubMed] [Google Scholar]
- Lee Y.; Kim J. Simultaneous electrochemical detection of nitric oxide and carbon monoxide generated from mouse kidney organ tissues. Anal. Chem. 2007, 79, 7669–7675. 10.1021/ac070814z. [DOI] [PubMed] [Google Scholar]
- McLean S.; Mann B. E.; Poole R. K. Sulfite species enhance carbon monoxide release from CO-releasing molecules: Implications for the deoxymyoglobin assay of activity. Anal. Biochem. 2012, 427, 36–40. 10.1016/j.ab.2012.04.026. [DOI] [PubMed] [Google Scholar]
- Morimoto Y.; Durante W.; Lancaster D. G.; Klattenhoff J.; Tittel F. K. Real-time measurements of endogenous CO production from vascular cells using an ultrasensitive laser sensor. Am. J. Physiol.: Heart Circ. Physiol. 2001, 280, H483–H488. 10.1152/ajpheart.2001.280.1.h483. [DOI] [PubMed] [Google Scholar]
- Marks G. S.; Vreman H. J.; McLaughlin B. E.; Brien J. F.; Nakatsu K. Measurement of endogenous carbon monoxide formation in biological systems. Antioxid. Redox Signaling 2002, 4, 271–277. 10.1089/152308602753666325. [DOI] [PubMed] [Google Scholar]
- Atkin A. J.; Lynam J. M.; Moulton B. E.; Sawle P.; Motterlini R.; Boyle N. M.; Pryce M. T.; Fairlamb I. J. S. Modification of the deoxy-myoglobin/carbonmonoxy-myoglobin UV-vis assay for reliable determination of CO-release rates from organometallic carbonyl complexes. Dalton Trans. 2011, 40, 5755–5761. 10.1039/c0dt01809k. [DOI] [PubMed] [Google Scholar]
- Esteban J.; Ros-Lis J. V.; Martínez-Máñez R.; Marcos M. D.; Moragues M.; Soto J.; Sancenón F. Sensitive and selective chromogenic sensing of carbon monoxide by using binuclear rhodium complexes. Angew. Chem., Int. Ed. Engl. 2010, 49, 4934–4937. 10.1002/anie.201001344. [DOI] [PubMed] [Google Scholar]
- Heylen S.; Martens J. A. Progress in the chromogenic detection of carbon monoxide. Angew. Chem., Int. Ed. Engl. 2010, 49, 7629–7630. 10.1002/anie.201002569. [DOI] [PubMed] [Google Scholar]
- Rimmer R. D.; Richter H.; Ford P. C. A Photochemical precursor for carbon monoxide release in aerated aqueous media. Inorg. Chem. 2010, 49, 1180–1185. 10.1021/ic902147n. [DOI] [PubMed] [Google Scholar]
- Marín-Hernández C.; Toscani A.; Sancenón F.; Wilton-Ely J. D. E. T.; Martínez-Máñez R. Chromo-fluorogenic probes for carbon monoxide detection. Chem. Commun. 2016, 52, 5902–5911. 10.1039/c6cc01335j. [DOI] [PubMed] [Google Scholar]
- Wang J.; Karpus J.; Zhao B. S.; Luo Z.; Chen P. R.; He C. A selective fluorescent probe for carbon monoxide imaging in living cells. Angew. Chem., Int. Ed. Engl. 2012, 51, 9652–9656. 10.1002/anie.201203684. [DOI] [PubMed] [Google Scholar]
- Michel B. W.; Lippert A. R.; Chang C. J. A Reaction-based fluorescent probe for selective imaging of carbon monoxide in living cells using a palladium-mediated carbonylation. J. Am. Chem. Soc. 2012, 134, 15668–15671. 10.1021/ja307017b. [DOI] [PubMed] [Google Scholar]
- Zheng K.; Lin W.; Tan L.; Chen H.; Cui H. A unique carbazole–coumarin fused two-photon platform: development of a robust two-photon fluorescent probe for imaging carbon monoxide in living tissues. Chem. Sci. 2014, 5, 3439–3448. 10.1039/c4sc00283k. [DOI] [Google Scholar]
- Li Y.; Wang X.; Yang J.; Xie X.; Li M.; Niu J.; Tong L.; Tang B. Fluorescent probe based on azobenzene-cyclopalladium for the selective imaging of endogenous carbon monoxide under hypoxia conditions. Anal. Chem. 2016, 88, 11154–11159. 10.1021/acs.analchem.6b03376. [DOI] [PubMed] [Google Scholar]
- Liu K.; Kong X.; Ma Y.; Lin W. Rational design of a robust fluorescent probe for the detection of endogenous carbon monoxide in living zebrafish embryos and mouse tissue. Angew. Chem., Int. Ed. 2017, 56, 13489–13492. 10.1002/anie.201707518. [DOI] [PubMed] [Google Scholar]
- Liu K.; Kong X.; Ma Y.; Lin W. Preparation of a nile red-Pd-based fluorescent CO probe and its imaging applications in vitro and in vivo. Nat. Protoc. 2018, 13, 1020–1033. 10.1038/nprot.2018.013. [DOI] [PubMed] [Google Scholar]
- Sun M.; Yu H.; Zhang K.; Wang S.; Hayat T.; Alsaedi A.; Huang D. Palladacycle based fluorescence turn-on probe for sensitive detection of carbon monoxide. ACS Sens. 2018, 3, 285–289. 10.1021/acssensors.7b00835. [DOI] [PubMed] [Google Scholar]
- Xu S.; Liu H.-W.; Yin X.; Yuan L.; Huan S.-Y.; Zhang X.-B. A cell membrane-anchored fluorescent probe for monitoring carbon monoxide release from living cells. Chem. Sci. 2019, 10, 320–325. 10.1039/c8sc03584a. [DOI] [PMC free article] [PubMed] [Google Scholar]
- Madea D.; Martínek M.; Muchová L.; Váňa J.; Vítek L.; Klán P. Structural modifications of nile red carbon monoxide fluorescent probe: Sensing mechanism and applications. J. Org. Chem. 2020, 85, 3473. 10.1021/acs.joc.9b03217. [DOI] [PubMed] [Google Scholar]
- Pal S.; Mukherjee M.; Sen B.; Mandal S. K.; Lohar S.; Chattopadhyay P.; Dhara K. A new fluorogenic probe for the selective detection of carbon monoxide in aqueous medium based on Pd(0) mediated reaction. Chem. Commun. 2015, 51, 4410–4413. 10.1039/c5cc00902b. [DOI] [PubMed] [Google Scholar]
- Yan J.; Zhu J.-Y.; Tan Q.-F.; Zhou L.-F.; Yao P.-F.; Lu Y.-T.; Tan J.-H.; Zhang L. Development of a colorimetric and NIR fluorescent dual probe for carbon monoxide. RSC Adv. 2016, 6, 66373–65376. 10.1039/c6ra14409h. [DOI] [Google Scholar]
- Feng W.; Liu D.; Feng S.; Feng G. Readily available fluorescent probe for carbon monoxide imaging in living cells. Anal. Chem. 2016, 88, 10648–10653. 10.1021/acs.analchem.6b03073. [DOI] [PubMed] [Google Scholar]
- Feng S.; Liu D.; Feng W.; Feng G. Allyl fluorescein ethers as promising fluorescent probes for carbon monoxide imaging in living cells. Anal. Chem. 2017, 89, 3754–3760. 10.1021/acs.analchem.7b00135. [DOI] [PubMed] [Google Scholar]
- Feng W.; Liu D.; Zhai Q.; Feng G. Lighting up carbon monoxide in living cells by a readily available and highly sensitive colorimetric and fluorescent probe. Sens. Actuators, B 2017, 240, 625–630. 10.1016/j.snb.2016.09.023. [DOI] [Google Scholar]
- Feng W.; Hong J.; Feng G. Colorimetric and ratiometric fluorescent detection of carbon monoxide in air, aqueous solution, and living cells by a naphthalimide-based probe. Sens. Actuators, B 2017, 251, 389–395. 10.1016/j.snb.2017.05.099. [DOI] [Google Scholar]
- Feng W.; Feng G. A readily available colorimetric and near-infrared fluorescent turn-on probe for detection of carbon monoxide in living cells and animals. Sens. Actuators, B 2018, 255, 2314–2320. 10.1016/j.snb.2017.09.049. [DOI] [Google Scholar]
- Wang Z.; Geng Z.; Zhao Z.; Sheng W.; Liu C.; Lv X.; He Q.; Zhu B. A highly specific and sensitive ratiometric fluorescent probe for carbon monoxide and its bioimaging applications. New J. Chem. 2018, 42, 14417–14423. 10.1039/c8nj03152e. [DOI] [Google Scholar]
- Tian X.; Liu X.; Wang A.; Lau C.; Lu J. Bioluminescence imaging of carbon monoxide in living cells and nude mice based on Pd0-mediated Tsuji–Trost reaction. Anal. Chem. 2018, 90, 5951–5958. 10.1021/acs.analchem.8b01102. [DOI] [PubMed] [Google Scholar]
- Wang J.; Li C.; Chen Q.; Li H.; Zhou L.; Jiang X.; Shi M.; Zhang P.; Jiang G.; Tang B. Z. An easily available ratiometric reaction-based AIE probe for carbon monoxide light-up imaging. Anal. Chem. 2019, 91, 9388–9392. 10.1021/acs.analchem.9b02691. [DOI] [PubMed] [Google Scholar]
- Gong S.; Hong J.; Zhou E.; Feng G. A near-infrared fluorescent probe for imaging endogenous carbon monoxide in living systems with a large Stokes shift. Talanta 2019, 201, 40–45. 10.1016/j.talanta.2019.03.111. [DOI] [PubMed] [Google Scholar]
- Wang Z.; Zhao Z.; Liu C.; Geng Z.; Duan Q.; Jia P.; Li Z.; Zhu H.; Zhu B.; Sheng W. A long-wavelength ultrasensitive colorimetric fluorescent probe for carbon monoxide detection in living cells. Photochem. Photobiol. Sci. 2019, 18, 1851–1857. 10.1039/c9pp00222g. [DOI] [PubMed] [Google Scholar]
- Deng Y.; Hong J.; Zhou E.; Feng G. Near-infrared fluorescent probe with a super large Stokes shift for tracking CO in living systems based on a novel coumarin-dicyanoisophorone hybrid. Dyes Pigm. 2019, 170, 107634. 10.1016/j.dyepig.2019.107634. [DOI] [Google Scholar]
- Wang Z.; Zhao Z.; Wang R.; Yuan R.; Liu C.; Duan Q.; Zhu W.; Li X.; Zhu B. A mitochondria-targetable colorimetric and far-red fluorescent probe for the sensitive detection of carbon monoxide in living cells. Anal. Methods 2019, 11, 288–295. 10.1039/c8ay02152j. [DOI] [Google Scholar]
- Fang W.-L.; Tang Y.-J.; Guo X.-F.; Wang H. A fluorescent probe for carbon monoxide based on allyl ether rather than allyl ester: A practical strategy to avoid the interference of esterase in cell imaging. Talanta 2019, 205, 120070. 10.1016/j.talanta.2019.06.070. [DOI] [PubMed] [Google Scholar]
- Zhang W.; Wang Y.; Dong J.; Zhang Y.; Zhu J.; Gao J. Rational design of stable near-infrared cyanine-based probe with remarkable large Stokes Shift for monitoring carbon monoxide in living cells and in vivo. Dyes Pigm. 2019, 171, 107753. 10.1016/j.dyepig.2019.107753. [DOI] [Google Scholar]
- Zhou E.; Gong S.; Feng G. Rapid detection of CO in vitro and in vivo with a ratiometric probe showing near-infrared turn-on fluorescence, large Stokes shift, and high signal-to-noise ratio. Sens. Actuators, B 2019, 301, 127075. 10.1016/j.snb.2019.127075. [DOI] [Google Scholar]
- Zhou E.; Gong S.; Hong J.; Feng G. Development of a new ratiometric probe with near-infrared fluorescence and a large Stokes shift for detection of gasotransmitter CO in living cells. Spectrochim. Acta, Part A 2020, 227, 117657. 10.1016/j.saa.2019.117657. [DOI] [PubMed] [Google Scholar]
- Song F.; Garner A. L.; Koide K. A Highly sensitive fluorescent sensor for palladium based on the allylic oxidative insertion mechanism. J. Am. Chem. Soc. 2007, 129, 12354–12355. 10.1021/ja073910q. [DOI] [PubMed] [Google Scholar]
- Garner A. L.; Koide K. Studies of a fluorogenic probe for palladium and platinum leading to a palladium-specific detection method. Chem. Commun. 2009, 45, 86–88. 10.1039/b814197e. [DOI] [PubMed] [Google Scholar]
- Santra M.; Ko S.-K.; Shin I.; Ahn K. H. Fluorescent detection of palladium species with an O-propargylated fluorescein. Chem. Commun. 2010, 46, 3964–3966. 10.1039/c001922d. [DOI] [PubMed] [Google Scholar]
- Dhara K.; Lohar S.; Patra A.; Roy P.; Saha S. K.; Sadhukhan G.; Chattopadhyay P. A new lysosome-targetable turn-on fluorogenic probe for carbon monoxide imaging in living cells. Anal. Chem. 2018, 90, 2933–2938. 10.1021/acs.analchem.7b05331. [DOI] [PubMed] [Google Scholar]
- Chattopadhyay B.; Lohar S.; Patra A.; Ahmmed E.; Mandal S. K.; Bhakta J. N.; Dhara K.; Chattopadhyay P. A naphthalimide-based fluorescence ‘‘turn-on’’ chemosensor for highly selective detection of carbon monoxide: imaging applications in living cells. New J. Chem. 2018, 42, 13497–13502. 10.1039/c8nj02552e. [DOI] [Google Scholar]
- Feng W.; Feng S.; Feng G. A fluorescent ESIPT probe for imaging CO-releasing molecule-3 in living systems. Anal. Chem. 2019, 91, 8602–8606. 10.1021/acs.analchem.9b01908. [DOI] [PubMed] [Google Scholar]
- Yuan Z.; Yang X.; De La Cruz L. K.; Wang B. Nitro reduction-based fluorescent probes for carbon monoxide require reactivity involving a ruthenium carbonyl moiety. Chem. Commun. 2020, 56, 2190–2193. 10.1039/c9cc08296d. [DOI] [PMC free article] [PubMed] [Google Scholar]
- Wang Z.; Liu C.; Wang X.; Duan Q.; Jia P.; Zhu H.; Li Z.; Zhang X.; Ren X.; Zhu B.; Sheng W. A metal-free near-infrared fluorescent probe for tracking the glucose-induced fluctuations of carbon monoxide in living cells and zebrafish. Sens. Actuators, B 2019, 291, 329–336. 10.1016/j.snb.2019.04.084. [DOI] [Google Scholar]
- Tang Z.; Song B.; Ma H.; Luo T.; Guo L.; Yuan J. Mitochondria-targetable ratiometric time-gated luminescence probe for carbon monoxide based on lanthanide complexes. Anal. Chem. 2019, 91, 2939–2946. 10.1021/acs.analchem.8b05127. [DOI] [PubMed] [Google Scholar]
- Zhang C.; Xie H.; Zhan T.; Zhang J.; Chen B.; Qian Z.; Zhang G.; Zhang W.; Zhou J. A new mitochondrion targetable fluorescent probe for carbon monoxide-specific detection and live cell imaging. Chem. Commun. 2019, 55, 9444–9447. 10.1039/c9cc03909k. [DOI] [PubMed] [Google Scholar]
- Toscani A.; Marín-Hernández C.; Robson J. A.; Chua E.; Dingwall P.; White A. J. P.; Sancenón F.; de la Torre C.; Martínez-Máñez R.; Wilton-Ely J. D. E. T. Highly sensitive and selective molecular probes for chromo-fluorogenic sensing of carbon monoxide in air, aqueous solution and cells. Chem.—Eur. J. 2019, 25, 2069–2081. 10.1002/chem.201805244. [DOI] [PubMed] [Google Scholar]
- Dulebohn J. I.; Haefner S. C.; Berglund K. A.; Dunbar K. R. Reversible carbon monoxide addition to sol-gel derived composite films containing a cationic rhodium(I) complex: towards the development of a new class of molecule-based carbon monoxide sensors. Chem. Mater. 1992, 4, 506–508. 10.1021/cm00021a006. [DOI] [Google Scholar]
- Haefner S. C.; Dunbar K. R.; Bender C. Reversible carbon monoxide reactions of cationic rhodium(I) and -(II) complexes. J. Am. Chem. Soc. 1991, 113, 9540–9553. 10.1021/ja00025a019. [DOI] [Google Scholar]
- Bedford R. B.; Hill A. F.; Jones C.; White A. J. P.; Williams D. J.; Wilton-Ely J. D. E. T. Phosphaalkyne hydrometalation: Synthesis and reactivity of the complexes [Ru(PCHCMe3)Cl(CA)(PPh3)2] (A = O, S). Organometallics 1998, 17, 4744–4753. 10.1021/om980204c. [DOI] [Google Scholar]
- Benito-Gargorri D.; Puchberger M.; Mereiter K.; Kirchner K. Stereospecific and reversible CO binding at iron pincer complexes. Sensitive and selective chromogenic sensing of carbon monoxide by using binuclear rhodium complexes. Angew. Chem., Int. Ed. 2008, 47, 9142–9145. [DOI] [PubMed] [Google Scholar]
- Esteban J.; Ros-Lis J. V.; Martínez-Máñez R.; Marcos M. D.; Moragues M.; Soto J.; Sancenón F. Sensitive and selective chromogenic sensing of carbon monoxide by using binuclear rhodium complexes. Angew. Chem., Int. Ed. 2010, 49, 4934–4937. 10.1002/anie.201001344. [DOI] [PubMed] [Google Scholar]
- Marín-Hernández C.; Toscani A.; Sancenón F.; Wilton-Ely J. D. E. T.; Martínez-Máñez R. Chromo-fluorogenic probes for carbon monoxide detection. Chem. Commun. 2016, 52, 5902–5911. 10.1039/c6cc01335j. [DOI] [PubMed] [Google Scholar]
- Halter O.; Fernandez I.; Fernández H. Fine-tuning the fluorescence gain of FRET-type (Bodipy)(Bodipy′)-NHC-iridium complexes for CO detection with a large virtual stokes shift. Chem.—Eur. J. 2017, 23, 711–719. 10.1002/chem.201604757. [DOI] [PubMed] [Google Scholar]
- Bergmann M.; Egert M.; Plenio H. Malodorogenic sensing of carbon monoxide. Chem.—Eur. J. 2017, 23, 13328–13331. 10.1002/chem.201703726. [DOI] [PubMed] [Google Scholar]
- Bergmann M.; Plenio H. Giving an odor to carbon monoxide: malodorogenic sensing of carbon monoxide via [IrCl(cod)(NHC)] complexes. Eur. J. Inorg. Chem. 2018, 2018, 2054–2059. 10.1002/ejic.201800325. [DOI] [Google Scholar]
- de La Torre C.; Toscani A.; Marín-Hernández C.; Robson J. A.; Terencio M. C.; White A. J. P.; Alcaraz M. J.; Wilton-Ely J. D. E. T.; Martínez-Máñez R.; Sancenón F. Ex vivo tracking of endogenous CO with a ruthenium(II) complex. J. Am. Chem. Soc. 2017, 139, 18484–18487. 10.1021/jacs.7b11158. [DOI] [PubMed] [Google Scholar]
- Southam H. M.; Smith T. W.; Lyon R. L.; Liao C.; Trevitt C. R.; Middlemiss L. A.; Cox F. L.; Chapman J. A.; El-Khamisy S. F.; Hippler M.; Williamson M. P.; Henderson P. J. F.; Poole R. K. A thiol-reactive Ru(II) ion, not CO release, underlies the potent antimicrobial and cytotoxic properties of CO-releasing molecule-3. Redox Biol. 2018, 18, 114–123. 10.1016/j.redox.2018.06.008. [DOI] [PMC free article] [PubMed] [Google Scholar]
- Aki T.; Unuma K.; Noritake K.; Hirayama N.; Funakoshi T.; Uemura K. Formation of high molecular weight p62 by CORM-3. PLoS One 2019, 14, e0210474 10.1371/journal.pone.0210474. [DOI] [PMC free article] [PubMed] [Google Scholar]
- Steiger A. K.; Pardue S.; Kevil C. G.; Pluth M. D. Self-immolative thiocarbamates provide access to triggered H2S donors and analyte replacement fluorescent probes. J. Am. Chem. Soc. 2016, 138, 7256–7259. 10.1021/jacs.6b03780. [DOI] [PMC free article] [PubMed] [Google Scholar]
- Xu H.; Xu H.; Ma S.; Chen X.; Huang L.; Chen J.; Gao F.; Wang R.; Lou K.; Wang W. Analyte regeneration fluorescent probes for formaldehyde enabled by regiospecific formaldehyde-induced intramolecularity. J. Am. Chem. Soc. 2018, 140, 16408–16412. 10.1021/jacs.8b09794. [DOI] [PubMed] [Google Scholar]
- Anderson S. N.; Richards J. M.; Esquer H. J.; Benninghoff A. D.; Arif A. M.; Berreau L. M. A structurally-tunable 3-hydroxyflavone motif for visible light-induced carbon monoxide-releasing molecules (CORMs). ChemistryOpen 2015, 4, 590–594. 10.1002/open.201500167. [DOI] [PMC free article] [PubMed] [Google Scholar]
- Popova M.; Soboleva T.; Arif A. M.; Berreau L. M. Properties of a flavonol-based photoCORM in aqueous buffered solutions: influence of metal ions, surfactants and proteins on visible light-induced CO release. RSC Adv. 2017, 7, 21997–22007. 10.1039/c7ra02653f. [DOI] [Google Scholar]
- Soboleva T.; Esquer H. J.; Anderson S. N.; Berreau L. M.; Benninghoff A. D. Mitochondrial-localized versus cytosolic intracellular CO-releasing organic photoCORMs: Evaluation of CO effects using bioenergetics. ACS Chem. Biol. 2018, 13, 2220–2228. 10.1021/acschembio.8b00387. [DOI] [PMC free article] [PubMed] [Google Scholar]
- Han X.; Whitfield S.; Cotten J. Synthesis, characterization, and CO-releasing property of palladium(II) bipyridine flavonolate complexes. Transition Met. Chem. 2020, 10.1007/s11243-019-00373-9. [DOI] [Google Scholar]
- Han X. Private communication. [Google Scholar]
- Han X.; Kumar M. R.; Hoogerbrugge A.; Klausmeyer K. K.; Ghimire M. M.; Harris L. M.; Omary M. A.; Farmer P. J. Mechanistic investigations of photoinduced oxygenation of Ru(II) bis-bipyridyl flavonolato complexes. Inorg. Chem. 2018, 57, 2416–2424. 10.1021/acs.inorgchem.7b01384. [DOI] [PubMed] [Google Scholar]
- Han X.; Klausmeyer K. K.; Farmer P. J. Characterization of the initial intermediate formed during photoinduced oxygenation of the ruthenium(II) bis(bipyridyl)flavonolate complex. Inorg. Chem. 2016, 55, 7320–7322. 10.1021/acs.inorgchem.6b00852. [DOI] [PubMed] [Google Scholar]
- Saraf S. L.; Fish T. J.; Benninghoff A. D.; Buelt A. A.; Smith R. C.; Berreau L. M. Photochemical reactivity of RuII(η6-p-cymene) flavonolato compounds. Organometallics 2014, 33, 6341–6351. 10.1021/om5006337. [DOI] [Google Scholar]
- Kurzwernhart A.; Kandioller W.; Bächler S.; Bartel C.; Martic S.; Buczkowska M.; Mühlgassner G.; Jakupec M. A.; Kraatz H.-B.; Bednarski P. J.; Arion V. B.; Marko D.; Keppler B. K.; Hartinger C. G. Structure-activity relationships of targeted Ru(II) (n6-p-cymene) anticancer complexes with flavonol-deried ligands. J. Med. Chem. 2012, 55, 10512–10522. 10.1021/jm301376a. [DOI] [PubMed] [Google Scholar]
- Kurzwernhart A.; Kandioller W.; Enyedy É. A.; Novak M.; Jakupec M. A.; Keppler B. K.; Hartinger C. G. 3-Hydroxyflavone and 3-hydroxyquinolinones: Structure-activity relationships and stability studies on Ru(II)(arene) anticancer complexes with biologically active ligands. Dalton Trans. 2013, 42, 6193–6202. 10.1039/c2dt32206d. [DOI] [PubMed] [Google Scholar]
- McLaughlin M. P.; Darrah T. H.; Holland P. L. Palladium(II) and platinum(II) bind strongly to an engineered blue copper protein. Inorg. Chem. 2011, 50, 11294–11296. 10.1021/ic2017648. [DOI] [PMC free article] [PubMed] [Google Scholar]
Associated Data
This section collects any data citations, data availability statements, or supplementary materials included in this article.