Abstract
Background. An outbreak of severe acute respiratory syndrome (SARS) occurred in our 22-bed intensive care unit (ICU; Prince of Wales Hospital, Hong Kong, HKSAR, China) from 12 March to 31 May 2003, when only patients with SARS were admitted. This period was characterized by the upgrading of infection control precautions, which included the wearing of gloves and gowns all the time, an extensive use of steroids, and a change in antibiotic prescribing practices. The pattern of endemic pathogenic organisms, the rates of acquisition of methicillin-resistant Staphylococcus aureus (MRSA), and the rates of ventilator-associated pneumonia (VAP) were compared with those of the pre-SARS and post-SARS periods.
Methods. Data on pathogenic isolates were obtained from the microbiology department (Prince of Wales Hospital). Data on MRSA acquisition and VAP rates were collected prospectively. MRSA screening was performed for all ICU patients. A case of MRSA carriage was defined as an instance in which MRSA was recovered from any site in a patient, and cases were classified as imported or ICU-acquired if the first MRSA isolate was recovered within 72 h of ICU admission or after 72 h in the ICU, respectively.
Results. During the SARS period in the ICU, there was an increase in the rate of isolation of MRSA and Stenotrophomonas and Candida species but a disappearance of Pseudomonas and Klebsiella species. The MRSA acquisition rate was also increased: it was 3.53% (3.53 cases per 100 admissions) during the pre-SARS period, 25.30% during the SARS period, and 2.21% during the post-SARS period (P < .001). The VAP rate was high, at 36.5 episodes per 1000 ventilator-days, and 47% of episodes were caused by MRSA.
Conclusions. A SARS outbreak in the ICU led to changes in the pathogen pattern and the MRSA acquisition rate. The data suggest that MRSA cross-transmission may be increased if gloves and gowns are worn all the time.
Severe acute respiratory syndrome (SARS) is caused by a novel SARS-associated coronavirus (SARS-CoV) [1]. The SARS epidemic started in November 2002 in the Guangdong province in China and, within a few months, had spread rapidly around the world, including to Hong Kong [2]. A striking feature of SARS is its high rate of nosocomial transmission [3] and the high proportion of young patients that can become critically ill. There was a SARS outbreak in our institution, Prince of Wales Hospital (Hong Kong, HKSAR, China), in March 2003 [4], as a result of which our intensive care unit (ICU) admitted only patients with SARS from 12 March until 31 May 2003.
During the SARS period in the ICU, the patient demographics, disease pattern, use of antibiotics, and infection control procedures were all different from those of the pre-SARS and post-SARS periods. Infection control measures, in particular, were upgraded, including use of enhanced personal protective equipment (PPE) and more rigorous environment cleansing and disinfection. Infection control measures placed heavy emphasis on use of PPE because of the high rate of transmission of SARS to health care workers. Routinely used PPE included N95 respirators; face shields; caps; long-sleeved, disposable gowns; and gloves [5]. For high-risk procedures, such as intubation and resuscitation, goggles were also used. We adopted a policy of “always gloving” and “always gowning”; that is, gloves and gowns were worn all the time in the ICU, even when there was no direct patient contact. Our standard hand-hygiene practices included hand-washing with chlorhexidine and alcoholic hand rub. We postulated that these changes might result in a change in the pattern of pathogenic isolates, the rate of methicillin-resistant Staphylococcus aureus (MRSA) acquisition, and the rate of ventilator-associated pneumonia (VAP).
Methods
Setting. The Prince of Wales Hospital in Hong Kong is a tertiary-care university teaching hospital with 1500 beds, and our 22-bed ICU is a mixed medical-surgical ICU. For the purpose of this study, the SARS period was defined as 12 March through 31 May 2003, the pre-SARS period as January 2001 through February 2003, and the post-SARS period as June 2003 through December 2003. During the SARS period, only patients with SARS were admitted to the ICU. APACHE II [6] scores were prospectively determined at admission for all patients. APACHE II scores range from 0–71, with higher scores indicating more-severe illness and predicting an increased likelihood of death.
MRSA importation and acquisition rates. MRSA is endemic in our ICU and accounted for almost 75% of all the Staphylococcus aureus isolates in the ICU in 2002. Patients colonized or infected with MRSA represent the reservoir for cross-transmission, and ICU acquisition rates were usually positively correlated with ICU importation rates [7]. An MRSA control program was implemented in 2000, whereby all patients with MRSA carriage would be isolated or cohorted, and strict standard precautions were taken to prevent spread of MRSA. As part of the MRSA control program, nasal swab specimens were obtained from all ICU patients to screen for MRSA carriage at the time of ICU admission, then weekly, and finally upon discharge from the ICU. A case of MRSA carriage was defined as an instance in which MRSA was recovered from a patient regardless of the site of and type of specimen (i.e., a screening or clinical diagnostic specimen), or whether the patient was colonized or infected with MRSA. A case of MRSA carriage was further classified as imported, if the first MRSA isolate from any site was recovered within 72 h after ICU admission, or as ICU-acquired if the first MRSA isolate was recovered after 72 h in the ICU. The number of imported and of ICU-acquired cases has been prospectively determined as part of our infection control audit since 2000. MRSA importation rates and MRSA ICU-acquisition rates were calculated as the total number of imported or ICU-acquired cases divided by the total number of ICU admissions over the same time period, respectively [8]. These 2 rates were also compared using patient-days as the denominator to adjust for differences in the length of stay in the ICU.
VAP during the SARS period. During the SARS period, data on VAP were collected as part of our infection control audit. We followed the model of infection surveillance developed by the National Nosocomial Infection Surveillance (NNIS) system, Centers for Disease Control and Prevention (CDC; Atlanta, GA) [9, 10]. The following data were collected daily by a dedicated team of doctors and nurses: number of new ICU admissions, total number of ICU patients, number of intubated patients, and number of new episodes of VAP and the causative organisms. These data were compared against NNIS system data [11] because VAP data for the immediate pre-SARS and post-SARS periods were not available.
Pathogenic microbial culture rates. The data for the period 2001–2003 were obtained from the database of our microbiology department (Prince of Wales Hospital, Hong Kong). The most prevalent and important pathogenic organisms in the ICU were selected (i.e., MRSA; Enterococcus, Candida, Acinetobacter,and Enterobacterspecies; Escherichia coli;and Klebsiella, Pseudomonas, and Stenotrophomonas species). Data on organisms that are often nonpathogenic or are infrequently recovered are not presented. If 2 or more isolates belonging to a single species of organism were recovered from the same patient, they were counted as 1 isolate, and the first or earliest site from which that isolate was cultured was defined as the source of the isolate. Both isolates that were imported or acquired in the ICU were included.
Antibiotic use rates. The data on the amounts of antimicrobials used in 2001–2003 were obtained from the hospital pharmacy, and only data on antibiotics that are commonly used in the ICU were selected and analyzed. Antimicrobial use rates were calculated and compared according to the method described by Project ICARE (Intensive Care Antimicrobial Resistance Epidemiology), which was developed by the CDC's Hospital Infections Program [12]. A defined daily dose (DDD) is the typical number of grams of an antimicrobial used per day for a typical adult patient. Antimicrobial use rates (or DDD rates) are defined as the number of DDDs per 1000 patient-days.
Statistical analysis. Statistical analysis was performed using SPSS software, version 10.0 (SPSS). Continuous variables were compared using the Student's t test. Categorical variables were compared using the χ2 test and the Fisher's exact test. When comparing rates per patient-days, 95% CIs around proportions were estimated. A P value (2-tailed) of <.05 was considered significant.
Results
Patient population. During the SARS period, we had a total of 83 admissions to the ICU. The median length of an ICU stay was 10.0 days, with an interquartile range (IQR) of 5.5–23.5 days. The median APACHE II score was 16 (IQR, 11–22) during the pre-SARS period, 10 (IQR, 8–13) during the SARS period, and 15 (IQR, 10–22) during the post-SARS period. All patients with SARS received ribavirin and high-dose pulse steroids [13]. The median total dose of methylprednisolone received per patient during an ICU stay was 2.71 g (IQR, 1.01–4.17 g).
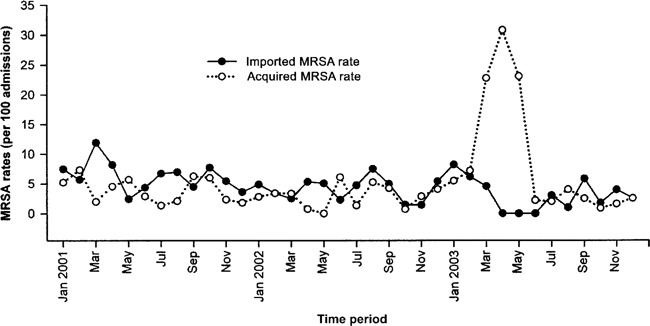
MRSA importation and acquisition rates. Figure 1 shows the rates of MRSA importation and ICU acquisition (cases per 100 admissions) from January 2001 through December 2003. During the SARS period, there were 2 imported cases and 21 ICU-acquired cases of MRSA acquisition. The MRSA importation rate during the SARS period was lower than that of the pre-SARS period but similar to that of the post-SARS period. However, there was a significant increase in the rate of MRSA ICU acquisition during the SARS period, regardless of whether the rate was calculated as cases per 100 patient admissions or cases per 1000 patient-days (table 1).
Figure 1.

Methicillin-resistant Staphylococcus aureus (MRSA) importation rates and acquisition rates (calculated as cases per 100 admissions) associated with an outbreak of severe acute respiratory syndrome in an intensive care unit (ICU) from January 2001 through December 2003.
Table 1.

Rates of importation and ICU acquisition of methicillin-resistant Staphylococcus aureus (MRSA) before, during, and after an outbreak of severe acute respiratory syndrome (SARS) in a Hong Kong hospital.
VAP during the SARS period. There were 30 episodes of VAP in 22 patients, for a rate of 36.5 episodes per 1000 ventilator-days. This is much higher than the 90th percentile distribution for medical ICUs (9.6 episodes per 1000 ventilator-days) or medical-surgical ICUs in major teaching hospital (12.1 per 1000 ventilator-days) in the NNIS system [11]. Most of the organisms causing VAP were MRSA (47.1% of isolates), followed by Stenotrophomonas species (29.4%) and Acinetobacter species (14.7%).
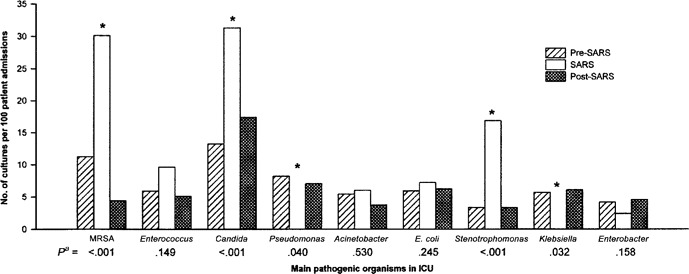
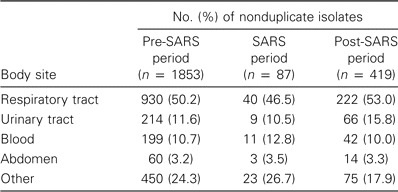
Pathogenic microbial culture rates. Figure 2 shows the frequency and distribution of the main pathogenic organisms in terms of the number of nonduplicate isolates per 100 patient admissions. These isolates included those imported into the ICU and those acquired after admission to the ICU. During the SARS period, there was a significant increase in the frequency of isolation of MRSA, Stenotrophomonas species, and Candida species and a significant decrease in the frequency of isolation of Pseudomonas and Klebsiella species. Table 2 shows the body sites from which these organisms were cultured. There were no differences among the 3 time periods, pre-SARS, SARS, and post-SARS.
Figure 2.

Rate of isolation of pathogens from culture before, during, and after an outbreak of severe acute respiratory syndrome (SARS) in an intensive care unit (ICU). *Significantly different during the SARS period, compared with the pre-and post-SARS periods.
Table 2.

The body sites from which the selected main pathogens were cultured.
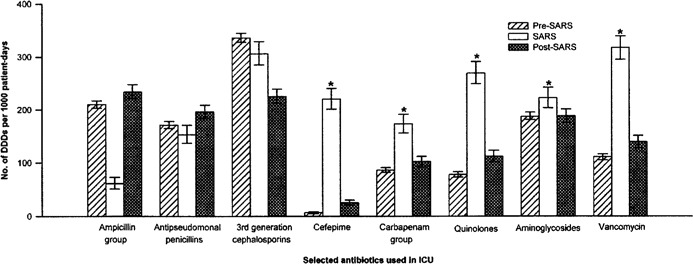
Antibiotic use rates. Figure 3 showed the use rates (DDDs per 1000 patient-days) of the common antibiotics used in the ICU. During the SARS period, there was a marked increase in total antibiotic use, as well as an increase in the use of cefepime, carbapenams, fluoroquinolones, aminoglycosides, and vancomycin.
Figure 3.

Antibiotic use rates (calculated as defined daily doses [DDDs] per 1000 patient-days) of the selected commonly used antibiotics in the intensive care unit (ICU) before, during, and after an outbreak of severe acute respiratory syndrome (SARS). *Significantly increased during the SARS period, compared with the pre- and post-SARS periods. The ampicillin group includes amoxicillin/clavulanate, ampicillin/sulbactam, and ampicillin. The antipseudomonal penicillin group includes piperacillin and piperacillin/tazobactam. The third-generation cephalosporin group includes ceftazidime, cefotaxime, ceftriazone, and cefoperazone/sulbactam. The carbapenam group includes imipenam/cilastatin and meropenam. The quinolone group includes ciprofloxacin and levofloxacin. The aminoglycoside group includes netilmicin, amikan, and gentamycin.
Discussion
Our data demonstrated that changes in the case mix of patients, infection control measures, and antibiotic prescribing practices in an ICU during a SARS outbreak could result in major changes in the rates of cross-transmission of MRSA and the pattern of prevalent pathogenic microbes. The increase in acquisition of MRSA and Candida species is a serious concern because of the high morbidity and mortality and the limited therapeutic options associated with infection with these organisms [14–16]. Among the gram-negative isolates, there was an increase of Stenotrophomonas species and a disappearance of Pseudomonas and Klebsiella species. The data are of importance because they suggest that microbiological surveillance may be necessary after instituting changes in the ICU so that appropriate empirical antibiotic treatment can be chosen.
One important finding of our study is that the frequency of acquisition of MRSA in the ICU was significantly increased despite upgraded infection control measures and a low importation rate of MRSA into the ICU. There are a number of plausible explanations. First, this could be related to our infection control policy. During the SARS period, all patients in the ICU were patients with SARS, and the whole ICU was considered to be a high-risk area. The practice of wearing gloves and gowns all the time was introduced at that time with the intention of maximizing staff protection. Although staff were advised to change gloves and cleanse hands before and after each contact with a patient and between dirty body-site and clean body-site care for the same patient, excessive use of gloves, especially worn together with the long-sleeved gowns, could have contributed to low compliance with this policy. In fact, poor compliance with hand hygiene has been identified among glove users in previous studies [17–19]. This could result in direct cross-transmission of MRSA between patients and also heavy contamination of the ICU environment (e.g., the nursing station, the radiograph viewing room, and other non—patient-care areas), leading to an increase in MRSA acquisition in the ICU. The routine wearing of long-sleeved gowns, which were not changed between contacts with patients, could also have contributed to cross-transmission of MRSA [20]. During the post-SARS period, when the routine wearing of gloves and gowns was abandoned, the MRSA acquisition rate decreased again to the pre-SARS level.
Another reason for the increase in MRSA aquisition during the SARS period could be the heavy use of antimicrobials active against gram-negative organisms. This, and the heavy use of steroids, could also have contributed to the overgrowth of both MRSA and Candida species. It has also been suggested that fluoroquinolone use is a risk factor in selecting for MRSA carriage [21] and infection [22], and the use of fluoroquinolones in our ICU was significantly increased during the SARS period.
The third plausible mechanism might be related to SARS-CoV. The VAP rate was high during the SARS period, and about half of all episodes were caused by MRSA. It is known that influenza increases the risk of secondary infection by S. aureus [23, 24]. Since SARS-CoV is a respiratory virus, it is possible that SARS may also predispose patients to secondary infection by S. aureus. The molecular mechanism for this is uncertain.
The eradication of Pseudomonas species during the SARS outbreak is noteworthy because they were important pathogens in the ICU before and after the SARS period. Although changes in respiratory-care practices and environment disinfection during the SARS period could have contributed to this phenomenon, most of these practices continued into the post-SARS period, when Pseudomonas species were again prevalent, and, therefore, were unlikely to be important causative factors. However, the heavy use of cefepime during the SARS period, a drug that is otherwise rarely used and to which most Pseudomonas species would be presumed to be sensitive because of previous nonexposure, might be a contributing factor.
In summary, we have shown that changes in an ICU during a SARS outbreak may be associated with a significant change in the pattern of endemic pathogens. The data also suggest that cross-transmission of MRSA may be increased, despite upgraded infection control measures, if the measures included excessive use of gloves and gowns.
acknowledgments
We would like to thank the following nurses for their help in data collection: D. Y. M. Ho, R. F. Y. Chan, V. T. S. Lai, B. S. Tam, W. H. Sung, C. Cheng, A. W. S. Fung, Y. F. Chan, L. M. Yeung, Y. Y. Tang, and C. W. Y. Chau.
Conflict of interest. All authors: No conflict.
references
- 1.Fouchier RA, Kuiken T, Schutten M, et al. Aetiology: Koch's postulates fulfilled for SARS virus. Nature. 2003;423:240. doi: 10.1038/423240a. [DOI] [PMC free article] [PubMed] [Google Scholar]
- 2.World Health Organization . Summary table of SARS cases by country, 1 November 2002-7 August 2003. 2003. Available at: http://www.who.int/csr/sars/country/2003_08_15/en/. Accessed 20 November 2003. [Google Scholar]
- 3.Centers for Disease Control Prevention Cluster of severe acute respiratory syndrome cases among protected health-care workers—Toronto, Canada, April 2003. MMWR Morb Mortal Wkly Rep. 2003;52:433–6. [PubMed] [Google Scholar]
- 4.Lee N, Hui D, Wu A, et al. A major outbreak of severe acute respiratory syndrome in Hong Kong. N Engl J Med. 2003;348:1986–94. doi: 10.1056/NEJMoa030685. [DOI] [PubMed] [Google Scholar]
- 5.Li ST, Buckley TA, Yap FH, Sung JJ, Joynt GM. Severe acute respiratory syndrome (SARS): infection control. Lancet. 2003;361:1386. doi: 10.1016/S0140-6736(03)13052-8. [DOI] [PMC free article] [PubMed] [Google Scholar]
- 6.Knaus WA, Draper EA, Wagner DP, Zimmerman JE. APACHE II: a severity of disease classification system. Crit Care Med. 1985;13:818–29. [PubMed] [Google Scholar]
- 7.Ho PL, for the Hong Kong Intensive Care Unit Antimicrobial Resistance Study (HK-ICARE) Group Carriage of methicillin-resistant Staphylococcus aureus, ceftazidime-resistant gram-negative bacilli, and vancomycin-resistant enterococci before and after intensive care unit admission. Crit Care Med. 2003;31:1175–82. doi: 10.1097/01.CCM.0000059437.01924.97. [DOI] [PubMed] [Google Scholar]
- 8.Girou E, Pujade G, Legrand P, Cizeau F, Brun-Buisson C. Selective screening of carriers for control of methicillin-resistant Staphylococcus aureus (MRSA) in high-risk hospital areas with a high level of endemic MRSA. Clin Infect Dis. 1998;27:543–50. doi: 10.1086/514695. [DOI] [PubMed] [Google Scholar]
- 9.Gaynes RP, Horan TC. Surveillance of nosocomial infections. In: Mayhall CG, editor. Hospital epidemiology and infection control. 2nd ed. Philadelphia: Lippincott Williams and Wilkins; 1999. pp. 1285–317. [Google Scholar]
- 10.Emori TG, Culver DH, Horan TC, et al. National Nosocomial Infections Surveillance (NNIS) system: description of surveillance methodology. Am J Infect Control. 1991;19:19–35. doi: 10.1016/0196-6553(91)90157-8. [DOI] [PubMed] [Google Scholar]
- 11.National Nosocomial Infections Surveillance (NNIS) System Report, data summary from January 1992 through June 2003, issued August 2003. Am J Infect Control. 2003;31:481–98. doi: 10.1016/j.ajic.2003.09.002. [DOI] [PubMed] [Google Scholar]
- 12.Fridkin SK, Steward CD, Edwards JR, et al. Surveillance of antimicrobial use and antimicrobial resistance in United States hospitals: Project ICARE phase 2. Clin Infect Dis. 1999;29:245–52. doi: 10.1086/520193. [DOI] [PubMed] [Google Scholar]
- 13.So LK, Lau AC, Yam LY, et al. Development of a standard treatment protocol for severe acute respiratory syndrome. Lancet. 2003;361:1615–7. doi: 10.1016/S0140-6736(03)13265-5. [DOI] [PMC free article] [PubMed] [Google Scholar]
- 14.Rello J, Torres A, Ricart M, et al. Ventilator-associated pneumonia by Staphylococcus aureus: comparison of methicillin-resistant and methicillin-sensitive episodes. Am J Respir Crit Care Med. 1994;150:1545–9. doi: 10.1164/ajrccm.150.6.7952612. [DOI] [PubMed] [Google Scholar]
- 15.Wunderink RG, Rello J, Cammarata SK, Croos-Dabrera RV, Kollef HK. Linezolid versus vancomycin: analysis of two double-blind studies of patients with methicillin-resistant Staphylococcus aureus nosocomial pneumonia. Chest. 2003;124:1789–97. [PubMed] [Google Scholar]
- 16.Pfaller MA, Jones RN, Messer SA, Edmond MB, Wenzel RP, SCOPE Participant Group National surveillance of nosocomial blood stream infections due to species of Candida other than Candida albicans: frequency of occurrence and antifungal susceptibility in the SCOPE program. Diagn Microbiol Infect Dis. 1998;31:327–32. doi: 10.1016/s0732-8893(97)00240-x. [DOI] [PubMed] [Google Scholar]
- 17.Pittet D. Improving compliance with hand hygiene in hospitals. Infect Control Hosp Epidemiol. 2000;21:381–6. doi: 10.1086/501777. [DOI] [PubMed] [Google Scholar]
- 18.Thompson BL, Dwyer DM, Ussery XT, Denman S, Vacek P, Schwartz B. Handwashing and glove use in a long-term care facility. Infect Control Hosp Epidemiol. 1997;18:97–103. doi: 10.1086/647562. [DOI] [PubMed] [Google Scholar]
- 19.Khatib M, Jamaleddine G, Abdallah A, Ibrahim Y. Hand washing and use of gloves while managing patients receiving mechanical ventilation in the ICU. Chest. 1999;116:172–5. doi: 10.1378/chest.116.1.172. [DOI] [PubMed] [Google Scholar]
- 20.Horikawa K, Murakami K, Kawano F. Isolation and characterization of methicillin-resistant Staphylococcus aureus strains from nares of nurses and their gowns. Microbiol Res. 2001;155:345–9. doi: 10.1016/S0944-5013(01)80014-8. [DOI] [PubMed] [Google Scholar]
- 21.Harbarth S, Liassine N, Dharan S, Herrault P, Auckenthaler R, Pittet D. Risk factors for persistent carriage of methicillin-resistant Staphylococcus aureus. Clin Infect Dis. 2000;31:1380–5. doi: 10.1086/317484. [DOI] [PubMed] [Google Scholar]
- 22.Manhold C, vonRolbick U, Brase R, et al. Outbreaks of Staphylococcus aureus infections during treatment of late onset pneumonia with ciprofloxacin in a prospective, randomized study. Intensive Care Med. 1998;24:1327–30. doi: 10.1007/s001340050770. [DOI] [PubMed] [Google Scholar]
- 23.Price TM. Fulminating bacterial pneumonia complicating influenza [letter] Br Med J. 1976;28:520. doi: 10.1136/bmj.1.6008.520. [DOI] [PMC free article] [PubMed] [Google Scholar]
- 24.Austin RM, Daniels CA. The role of protein A in the attachment of staphylococci to influenza-infected cells. Lab Invest. 1978;39:128–32. [PubMed] [Google Scholar]


