

Abstract
Alzheimer’s disease (AD) is characterized by the presence of neuritic plaques in which dystrophic neurites (DNs) are typical constituents. We recently showed that DNs labeled by antibodies to the tubular endoplasmic reticulum (ER) protein reticulon-3 (RTN3) are enriched with clustered tubular ER. However, multi-vesicle bodies are also found in DNs, suggesting that different populations of DNs exist in brains of AD patients. To understand how different DNs evolve to surround core amyloid plaques, we monitored the growth of DNs in AD mouse brains (5xFAD and APP/PS1ΔE9 mice) by multiple approaches, including 2-dimensional and 3-dimesnional (3D) electron microscopy (EM). We discovered that a pre-autophagosome protein ATG9A was enriched in DNs when a plaque was just beginning to develop. ATG9A-positive DNs were often closer to the core amyloid plaque, while RTN3-immunoreactive DNs were mostly located in the outer layers of ATG9A-positive DNs. Proteins such as RAB7 and LC3 appeared in DNs at later stages during plaque growth, likely accumulated as a part of large autophagy vesicles, and were distributed relatively furthest from the core amyloid plaque. Reconstructing the 3D structure of different morphologies of DNs revealed that DNs in AD mouse brains were constituted in three layers that are distinct by enriching different types of vesicles, as validated by immune-EM methods. Collectively, our results provide the first evidence that DNs evolve from dysfunctions of pre-autophagosomes, tubular ER, mature autophagosomes, and the ubiquitin proteasome system during plaque growth.
Keywords: Dystrophic neurites, RIDNs, ATG9, preautophagosomes, autophagosomes, lysosomes, tubular ER, Alzheimer’s disease
Introduction
Alzheimer’s disease (AD) is the most common neurodegenerative disease and is characterized by the presence of senile plaques and neurofibrillary tangles in patients’ brains 1–4. Although amyloid plaques exist in non-demented aging brains, often in diffuse forms 5,6, AD brains may have more senile plaques in which the amyloid core is surrounded by activated microglia, reactive astrocytes, and dystrophic neurites (DNs). DNs refer to swollen neuritic processes 6–9 and their presence correlates with synaptic impairments. While the regulated formation of amyloid deposition has been extensively studied, it remains elusive as to how DNs are formed in AD brains and how to prevent their formation.
In AD postmortem brains, DNs are morphologically recognized by immunohistochemical staining with antibodies specific to ubiquitin, neurofilament, phosphorylated tau, and amyloid precursor protein (APP) 10–12. We have shown that antibodies against reticulon 3 (RTN3), which is known to shape tubular endoplasmic reticulum (ER), label an abundant population of DNs in AD brains compared to many previously-reported markers 13. Such RTN3 immunoreactive DNs (RIDNs) can be co-labeled by two other tubular ER shaping proteins, receptor expression-enhancing protein 2 (REEP2) and REEP5 14. We further demonstrated that RIDNs are enriched with abnormally clustered tubular ER in inclusion bodies located in the vicinity of amyloid plaques. Tubular ER is found in association with mitochondria by mediating the formation of mitochondrial constriction sites 15. Consistently, clustered tubular ER appears to cause enhanced mitochondrial fission and mitochondrial degeneration within the tubular ER inclusion in AD brain biopsies, as revealed by ultrastructural examination 14. Thus, abnormal tubular ER distribution in AD brains is one underlying molecular mechanism in the formation of RIDNs.
However, DNs in both AD human postmortem and AD mouse brains were also found to enrich multi-vesicular bodies, likely derived from impaired lysosomes or autophagosomes 16–18. Autophagy, specifically macro-autophagy, undergoes multiple steps of autophagosomal formation, including the maturation and eventual degradation of lysosomes. More than 30 autophagy proteins are involved in autophagy lysosomal processes, with their particular involvement concentrated in sequential steps from initial pre-autophagosome formation to autophagosome-lysosomal fusion 19–22. In AD brains, the maturation of autophagosomes and their retrograde trafficking are impaired by extracellular deposition of β-amyloid peptides (Aβ), which leads to the accumulation of enormous autophagic vacuoles 23–25. In immunofluorescent studies, such defective autophagic derivatives have been detected by antibodies specific to the lysosomal luminal proteases LAMP1 and cathepsin D 18,26. Ultrastructural morphologies of plaque-associated DNs in AD postmortem brains and AD mouse brains have identified multi-vesicular bodies with diversified electron-density 24,25,27,28. These heterogeneous vesicles, ranging from 10 μm2 to over 100 μm2 in size in AD brains, are likely initial autophagic vesicles containing undigested materials and double membrane autolysomal intermediates 25. However, the functional involvement of autophagy proteins in the formation of DNs is not yet understood.
In order to better understand how different populations of DNs are evolving in areas surrounding the core amyloid plaques in AD brains, we explored various proteins that are likely to mediate the formation of DNs by using APP-overexpressing AD mouse models. We found that ATG9A, which is an early autophagy protein, was massively accumulated in DNs that were surrounding amyloid plaques. ATG9A-positive DNs appeared at the earliest stages of plaque development and encircled the core of amyloid plaques. RIDNs were mostly overlapping with ATG9A+ DNs, although a sizeable portion of RIDNs was found to surround ATG9A+ DNs. The autophagy proteins LC3 and RAB7 were also found in DNs at later stages of plaque growth.
We employed both immune-EM and 3-dimensional (3D) electron microscopic (EM) studies on two AD mouse models to further validate the above observations. All of those late autophagy proteins were partially co-localized with RIDNs, and they mostly localized at the outer periphery of RIDN layers. In our ultrastructural studies on brains from AD mouse models, we observed few ER tubule inclusion bodies and an abundance of multi-vesicles with different morphologies and sizes. Measuring the distance from the center of the amyloid-deposited core, we found that small vesicular bodies were predominantly located in close proximity to the amyloid core, followed by ER tubules containing inclusions and then by larger vesicular bodies, as revealed by reconstruction of the 3D DN structures. Altogether, DNs in AD brains constitute in at least three different types and layers due to impairment of normal tubular ER distribution, dysfunction of pre-autophagosomes, autophagy-lysosomal processes, and defects in ubiquitin proteosomal systems. We postulate that preventing impairments in pre-autophagosomes may prevent Aβ-mediated formation of DNs.
Materials and Methods
Mouse strains
5xFAD and Tg-APPsw/PSEN1DE9 (PA) mice were purchased from Jackson Laboratory (stock # 34840 and 004462, respectively). All mice in the study were maintained and used according to protocols approved by the Institutional Animal Care and Use Committee of the Cleveland Clinic Foundation and the University of Connecticut.
Immunofluorescent confocal microscopy
A standard method of immuno-confocal experiments was performed as previously described 13. Briefly, mouse brains were dissected and fixed with 4% paraformaldehyde fixation for 12h and immersed in 20% sucrose overnight at 4°C. The fixed brain tissue was then sectioned in the sagittal plane at a 14 μm thickness using a cryostat after O.C.T. compound embedding. Brain sections were stored at −20°C. After three washes with phosphate-buffered saline (PBS), the sections were permeabilized with 0.3% Triton X-100 for 30 min and rinsed in PBS three times to remove detergent. Antigen retrieval was then performed by heating in a microwave in 0.05 M citrate-buffered saline, pH 6.0, for 5 min. The sections were then blocked with 5% normal goat serum and incubated with individual primary antibodies: 6E10 (Covance Research Products Inc Cat# SIG-39330-200, RRID: AB_662804), ATG5 (Proteintech Group Cat# 10181-2-AP, RRID:AB_2062045), APG7 (Abcam Cat# ab133528, RRID:AB_2532126), ATG9A (Abcam Cat# ab108338, RRID:AB_10863880), ATG12 (Cell Signaling Technology Cat# 4180S, RRID:AB_1903898), ATG13 (Abcam Cat# ab214074), ATG14L (Proteintech Group Cat# 19491-1-AP, RRID:AB_10642701), ATG16L (Abcam Cat# ab187671), Beclin 1 (Abcam Cat# ab114071, RRID:AB_10859477), CLIMP63/CKAP4 (Abcam Cat# ab84712, RRID:AB_2229521), Iba1 (Wako Cat# 019-19741, RRID:AB_839504), LC3B (Abcam Cat# ab192890), p62 (Abcam Cat# ab109012), PI3K III (Cell Signaling Technology Cat# 4263, RRID:AB_2299765), PI3K subunit 4 (Abcam Cat# ab128903, RRID:AB_11141464), R458 (1:1,000; Millipore; 29,30 ), RAB5 (Abcam Cat# ab109534, RRID:AB_10865740), RAB7 (Abcam Cat# ab137029, RRID:AB_2629474), REEP5 (Proteintech Group Cat# 14643-1-AP, RRID:AB_2178440), RTN3 monoclonal (recently developed in Dr. Yan lab), SMI22/GFAP (Covance Research Products Inc Cat# SMI-22R, RRID:AB_2313859), SMI31 (Covance Research Products Inc Cat# SMI-31R-100, RRID:AB_10122491) Ubiquitin (Sigma-Aldrich Cat# U5379, RRID:AB_477667), ULK1 (Abcam Cat# ab128859, RRID:AB_11156928), UVRAG (Abcam Cat# ab174550), and WIP II (Abcam Cat# ab128901, RRID:AB_11145255). After incubation at 4°C overnight, sections were washed with PBS three times and incubated with secondary antibodies conjugated with Alexa Fluor 488 or Alexa Fluor 568 (Molecular Probes) for 2h at room temperature. Nuclei were stained using To-pro dye (1:1000) for 15 min. Images were examined and captured with a Leica SP5 and a Ziess LSM880 confocal microscope. The quality of RTN3 monoclonal antibody was confirmed by Western blotting and immunohistochemical staining by utilizing reticulon 3 knockout (RTN3 KO) mice
Three-dimensional electron microscopy (3D EM)
A 10-month-old 5xFAD mouse was anesthetized by injecting pentobarbital interperitoneally and perfused intracardially with ~100 ml of 0.1 m sodium cacodylate buffer containing 4% paraformaldehyde and 2.5% glutaraldehyde, pH 7.4. The left and right hippocampus of the extracted brain were fixed overnight with 0.1 m sodium cacodylate buffer containing 4% paraformaldehyde and 2.5% glutaraldehyde. After washing 3 times with 0.1M sodium cacodylate, the samples were placed in 0.1% tannic acid for 30 min and then washed with sodium cacodylate solution. Next, the samples were sequentially processed by 2h incubation with 2% osmium tetroxide/potassium ferrocyanide on ice, 20 min treatment with freshly-prepared 1% thiocarbohydrazide at 60°C, and 1h incubation with 2% osmium tetroxide solution on a rotor at room temperature. The samples were then placed in new vials, washed 3 times with distilled water, and placed in saturated uranyl acetate solution overnight at 4°C. The following day, samples were washed 3 times with distilled water and finally stained with lead aspartate solution (prepared by dissolving 0.066 g of lead nitrate in 10 ml 0.03 m aspartic acid, pH 5.5) at 60°C for 30 min and washed again with distilled water 3 times. The samples were then dehydrated by dipping the samples twice (5 min each) in a gradient series of freshly-prepared solutions of 50, 75, 85, 95, and 100% ethanol, and finally by placing in anhydrous acetone for 10 min at room temperature. The samples were then transferred to freshly-made 50% Epon resin in propylene prepared by mixing 5ml propylene with 5ml of 100% Epon resin formulated as 10 ml EMBed-812, 8 ml dodecenyl succinic anhydride, 4 ml methyl-5-norbornene-2,3-dicarboxylic anhydride, and 0.4 ml 2,4,6-tri (dimethylaminomethyl)-phenol. After incubating for 2h at room temperature in 50% Epon, the samples were transferred to 100% Epon and rotated for 90 min. Finally, the samples were placed into molds and fresh Epon resin was poured and kept at 60°C for 2 days for polymerization and solidification.
A sample block of 0.5 × 0.5 × 0.5 mm size for each hippocampal tissue was prepared by trimming the resin using a razor blade. Each sample block was mounted on a pin and was then set on the stage of a Zeiss Sigma VP scanning electron microscope equipped with a Gatan 3View in-chamber ultramicrotome and a low kilovolt backscattered electron detector. The diamond knife of the microscope was set to make ~500 sections at a thickness of 70 nm. Images were generated at 2.0–2.25 kV under standard vacuum conditions using an aperture set at 30 μm and captured at 5 nm/pixel resolution (5000× magnification).
Measuring the distance of dystrophic neurites from the center of amyloid plaques
Image sets were registered using the Fiji (ImageJ) plugin for linear alignment with SIFT 31. The components of neuritic plaques such as central β-amyloid cores, different populations of DNs, microglia, and astrocytes were labeled through the image stacks containing images of ~250 sections that were obtained from hippocampal samples. According to the ultrastructural morphology, DN populations were categorized as small vesicles, large vesicles, and ER clusters. Using Fiji (ImageJ) software, the distance of individual DN locations was measured from the center of the β-amyloid core in each population. An average and standard error were calculated for each DN population in each neuritic plaque.
3D Reconstruction of neuritic plaques
Registered image sets were analyzed using Reconstruct software 32. The properties of each image set were entered manually as 70 nm slice thickness and 5nm pixel size. Areas for amyloid plaques, small vesicles, large vesicles, ER-mitochondria cluster inclusions, axons, dendrites, synapses, etc., were traced by manual tracing. Each trace with the same name is considered as one object by the software. After tracing each morphology (e.g., amyloid plaque, DN, ER cluster, axon, dendrite, synapse), a 3D model for each object was generated. The series of 3D animated files were saved as tiff image stacks, which were then concatenated to make 3D movies. To show the layered appearance among the 3D structures on different types of DNs, a circle was drawn by taking a radius equal to the average distances of each DN population. Three circles were drawn for the average distances of small vesicles, ER-mitochondria cluster inclusions, and large vesicles to the center of the amyloid-deposited plaque core.
Immuno-electron microscopy (Immuno-EM)
A six-month-old non-transgenic (C57Bl6/SJL) mouse and a 5XFAD mouse of the same age were anesthetized by interperitoneal injection of 50 μl pentobarbital and transcardially perfused with 70 ml of ice-cold fixative (4% paraformaldehyde and 0.05% glutaraldehyde). Brains were removed and placed in ice-cold fixative at 4°C overnight. The following day, the brains were washed 3 times in PBS and cut into 250 μm coronal sections on a vibratome. After washing in PBS 3 times (5 min each), the sections were incubated in blocking solution (5% goat serum and 1% BSA) for 30 min, followed by primary antibody treatment overnight at 4°C.
The monoclonal primary antibodies against ATG9A (Abcam Cat# ab108338, RRID: AB_10863880), LC3B (Abcam Cat# ab192890), and RTN3 (recently developed in the Yan lab) were diluted with blocking buffer. Brain sections were washed 3 times (5 min each) and incubated in Nanogold-Fab anti-rabbit secondary antibody (Nanoprobe) at 1:100 in 1% instant non-fat milk in PBS for 2h at room temperature. After washing with PBS 3 times (5 min each), the sections were then incubated in Nanogold enhancement mixture for 10 min and washed with dH2O 8 times (5 min each). The samples were then fixed with 1% glutaraldehyde for 1h and rinsed 3 times with dH2O and stained in 1%OsO4, 0.8%Ferricyanide in 0.1M cacodylate buffer for 30 min. After washing 3 times with dH2O (5 min each), the samples were stained with 1 % aqueous uranyl acetate for 30 min. Next, the sections were dehydrated in graded ethanol of 50%, 75%, 85%, 95% and 100% (three times) for 10 min each, and then in propylene oxide for 5 min. The samples were then infiltrated, first in 1:1, followed by 3:1 Epon resin: propylene oxide overnight at room temperature. The samples were transferred to 100% Epon and rotated for 90 min. Finally, the samples were placed into molds, and fresh Epon resin was poured and kept at 60°C for 2 days for polymerization and solidification. Next, the region of interest of the solidified samples was trimmed, and ultrathin sections were cut with a diamond knife and placed onto the formvar-coated grid. The sample grid was imaged under a Hitachi H-7650 electron microscope at a magnification of 3000-20,000x.
Results
Autophagy and endosomal proteins in DNs
To explore how DNs are formed, we aimed to identify molecular constituents of DNs by focusing on the proteins that are involved in autophagy-lysosomal degradation pathways 18,25,27. We used fixed brains from two AD mouse models: the 5xFAD mouse model that starts developing amyloid plaques at ~2 months of age, and the APP/PS1ΔE9 mouse model (abbreviated as the PA mouse), which develops amyloid plaques at ~6 months of age. First, we stained the brain sections of a four-month-old 5xFAD mouse to detect RIDNs using our newly-developed RTN3 monoclonal antibody. RIDNs were readily detected in encircling amyloid plaques (Fig. 1a and Supplemental Fig. 1). Co-staining RIDNs with a tubular ER protein-specific antibody, anti-REEP5, showed complete co-localization of REEP5 in RIDNs, while the ER sheet protein CLIMP63 was excluded from RIDNs in 5xFAD mouse brains. These results confirmed our previous findings that formation of RIDNs is due to impaired distribution of tubular ER 14.
Fig. 1. Labeling RIDNs and DNs in 5xFAD mice brain using tubular ER-, autophagy-, and endosomal protein-specific antibodies.
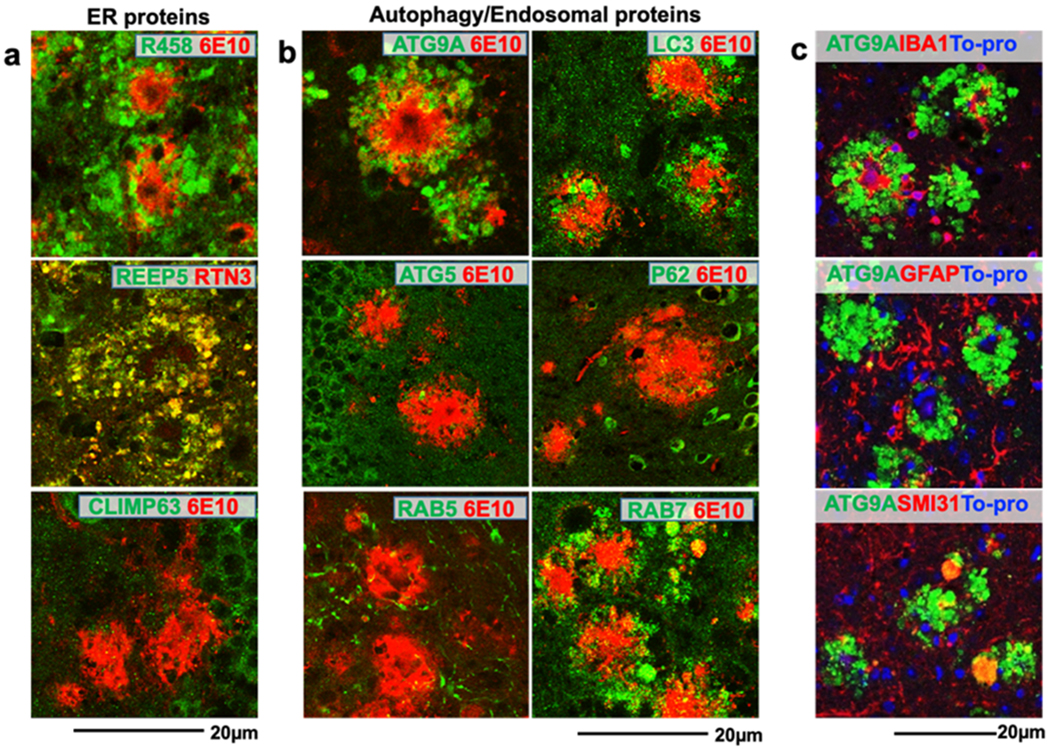
Fixed sections of a 5xFAD mouse brain (4 months old) were co-stained with antibodies against ß-amyloid plaque (6E10) or RTN3 and ER tubules (RTN3 and REEP5) or sheet (CLIMP63) proteins (a); with 6E10 and antibodies against autophagy proteins (ATG9A, LC3, ATG5, and p62) or endosomal proteins (RAB5 and RAB7) (b); with antibodies against ATG9A and microglia (IBA1), astrocytes (GFAP) or neurofilament (SMI31) markers (c). ATG9A co-localized with SMI31, but not with microglial or astrocytic markers.
To understand whether tubular ER mediates autophagy-lysosomal pathways in forming DNs, we screened a panel of proteins in this system. Proteins such as ATG5, ATG7, ATG9, ATG12, ATG13, ATG14L (barkor), ATG16L, WIP II (ATG18), Beclin 1, LC3, p62, PI3K class III, PI3K subunit 4, ULK1, UVRAG, RAB5, and RAB7 have been shown to actively participate in the formation of pre-autophagosomes, as well as the maturation of autophagosomes and their fusions with lysosomes 33. We found that an early autophagy protein, ATG9A, strongly labeled DNs in surrounding amyloid plaques present in 5xFAD mouse brains (Fig. 1b, split channel shown in Supplemental Fig. 1).
ATG9A is a vesicle membrane protein initiating the formation and elongation of autophagosomes 34,35. This initiation step requires ATG9A to form pre-autophagosomes with ULK1 and ATG13 at tubulovesicular regions of ER 36. Interestingly, both ULK1 and ATG13 did not label DNs using multiple commercially-available antibodies (Supplemental Fig. 2), implying that ATG9A is perhaps trapped in DNs prior to its normal functional organization that initiates formation of pre-autophagosomes. We showed that ATG9A in DNs appeared to be derived from neurons rather than from microglia or astrocytes, as ATG9+ DNs did not overlap with GFAP- or IBA1-labeled cells (Fig. 1c). Among over twenty other autophagy proteins, only LC3 clearly labeled DNs (Fig. 1b, split channel shown in Supplemental Fig. 1), but not typical autophagosome proteins such as P62 or ATG5 (Fig. 1b). A late endosomal protein RAB7, which participates in the final maturation of late autophagic vacuoles 37, also labeled DNs (Fig. 1b, split channel shown in Supplemental Fig. 1). The early endosomal protein RAB5 was not present in DNs. Hence, our results show that only a few autophagy proteins were abundantly accumulated in DNs of 5xFAD mouse brains.
Different layers of DNs in surrounding amyloid plaques
To understand how the aforementioned proteins are involved in forming DNs during the growth of amyloid plaques, we examined DNs at different ages (postnatal day 75 [P75], P120, and P300) of 5xFAD mouse brains. By exploring the chronological development of DNs abundantly labeled by ATG9A, RAB7, and LC3, we also compared their distributions to RIDN formation by double labeling experiments with RTN3 antibodies. We found that ATG9A antibody labeled DNs surrounding every plaque detectable in P75 5xFAD mouse brains, even when the plaque was at the initial nadir stage (Fig. 2a), suggesting that it is involved in the early stages of DN formation. With the growth of plaque size, more and larger ATG9A-positive DNs were seen in surrounding amyloid plaques (Fig. 2b–c).
Fig. 2. Chronological development of plaques surrounding RIDNs and DNs in the brains of 5xFAD mice.
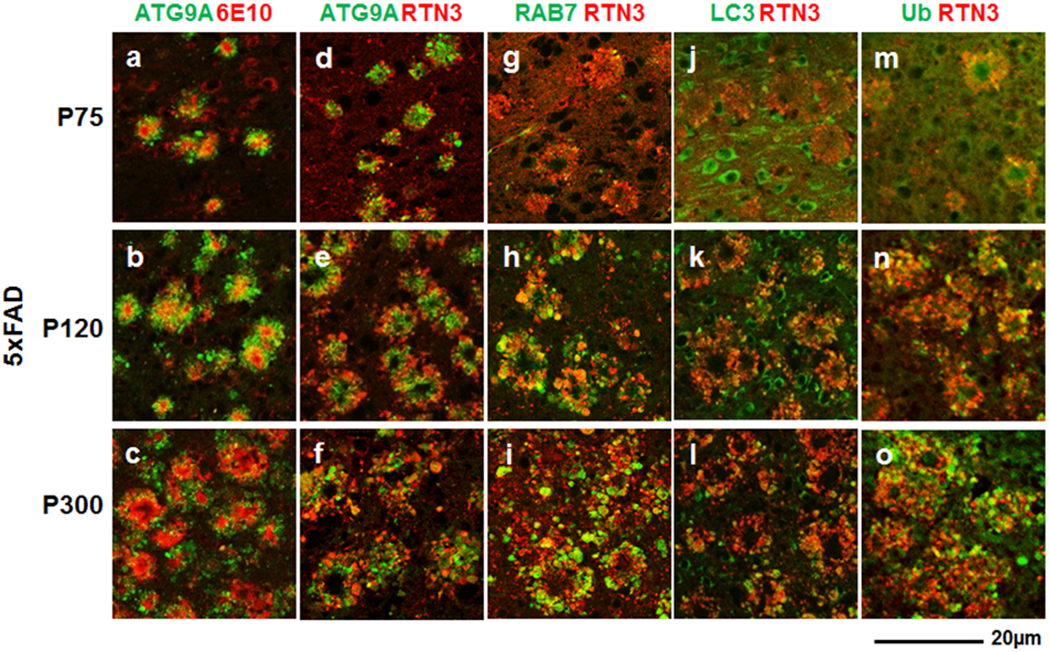
Fixed brain sections from postnatal day 75 (P75, upper row), 120 (P120, middle row) and 300 (P300, lower row) 5xFAD mice were double-labeled with antibodies against ß-amyloid plaque (6E10) and ATG9A (a-c), RTN3 and ATG9A (d-f), RTN3 and RAB7 (g-i), RTN3 and LC3 (j-l), or RTN3 and Ub (m-o). Only ATG9A antibody labeled DNs at early stages of plaque development in 5xFAD mice, when RIDNs are also formed. DNs labeled by LC3, RAB7, and Ub developed at later stages of plaque growth and were located at the outer periphery of RIDNs, which were clearly visible at P300.
RIDNs were formed concomitantly when compared with ATG9A-positive DNs, as RIDNs were also present in seeding amyloid plaques. One remarkable finding was that RIDNs appeared to encircle ATG9A+ DNs, and both populations of DNs had little overlap in P75 5xFAD mouse brains (Fig. 2d and Supplemental Fig. 3a). When amyloid plaques grew larger at older ages, more RIDNs were found in surrounding ATG9A+ DNs, and some overlap in these two populations of DNs became evident (Fig. 2e–f and Supplemental Fig. 3a).
The DN population labeled by RAB7 was significantly less in P75 5xFAD mouse brains when compared to RIDNs or ATG9A+ DNs in young 5xFAD mouse brains (Fig. 2g and Supplemental Fig. 3b). The RAB7+ DNs grew more at P120 and P300 (Fig. 2h–i and Supplemental Fig. 3b). LC3+ DNs had similar patterns to RAB7+ DNs (Fig. 2j–l). A closer examination showed that both RAB7+ and LC3+ DNs were positioned largely in the outer periphery of the RIDN layer (see Fig. 2i and l). We also noticed similar development and distribution patterns for ubiquitin+ DNs (Fig. 2m–o): very few in P75 5xFAD mouse brains and more in P300 brains, when plaques were also larger. Ubiquitin+ DNs were also located in the outer layer of RIDNs, similar to RAB7+ and LC3+ DNs. Likely, the formation of these three DNs were late events during plaque growth.
Our observations suggest that DNs labeled by different proteins began to form at different time points during plaque development. Both ATG9A+ DNs and RIDNs were formed as long as plaques were visible, representing early stages of DN formation, with RIDNs being located mostly at the outer layer of ATG9A+ DNs. The late autophagy proteins LC3 and RAB7, as well as ubiquitin, were all entrapped in DNs that were mainly at the outer layer of RIDNs, indicating that at least three types of DNs were formed to encircle the core plaques in 5xFAD mouse brains.
To confirm this pattern of DN formation, we similarly examined brains from PA mice 38. Amyloid plaques were readily detected in P180 PA mouse brains. ATG9A+ DNs were detected surrounding even small plaques (Fig. 3a, Supplemental Fig. 3c and supplemental video 1a). At this age, RIDNs were also found surrounding both large and small plaques (Fig. 3b and supplemental video 1b). RAB7, ubiquitin, and LC3 antibodies appeared to label DNs near mainly large plaques (Fig. 3c–e and supplemental video 1c–d). Similar to that observed in 5xFAD brains, RIDNs were distributed in outer layers of ATG9A+ DNs, while RAB7+ and LC3+ DNs were sparser and often located outside of RIDNs (Fig. 3f–i). Altogether, three layers of DNs were found in two different AD models that develop amyloid plaques.
Fig. 3. Labeling RIDNs and DNs with autophagy proteins, and their layer constitution during initial plaque formation in PA mice.
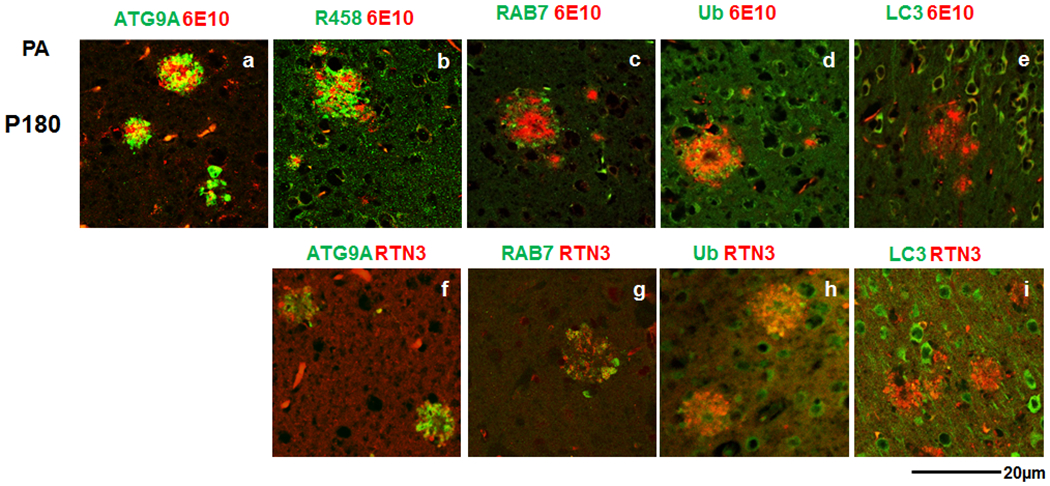
Brain sections from 6-month-old APP/PS1delE9 (PA) mice were co-stained with 6E10 antibody and antibodies specific to ATG9A (a), RTN3 (b), RAB7 (c), Ub (d), or LC3 (e). Fixed brain sections of PA mice at the same age were double-labeled with RTN3 and ATG9A- (f), RAB7- (g), Ub-, (h) or LC3- (i) specific antibodies. ATG9A-labeled DNs and RIDNs appeared in both smaller and larger plaques in 6-month-old PA mouse brain, while RAB7 and Ub antibodies stained DNs only at larger plaques. LC3 antibody rarely stained any DNs at this age. A sequential layer constitution by ATG9A, RIDNs, and RAB7/Ub, respectively, was noticeable in this AD mouse brain.
We also observed sparse microglial accumulation near the plaque in P180 PA mouse brain when ATG9A-labeled DNs also formed (Supplemental Fig. 3d). Despite this observation, the role of microglia in DN formation during plaque initiation and subsequent plaque growth remains to be determined.
Ultrastructural differences of DNs and their distributions
We previously showed that ER tubules are abnormally accumulated in RIDNs in AD human biopsy samples and in AD mouse brains 14. Here, our immuno-confocal study showed that DNs labeled by ATG9A and those stained by RAB7 and LC3 antibodies were mostly localized in the inner or outer layer of RIDNs, respectively (Fig. 1 and Fig. 2). ATG9A is a vesicle protein that functions as a membrane source during the initial steps of autophagy induction 35,39, while LC3 and RAB7 are autophagy vesicle proteins involved in later stages of the autophagy process, such as elongation of autophagosomes and the maturation of autophagosomes to amphisomes 33. Their presence in DNs is consistent with notion that multi-vesicle bodies are likely formed from autophagosomes and autolysosomes in swollen neurites 18,23,27.
To gain insight into the ultra-structural diversity of DNs and their distributions, we first utilized two-dimensional (2D) EM studies to examine the hippocampal region of 10-month-old 5xFAD mouse brains. Consistent with previous observations, multiple types of DN-like inclusions were clearly distributed around amyloid plaques (see example in Fig. 4a). Based on their sizes and morphologies, these DN inclusions could also be classified into three types. The type I DNs contained mainly small vesicles ranging from 40 to100 nm in diameter and were often located near amyloid plaques (Fig. 4b–c). The type II DNs contained larger vesicles ranging from 200 to 400 nm in diameter, and double membrane vesicles were visible containing dense material (Fig. 4a and 4d). Type III DNs were inclusion bodies filled with dense mitochondria and ER tubule-like structures (Fig. 4a and 4e).
Fig. 4: Ultra structural morphology of different types of amyloid plaques surrounding DNs and RIDNs in 5xFAD mice brain.
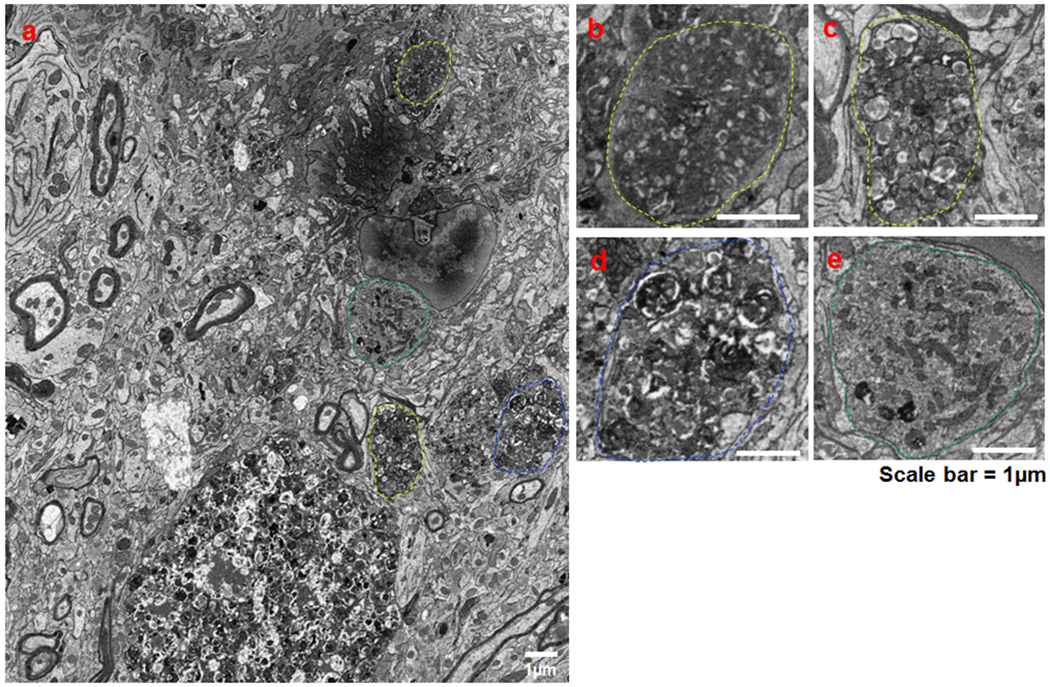
Fixed brain samples from 10-month-old 5xFAD mice were subjected to 2D electron microscopy (2D EM). A low magnification image showing an amyloid plaque surrounded by diversified multi-vesicular DNs (indicated by encircled yellow and blue dashed line) and clustered ER tubule-mitochondria like inclusion bodies (indicated by green dashed line) (a). Three morphologically-different types of DNs are shown in enlarged pictures such as small vesicles or type I DNs (b-c), large double-membrane vesicles or type II DNs (d), and clustered tubular ER-mitochondria inclusion body or type III DNs/RIDNs (e). The small vesicles are morphologically similar to ATG9A vesicles (Orsi et al., 2012). The larger double-membrane vesicles and large multi-vesicles are likely to be defective or undegraded autophagosomes. Scale bar indicates 1μM.
In correlating with our confocal results, type I DNs are likely positive for ATG9A, as these small vesicles match previously-described pre-autophagosomes 40. To confirm this speculation, we conducted immune-EM with ATG9A monoclonal antibody using 6-month-old wild-type (WT) and 5xFAD mice brain samples. In WT mouse brain, ATG9A was normally localized near the tubular ER, mitochondrial edge, a single vesicle, and “ATG9A reservoir”-like tubule-vesicle structures (indicated by green, red and white arrowheads, respectively, in Fig 5a), suggesting the possibility of ATG9A localization on tubular ER and mitochondria-associated-ER membrane (MAM). We also observed clear staining of ATG9A near the trans-Golgi network (TGN) (yellow arrowheads in Supplemental Fig. 4a). In 5xFAD mouse brains, ATG9A was clearly labeled in inclusions of small-sized vesicles surrounding an amyloid plaque core (Figure 5b and Supplemental Fig. 4b–c), while ATG9A was rarely detected in large double-membrane autophagosomes (Figure 5b and Supplemental Fig. 4d), supporting the role of ATG9A in the formation of type I DNs.
Fig. 5. Immunogold labeling of DNs with ATG9A, LAC3 and RTN3 antibodies.
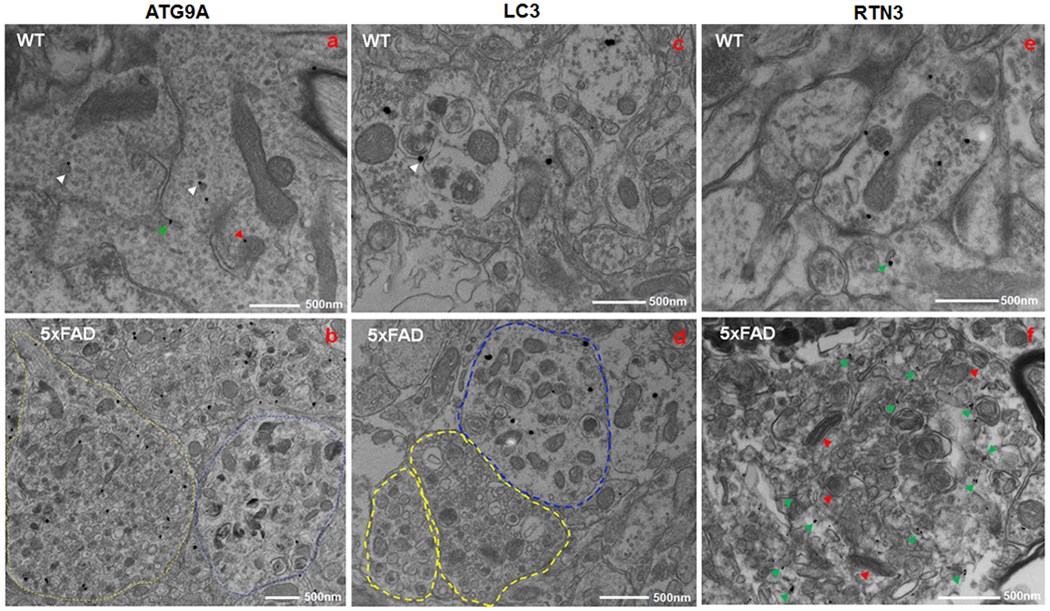
Fixed brain samples of a 6-month-old wild type (WT) (a, c and e) and a 5xFAD (b, d and f) mouse were subjected to immune-EM examination. ATG9A antibody labeled several vesicles (white arrowhead), ER tubules (green arrowhead), and mitochondrial edge (red arrowhead) in WT mouse brain (a). In 5xFAD mouse brain, ATG9A antibody stained a multi-vesicle body with small vesicles (type I DN- indicated by yellow circle), while large double membrane vesicles (type II DN- encircled in blue) were rarely detected by ATG9A antibody (b). A monoclonal antibody specific to LC3B stained isolated vesicles, styptic vesicles, and auto-lysosome-like structures (showed by white arrowhead) in a neurite in WT mouse brain (c). In 5xFAD mouse brain, LC3 localization was limited to type II DNs (d). In WT mice brain, RTN3 antibody labeled the mitochondrial edge, synaptic vesicles, and ER tubules (shown by green arrowhead) in a neurite (e). In 5xFAD mouse brain, RTN3 antibody stained tubular ER in a mitochondria (indicated by red arrowhead) – ER clustered inclusion (f).
Type II DNs (example shown in Fig. 4d) were visibly enriched with double-membrane vesicles, matching previously-reported late autophagosomes and autolysosomes in both AD mouse models and AD human postmortem brains 25,27. To confirm these autophagy vesicles, we performed immuno-EM study on WT and 5xFAD mouse brains using a well-known autophagosome marker, the LC3-specific antibody LC3B (Fig. 5c–d). In 6-month-old WT mouse brain, LC3B was localized at vesicles, synapses, and on the autolysosomal structure in a neurite (shown by white arrowhead in Fig. 5c). In 5xFAD mouse brains, LC3B was limited to being localized in only large vesicle-containing inclusions (indicated by the blue dashed circle in Fig. 5d). LC3B was excluded in inclusions enriched with small vesicles in 5xFAD mouse brain (indicated by the yellow dashed circle in Fig. 5d). These data strongly support the concept that type II DNs are constituted with autophagy vesicles. The morphology of type III DNs (Fig. 4e) resembled our previously-described RIDNs 14, in which tubular ER and degenerated mitochondria were common. We confirmed these ER tubule- and mitochondria-enriched inclusions by immuno-EM (Fig. 5e–f). Staining WT mouse brain with RTN3 monoclonal antibody revealed the localization of RTN3 in tubules, including those near mitochondria and synaptic vesicles (indicated by the green arrow in Fig. 5e). In 5xFAD mouse brain, robust staining of RTN3 antibody was found in ER tubule-clustered inclusions (indicated by the green arrow in Fig. 5f), where degenerative mitochondria also existed (indicated by the red arrow in Fig. 5f). These results confirmed that mitochondria-ER clusters contained inclusions consisting of RIDNs, or type III DNs. A 3D reconstructed structure of such an inclusion also confirmed the enrichment of tubular ER (Supplemental Fig. 5a–b).
3D EM images of DNs and their surrounding plaques
We noted that DNs with clustered ER tubules in 2D EM images were fewer when compared to the abundance of confocally-stained RIDNs by RTN3 antibodies using fixed 5xFAD mouse brains (Fig. 1 and Fig. 4). This discrepancy led us to examine whether fragmented tubular ER exists in different DNs. To this end, we further conducted 3D EM to explore a link between ER tubules and the formation of vesicles during DN formation using fixed 5xFAD mouse brains. This 3D EM method would also allow us to compare how different populations of DNs are distributed along a plaque. As shown in an image of a 3D EM serial section from 10-month-old 5xFAD mouse brain hippocampus (Fig. 6a, supplemental video 2), ER tubules were often found to link with various vesicles in inclusions. In an enlarged view of this EM micrograph, multibody vesicles and tubular ER were found next to the dense synaptic vesicles of an axonal terminus (Fig. 6b); vesicles, indicated by blue arrows, were clearly connected with ER tubules, indicated by green arrows. Using reconstruct software 32, we depicted areas of different vesicle bundles, inclusions, tubular ER, synapse regions, axons, and dendrites in different colors as illustrated in Fig. 6c. Tubular ER was clearly inter-connected with different vesicles near axonal terminals, indicating that tubular ER likely functions as a bridge between different vesicles. Our 3D reconstructed electron micrographs of DNs from serial sections also revealed ER tubules in an inclusion body containing the clustering of tubules (Supplemental Fig. 5a–b and supplemental video 3). Interestingly, our immune-EM results show clear staining of ER tubules by RTN3 antibody in an inclusion containing autophagy vesicles (indicated by green arrows in Fig. 6d), confirming that clustered ER tubules also exist in autophagosomes containing inclusions, i.e., type II DNs. Likely, these ER tubules became abnormally organized when multibody vesicles were not functional at some point. A 3D reconstruction of such a compartment containing tubules and vesicles in an axon depicted an association of ER tubules with vesicles (Fig. 6c, supplemental video 2).
Fig 6. Link between ER tubules and multi-vesicles in axons of 5xFAD mouse brain.
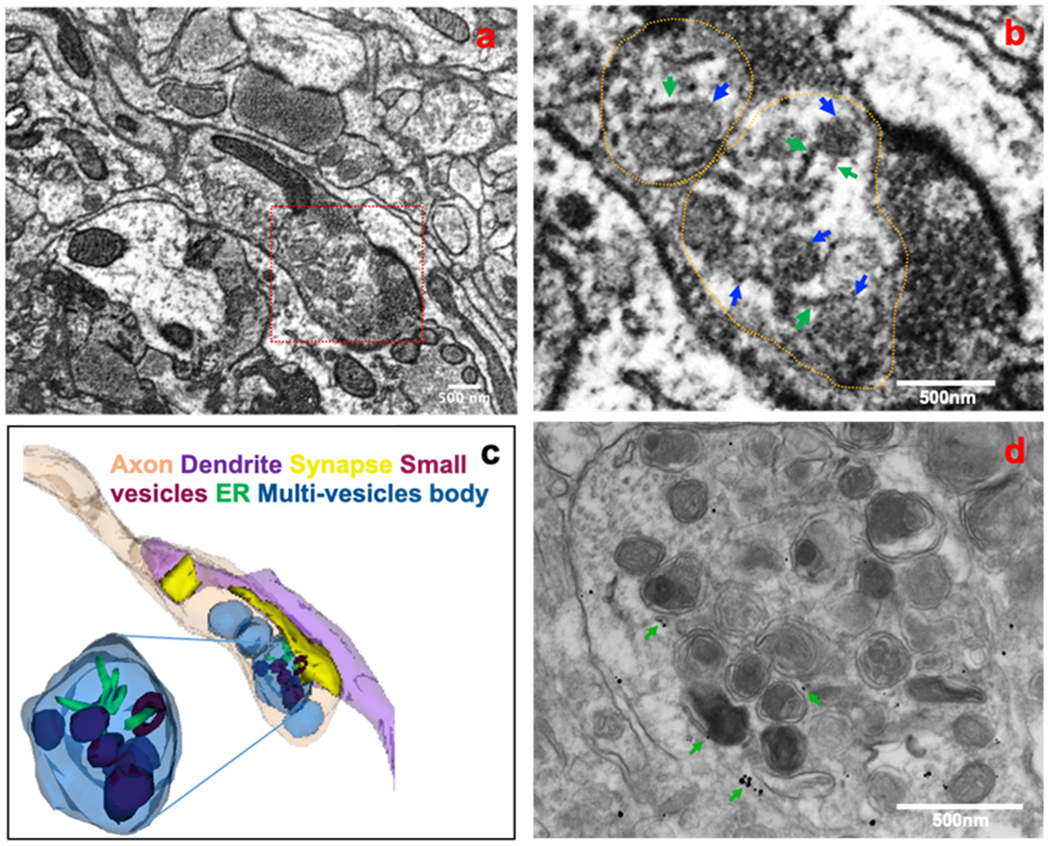
A fixed brain sample from a 5xFAD mouse was subjected to 3D electron microscopy (3D EM). An electron micrograph of a 3D EM image stack shows a link between ER tubules and vesicles during the formation of multi-vesicle bodies in an axonal terminal (a). Association of ER tubules (green arrows) with vesicles (green arrows) in forming a multi-vesicle body is shown in the enlarged view (b). A 3D structure of tubular and vesicular association in a multi-vesicle body was reconstructed from the 3D EM images (c). The reconstructed model shows that ER tubules and vesicles are localized in the same multi-vesicle body and that they associated with each other at some point. Some vesicles (actual brown color) appeared as blue or deep blue in multi-vesicle bodies due to overlay. Immunogold labeling of a 6-month-old 5xFAD mouse brain showing RTN3-labeled ER tubules (indicated by green arrows) in a multi-vesicle body predominantly filled with autophagy vesicles (d). Many of those ER tubules were associated with the vesicles.
To compare the distributions of different DNs, we measured the average distances between the center of each DN-inclusion and the center of each plaque by analyzing 225 3D EM images in which both amyloid plaques and DNs could be detected. An example of such a measurement is shown in Fig. 7a, where types I, II, and III DNs are indicated in yellow, blue, and green, respectively. The average distance of type I small vesicle-enriched DNs from the center point of the plaque was 5.60±1.91 μM (N=1410). The type II DNs enriched with large heterogenous and undegraded autophagy vesicles were more differentially distributed from the center of the plaque, with an average of 8.90±2.27 μM (N=1260). The type III tubular ER-enriched RIDNs had a radius of 7.26±0.98 μM (N=321). These quantification data suggest that the majority of type I DNs are localized in closer proximity to the plaque core compare to other types of DNs found in 5xFAD mouse brain. In addition, low-magnified EM images obtained from a PA mouse also showed a similar distribution of smaller and larger vesicles containing inclusions, with small vesicles being mostly located close to the plaque center and larger vesicles being mostly distributed further from the core of the plaque (Supplemental Fig. 6).
Fig. 7. Reconstructed 3D structures of three types of DNs and their layer organization in 5xFAD mice brain.
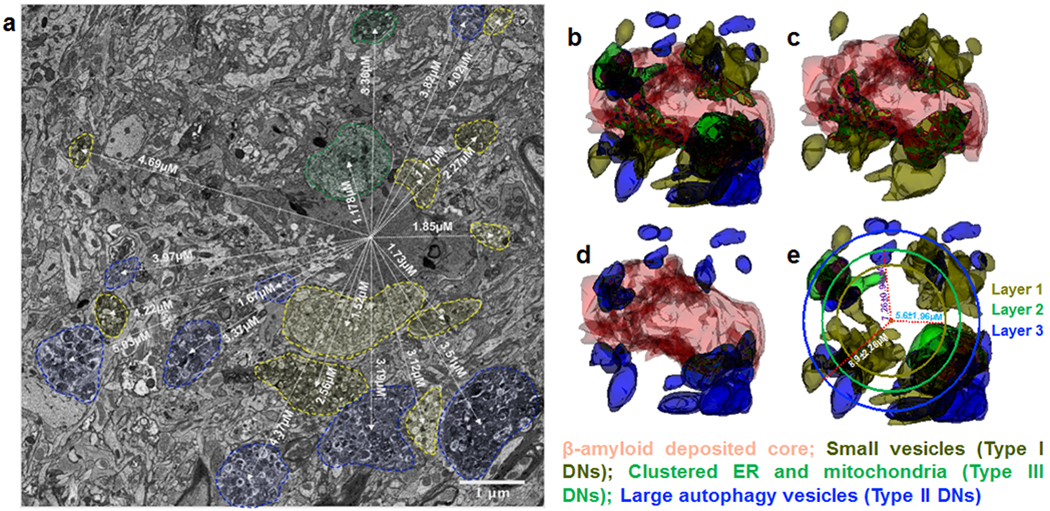
A 3D structure of a whole plaque was reconstructed through a stack of 225 images from a 10-month-old 5xFAD mouse brain using Reconstruct software. (a) Small vesicles (type I DNs), large double-membrane vesicles (type II DNs), and ER tubule-mitochondria inclusions (type III DN/RIDNs) are encircled by yellow, blue, and green dashed lines, respectively, and their measured distances from the center of the amyloid core are shown on a single electron micrograph of a 3D EM image stack. (b) The 3D structures show the distribution of the three types of DNs, including many small vesicles (type I DNs) embedded in the amyloid core (c) and larger vesicles (type II DNs) being located further from the core (d) compare to type I DNs. A circle was drawn for each type of DN and their calculated average distances from the center of the amyloid core is shown (e). The 3D reconstructed structure shows amyloid core-encircling DNs are constituted in three sequential layers, in which the first layer is established with type I DNs (small vesicles), followed by a second layer with type III (clustered tubular ER), and finally a third layer with type II (defective autophagy vesicles) DNs.
To show the organization of DNs surrounding a plaque, we also reconstructed amyloid core plaques and three types of DNs according to their localizations from a stack of over 500 images (70 nm each), which were captured by 3D EM from a 10-month-old 5xFAD mouse brain. In Fig. 7b, a large amyloid core plaque, which was detected in more than 200 continuous images, exhibited an irregular rotunda shape (indicated in orange in Fig. 7b, supplemental video 4). Different types of DNs were mostly localized in the peripheral side of this rotunda. However, 3D images also revealed that some DNs were buried inside the amyloid plaque, implying that growth of amyloid plaques and DNs could be simultaneous, and that DNs likely began to grow on top of a plaque nadir. Among different DNs, only type I DNs were predominantly embedded within the amyloid core (Fig. 7c), implying that DNs containing homogenous sizes of small vesicles might begin to form first. Type II DNs usually were not directly touching the amyloid core surface as illustrated in the 3D reconstructed structure (Fig. 7d). Instead, this type of DN was predominantly localized at the edge of a plaque core or clustered at the middle of the elongated plaque. Type III DNs were not usually embedded within the core. While not the focus in this study, processes of microglia were also seen in contact with a plaque and they were found to be closely associated from one end to the other of the rotunda-shaped amyloid core in a 3D reconstructed structure (Supplemental Fig. 7), which facilitates the growth of DNs. The role of microglia in DNs will be investigated in a separate study.
Discussion
The presence of DNs is recognized as one of the hallmark pathological features of AD, but it is not fully understood as to how DNs are formed. By monitoring amyloid deposition in AD mouse models, we demonstrated that formation of DNs occurs as long as amyloid plaques begin to form. We showed that both ATG9A and RTN3 were involved the formation of DNs in the beginning stages of amyloid deposition, and that these two proteins are entrapped in two different types of DNs. DNs enriched with LC3 or RAB7 in autophagosomes-lysosomes appeared when amyloid plaques were relative larger. Our results show that at least three types of DNs are formed surrounding amyloid plaques in AD mouse models and that amyloid deposition is a triggering factor.
How ATG9A is involved in forming DNs in response to insults from amyloid plaques is intriguing. ATG9 is a multi-spanning transmembrane protein, initially identified in yeast as having a role in initiating the formation of pre-autophagosomes, which eventually fused to the outer membrane of double autophagosome membranes during maturation 35,39. In yeast cells, ATG9 is normally localized onto cytoplasmic mobile vesicles (also called ATG9 vesicles), which are derived from the Golgi apparatus in a process involving ATG23 and ATG27. ATG9 vesicles are also called “ATG9 reservoirs”, recognized as the bundles of vesicles and tubules in yeast 16,34,35,41. In mammalian genomes, two ATG9 orthologs are identified: ATG9A and ATG9B. ATG9A is ubiquitously expressed in most tissues including the brain, while ATG9B is mainly expressed in the placenta and pituitary gland 42. In healthy mammalian cells, ATG9A is localized on the TGN, endosomes, and in reservoir-like vesicular-tubular structures near Golgi and endosomes; ATG9A vesicles dynamically traffic between TGN and endosomes 40,43,44. However, upon induction of autophagy, they redistribute and a portion of ATG9A reservoirs become associated with precursors of autophagosomes to deliver membrane for the formation of autophagosomes 40,44. Abnormal accumulation of ATG9A reservoirs or vesicles in recycling endosomes occurs when ATG9A trafficking is impaired 45. In highly-polarized neurons, the recycling endosomes are differentially distributed, with preferential occurrence in axons 46. In relation to the role of ATG9A in forming DNs, it is likely that toxic oligomeric Aβ impairs recycling of ATG9A vesicles between soma and axons. Consequently, the resulting accumulation of ATG9A vesicles in axon terminal regions causes axonal swellings, which were seen in the early stages of plaque growth. How Aβ impairs recycling of ATG9A vesicles remains to be investigated. Prior studies identified defective axonal transport in AD brain by toxic Aβ 47–49, and this might lead to defective trafficking of ATG9A vesicles.
Axonal swelling might have facilitated the growth of amyloid plaques, because ATG9A-containing DNs were imbedded within amyloid plaques. Likely, clearance of Aβ was suppressed due to congestion caused by mis-trafficking, and eventually the supply of ATG9A reservoirs to feed membranes of autophagosomes was disrupted. It is understood that functional autophagosomes are required for continuing autophagy efflux to clear Aβ aggregates 16,36,50,51. The accumulation of autophagic vesicles in the swelled axons, as observed previously 23–25, is likely related to DNs labeled by RAB7 and LC3. The impaired autophagic functions and axonal integrity likely result from defective ATG9A recycling, and this is consistent with the reported role of ATG9A in forming functional autophagosomes 45,52,53. Hence, abnormal accumulation of ATG9A vesicles in DNs at early plaque-forming stages can contribute to autophagy impairments in AD mouse brains and axonal degeneration during AD progression.
We have previously shown that RTN3 labeled abundant populations of DNs, which we termed as RIDNs 13. Transgenic mice overexpressing RTN3 develop RIDNs, which contained clustered tubular ER 14. In 5xFAD mouse brains, RIDNs were viewed as type III DNs and were relatively less abundant compared to type I and II DNs, but occurred at early stages of plaque development. From ultrastructural and immuno-EM examination, we found that fragments of tubular ER were connected to multibody vesicles (Fig. 6b and 6d), suggesting that tubular ER existed in different types of DNs in a non-clustered form in addition to the clustered form. Our immune-EM study confirmed that in addition to tubule-vesicular reservoirs, ATG9A could also associate with ER tubules (Fig. 5a). When a pool of ATG9A vesicles was stuck in the endosomal compartment, ATG9A was not available to associate with ER to initiate the formation of autophagy on demand from sources like TGN and the reservoir-like structure 36,43. Hence, types I and III DNs (RIDNs) are likely interconnected via the tubular ER.
Neuronal homeostasis is strictly maintained by spontaneous degradation of undesired cellular constituents by lysosomes, delivered by autophagy and endocytosis. Both of these essential cellular processes rely on the formation of double-membrane vesicles and multi-vesicle bodies. Involvement of the late autophagy proteins LC3 and RAB7, or ubiquitinylated proteins or other lysosomal proteins such as cathepsin D or E 18 in DN formation, appeared at later stages of plaque growth in AD brains, reflecting the accumulation of undegraded autophagy vesicles and multi-vesicle bodies in DNs. This process indicates that autophagic-lysosomal dysfunction is likely an end stage of neuritic dysfunction, which can disrupt axonal and synaptic functions.
In summary, comparing the immune-fluorescence data, 2D EM data, and 3D ultrastructural reconstruction data, we are able to divide DNs into three classes: those enriched with small ATG9A-vesicles, those in larger double-membrane vesicles, and those in defective ER tubules together with degenerated mitochondria (Supplemental Fig. 8). The cross-sectional view of a 3D reconstructed rotunda-shaped amyloid plaque reveals a predominant distribution pattern of each type of DN in encircling the amyloid core. We reveal the first time that accumulated small vesicles of possible ATG9A protein occurs first and likely grows concomitant with amyloid plaques (Fig. 7). The measured average distance of each type of DN from the center of the amyloid core clearly showed the constitution of three layers of DNs, with type I DNs located closest and type II DNs farthest from the core (Fig. 7e), implying that undegraded autophagy vesicles containing LC3, RAB7, and lysosomal proteins will occur after pre-autophagosomes failed to form. The tubulovesicular region of ER is known to mediate the formation of autophagosomes 36. In future studies, it is necessary to test whether preventing abnormal accumulation of ATG9A vesicles will block subsequent abnormal distribution of ER tubules to prevent impairment of autophagy and ubiquitin proteasome systems in AD brains.
Supplementary Material
Acknowledgements
We thank Dr. Graham Kidd (Cleveland Clinic Lerner Research Institute) for capturing 3D EM images and Dr. Maya Yankova (UConn Health EM core facility) for immune-EM. This work is partially supported by National Institute of Health (NIH) grants to RY (AG025493, NS074256, RFAG058261 and AG046929), and an award from the Alzheimer’s Association to Md Golam Sharoar (AARF-17-504724).
Footnotes
Conflicts of interest
The authors declare no conflicts of interest.
References
- 1.Braak H & Braak E Neuropathological stageing of Alzheimer-related changes. Acta Neuropathol 82, 239–259 (1991). [DOI] [PubMed] [Google Scholar]
- 2.Price JL & Morris JC Tangles and plaques in nondemented aging and “preclinical” Alzheimer’s disease. Ann Neurol 45, 358–368 (1999). [DOI] [PubMed] [Google Scholar]
- 3.Selkoe DJ Alzheimer’s disease is a synaptic failure. Science 298, 789–791, doi: 10.1126/science.1074069 (2002). [DOI] [PubMed] [Google Scholar]
- 4.Trojanowski JQ & Lee VM Brain degeneration linked to “fatal attractions” of proteins in Alzheimer’s disease and related disorders. J Alzheimers Dis 3, 117–119 (2001). [DOI] [PubMed] [Google Scholar]
- 5.Fukumoto H et al. Amyloid beta protein deposition in normal aging has the same characteristics as that in Alzheimer’s disease. Predominance of A beta 42(43) and association of A beta 40 with cored plaques. The American journal of pathology 148, 259–265 (1996). [PMC free article] [PubMed] [Google Scholar]
- 6.Joachim CL, Morris JH & Selkoe DJ Diffuse senile plaques occur commonly in the cerebellum in Alzheimer’s disease. The American journal of pathology 135, 309–319 (1989). [PMC free article] [PubMed] [Google Scholar]
- 7.Dickson DW et al. Ubiquitin immunoelectron microscopy of dystrophic neurites in cerebellar senile plaques of Alzheimer’s disease. Acta Neuropathol 79, 486–493 (1990). [DOI] [PubMed] [Google Scholar]
- 8.Lenders MB et al. Dystrophic neuropeptidergic neurites in senile plaques of Alzheimer’s disease precede formation of paired helical filaments. Acta neurologica Belgica 89, 279–285 (1989). [PubMed] [Google Scholar]
- 9.Onorato M et al. Alteration of neuritic cytoarchitecture in Alzheimer disease. Progress in clinical and biological research 317, 781–789 (1989). [PubMed] [Google Scholar]
- 10.Dickson TC, King CE, McCormack GH & Vickers JC Neurochemical diversity of dystrophic neurites in the early and late stages of Alzheimer’s disease. Exp Neurol 156, 100–110, doi:S0014-4886(98)97010-8 [pii] 10.1006/exnr.1998.7010 (1999). [DOI] [PubMed] [Google Scholar]
- 11.Masliah E et al. An antibody against phosphorylated neurofilaments identifies a subset of damaged association axons in Alzheimer’s disease. The American journal of pathology 142, 871–882 (1993). [PMC free article] [PubMed] [Google Scholar]
- 12.Vickers JC et al. Dystrophic neurite formation associated with age-related beta amyloid deposition in the neocortex: clues to the genesis of neurofibrillary pathology. Exp Neurol 141, 1–11, doi:S0014-4886(96)90133-8 [pii] 10.1006/exnr.1996.0133 (1996).1 [DOI] [PubMed] [Google Scholar]
- 13.Hu X et al. Transgenic mice overexpressing reticulon 3 develop neuritic abnormalities. EMBO J 26, 2755–2767, doi:7601707 [pii] 10.1038/sj.emboj.7601707 (2007). [DOI] [PMC free article] [PubMed] [Google Scholar]
- 14.Sharoar MG et al. Dysfunctional tubular endoplasmic reticulum constitutes a pathological feature of Alzheimer’s disease. Mol Psychiatry, doi: 10.1038/mp.2015.181 mp2015181 [pii] (2015). [DOI] [PMC free article] [PubMed] [Google Scholar]
- 15.Friedman JR, Webster BM, Mastronarde DN, Verhey KJ & Voeltz GK ER sliding dynamics and ER-mitochondrial contacts occur on acetylated microtubules. J Cell Biol 190, 363–375, doi: 10.1083/jcb.200911024 jcb.200911024 [pii] (2010). [DOI] [PMC free article] [PubMed] [Google Scholar]
- 16.Noda T Autophagy in the context of the cellular membrane-trafficking system: the enigma of Atg9 vesicles. Biochem Soc Trans 45, 1323–1331, doi: 10.1042/BST20170128 BST20170128 [pii] (2017). [DOI] [PMC free article] [PubMed] [Google Scholar]
- 17.Bordi M et al. Autophagy flux in CA1 neurons of Alzheimer hippocampus: Increased induction overburdens failing lysosomes to propel neuritic dystrophy. Autophagy 12, 2467–2483, doi: 10.1080/15548627.2016.1239003 (2016). [DOI] [PMC free article] [PubMed] [Google Scholar]
- 18.Lee S, Sato Y & Nixon RA Lysosomal proteolysis inhibition selectively disrupts axonal transport of degradative organelles and causes an Alzheimer’s-like axonal dystrophy. J Neurosci 31, 7817–7830, doi: 10.1523/JNEUROSCI.6412-10.2011 31/21/7817 [pii] (2011). [DOI] [PMC free article] [PubMed] [Google Scholar]
- 19.Klionsky DJ et al. A unified nomenclature for yeast autophagy-related genes. Dev Cell 5, 539–545, doi:S1534-5807(03)00296-X [pii] (2003). [DOI] [PubMed] [Google Scholar]
- 20.Mizushima N Autophagy: process and function. Genes Dev 21, 2861–2873, doi:21/22/2861 [pii] 10.1101/gad.1599207 (2007). [DOI] [PubMed] [Google Scholar]
- 21.Shintani T & Klionsky DJ Autophagy in health and disease: a double-edged sword. Science 306, 990–995, doi:306/5698/990 [pii] 10.1126/science.1099993 (2004). [DOI] [PMC free article] [PubMed] [Google Scholar]
- 22.Klionsky DJ Autophagy: from phenomenology to molecular understanding in less than a decade. Nat Rev Mol Cell Biol 8, 931–937, doi:nrm2245 [pii] 10.1038/nrm2245 (2007). [DOI] [PubMed] [Google Scholar]
- 23.Sadleir KR et al. Presynaptic dystrophic neurites surrounding amyloid plaques are sites of microtubule disruption, BACE1 elevation, and increased Abeta generation in Alzheimer’s disease. Acta Neuropathol 132, 235–256, doi: 10.1007/s00401-016-1558-9 10.1007/s00401-016-1558-9 [pii] (2016). [DOI] [PMC free article] [PubMed] [Google Scholar]
- 24.Tammineni P & Cai Q Defective retrograde transport impairs autophagic clearance in Alzheimer disease neurons. Autophagy 13, 982–984, doi: 10.1080/15548627.2017.1291114 (2017). [DOI] [PMC free article] [PubMed] [Google Scholar]
- 25.Sanchez-Varo R et al. Abnormal accumulation of autophagic vesicles correlates with axonal and synaptic pathology in young Alzheimer’s mice hippocampus. Acta Neuropathol 123, 53–70, doi: 10.1007/s00401-011-0896-x (2012). [DOI] [PMC free article] [PubMed] [Google Scholar]
- 26.Gowrishankar S et al. Massive accumulation of luminal protease-deficient axonal lysosomes at Alzheimer’s disease amyloid plaques. Proc Natl Acad Sci U S A 112, E3699–3708, doi: 10.1073/pnas.1510329112 1510329112 [pii] (2015). [DOI] [PMC free article] [PubMed] [Google Scholar]
- 27.Nixon RA et al. Extensive involvement of autophagy in Alzheimer disease: an immuno-electron microscopy study. Journal of neuropathology and experimental neurology 64, 113–122 (2005). [DOI] [PubMed] [Google Scholar]
- 28.Nixon RA Autophagy, amyloidogenesis and Alzheimer disease. Journal of cell science 120, 4081–4091, doi:120/23/4081 [pii] 10.1242/jcs.019265 (2007). [DOI] [PubMed] [Google Scholar]
- 29.He W et al. Reticulon family members modulate BACE1 activity and amyloid-beta peptide generation. Nat Med 10, 959–965, doi: 10.1038/nm1088 nm1088 [pii] (2004). [DOI] [PubMed] [Google Scholar]
- 30.Shi Q et al. Impact of RTN3 deficiency on expression of BACE1 and amyloid deposition. J Neurosci 34, 13954–13962, doi: 10.1523/JNEUROSCI.1588-14.2014 34/42/13954 [pii] (2014). [DOI] [PMC free article] [PubMed] [Google Scholar]
- 31.Schindelin J et al. Fiji: an open-source platform for biological-image analysis. Nat Methods 9, 676–682, doi: 10.1038/nmeth.2019 nmeth.2019 [pii] (2012). [DOI] [PMC free article] [PubMed] [Google Scholar]
- 32.Fiala JC & Harris KM Extending unbiased stereology of brain ultrastructure to three-dimensional volumes. J Am Med Inform Assoc 8, 1–16 (2001). [DOI] [PMC free article] [PubMed] [Google Scholar]
- 33.Parzych KR & Klionsky DJ An overview of autophagy: morphology, mechanism, and regulation. Antioxid Redox Signal 20, 460–473, doi: 10.1089/ars.2013.5371 (2014). [DOI] [PMC free article] [PubMed] [Google Scholar]
- 34.Mari M et al. An Atg9-containing compartment that functions in the early steps of autophagosome biogenesis. J Cell Biol 190, 1005–1022, doi: 10.1083/jcb.200912089 jcb.200912089 [pii] (2010). [DOI] [PMC free article] [PubMed] [Google Scholar]
- 35.Yamamoto H et al. Atg9 vesicles are an important membrane source during early steps of autophagosome formation. J Cell Biol 198, 219–233, doi: 10.1083/jcb.201202061 jcb.201202061 [pii] (2012). [DOI] [PMC free article] [PubMed] [Google Scholar]
- 36.Karanasios E et al. Autophagy initiation by ULK complex assembly on ER tubulovesicular regions marked by ATG9 vesicles. Nat Commun 7, 12420, doi: 10.1038/ncomms12420 ncomms12420 [pii] (2016). [DOI] [PMC free article] [PubMed] [Google Scholar]
- 37.Jager S et al. Role for Rab7 in maturation of late autophagic vacuoles. Journal of cell science 117, 4837–4848, doi: 10.1242/jcs.01370 jcs.01370 [pii] (2004). [DOI] [PubMed] [Google Scholar]
- 38.Borchelt DR et al. Familial Alzheimer’s disease-linked presenilin 1 variants elevate Abeta1–42/1–40 ratio in vitro and in vivo. Neuron 17, 1005–1013, doi:S0896-6273(00)80230-5 [pii] (1996). [DOI] [PubMed] [Google Scholar]
- 39.Feng Y & Klionsky DJ Autophagic membrane delivery through ATG9. Cell Res 27, 161–162, doi: 10.1038/cr.2017.4 cr20174 [pii] (2017). [DOI] [PMC free article] [PubMed] [Google Scholar]
- 40.Orsi A et al. Dynamic and transient interactions of Atg9 with autophagosomes, but not membrane integration, are required for autophagy. Mol Biol Cell 23, 1860–1873, doi: 10.1091/mbc.E11-09-0746 mbc.E11-09-0746 [pii] (2012). [DOI] [PMC free article] [PubMed] [Google Scholar]
- 41.Noda T et al. Apg9p/Cvt7p is an integral membrane protein required for transport vesicle formation in the Cvt and autophagy pathways. J Cell Biol 148, 465–480 (2000). [DOI] [PMC free article] [PubMed] [Google Scholar]
- 42.Yamada T et al. Endothelial nitric-oxide synthase antisense (NOS3AS) gene encodes an autophagy-related protein (APG9-like2) highly expressed in trophoblast. J Biol Chem 280, 18283–18290, doi:M413957200 [pii] 10.1074/jbc.M413957200 (2005). [DOI] [PubMed] [Google Scholar]
- 43.Reggiori F & Tooze SA Autophagy regulation through Atg9 traffic. J Cell Biol 198, 151–153, doi: 10.1083/jcb.201206119 jcb.201206119 [pii] (2012). [DOI] [PMC free article] [PubMed] [Google Scholar]
- 44.Young AR et al. Starvation and ULK1-dependent cycling of mammalian Atg9 between the TGN and endosomes. Journal of cell science 119, 3888–3900, doi:jcs.03172 [pii] 10.1242/jcs.03172 (2006). [DOI] [PubMed] [Google Scholar]
- 45.Imai K et al. Atg9A trafficking through the recycling endosomes is required for autophagosome formation. Journal of cell science 129, 3781–3791, doi:jcs.196196 [pii] 10.1242/jcs.196196 (2016). [DOI] [PubMed] [Google Scholar]
- 46.Rao A, Simmons D & Sorkin A Differential subcellular distribution of endosomal compartments and the dopamine transporter in dopaminergic neurons. Molecular and cellular neurosciences 46, 148–158, doi: 10.1016/j.mcn.2010.08.016 S1044-7431(10)00207-1 [pii] (2011). [DOI] [PMC free article] [PubMed] [Google Scholar]
- 47.Wang ZX, Tan L & Yu JT Axonal transport defects in Alzheimer’s disease. Mol Neurobiol 51, 1309–1321, doi: 10.1007/s12035-014-8810-x (2015). [DOI] [PubMed] [Google Scholar]
- 48.Morfini GA et al. Axonal transport defects in neurodegenerative diseases. J Neurosci 29, 12776–12786, doi: 10.1523/JNEUROSCI.3463-09.2009 29/41/12776 [pii] (2009). [DOI] [PMC free article] [PubMed] [Google Scholar]
- 49.Roy S, Zhang B, Lee VM & Trojanowski JQ Axonal transport defects: a common theme in neurodegenerative diseases. Acta Neuropathol 109, 5–13, doi: 10.1007/s00401-004-0952-x (2005). [DOI] [PubMed] [Google Scholar]
- 50.Reggiori F et al. Early stages of the secretory pathway, but not endosomes, are required for Cvt vesicle and autophagosome assembly in Saccharomyces cerevisiae. Mol Biol Cell 15, 2189–2204, doi: 10.1091/mbc.e03-07-0479 E03-07-0479 [pii] (2004). [DOI] [PMC free article] [PubMed] [Google Scholar]
- 51.Zoppino FC, Militello RD, Slavin I, Alvarez C & Colombo MI Autophagosome formation depends on the small GTPase Rab1 and functional ER exit sites. Traffic 11, 1246–1261, doi: 10.1111/j.1600-0854.2010.01086.x TRA1086 [pii] (2010). [DOI] [PubMed] [Google Scholar]
- 52.Bader CA, Shandala T, Ng YS, Johnson IR & Brooks DA Atg9 is required for intraluminal vesicles in amphisomes and autolysosomes. Biol Open 4, 1345–1355, doi: 10.1242/bio.013979 bio.013979 [pii] (2015). [DOI] [PMC free article] [PubMed] [Google Scholar]
- 53.Yamaguchi J et al. Atg9a deficiency causes axon-specific lesions including neuronal circuit dysgenesis. Autophagy 14, 764–777, doi: 10.1080/15548627.2017.1314897 (2018). [DOI] [PMC free article] [PubMed] [Google Scholar]
Associated Data
This section collects any data citations, data availability statements, or supplementary materials included in this article.