

Abstract
We tested the hypothesis that transmission of arterial pressure to brain tissue oxygenation is low under conditions of arterial pressure instability. Two experimental models of hemodynamic instability were used in healthy human volunteers; (1) oscillatory lower body negative pressure (OLBNP) (N = 8; 5 male, 3 female), and; (2) maximal LBNP to presyncope (N = 21; 13 male, 8 female). Mean arterial pressure (MAP), middle cerebral artery velocity (MCAv), and cerebral tissue oxygen saturation (ScO2) were measured non-invasively. For the OLBNP protocol, between 0 and −60mmHg negative pressure was applied for 20 cycles at 0.05 Hz, then 20 cycles at 0.1 Hz. For the maximal LBNP protocol, progressive 5 min stages of chamber decompression were applied until the onset of presyncope. Spectral power of MAP, mean MCAv, and scO2 were calculated within the VLF (0.04–0.07 Hz), and LF (0.07–0.2Hz) ranges, and cross-spectral coherence was calculated for MAP-mean MCAv, MAP-ScO2, and mean MCAv-ScO2 at baseline, during each OLBNP protocol, and at the level prior to pre-syncope during maximal LBNP (sub-max). The key findings are (1) both 0.11-IZ OLBNP and sub-max LBNP elicited increases in LF power for MAP, mean MCAv, and scO2 (p ≤ 0.08); (2) 0.05 Hz OLBNP increased VLF power in MAP and scO2 only (p ≤ 0.06); (3) coherence between MAP-mean MCAv was consistently higher (≥0.71) compared with MAP-ScO2, and mean MCAv-ScO2 (≤0.43) during both OLBNP protocols, and sub-max LBNP (p ≤ 0.04). These data indicate high linearity between pressure and cerebral blood flow variations, but reduced linearity between cerebral tissue oxygenation and both arterial pressure and cerebral blood flow. Measuring arterial pressure variability may not always provide adequate information about the downstream effects on cerebral tissue oxygenation, the key end-point of interest for neuronal viability.
Keywords: oscillations, cerebral, tissue oxgyenation
1. Introduction
Conventional cardiovascular risk-stratification relies heavily on the assumption that static measurements of brachial blood pressure alone accounts for all blood pressure-related risk of vascular events. However, there is growing recognition that this paradigm is overly simplistic and that blood pressure may have significant limitations for detecting adverse changes in the intra-cranial environment While blood pressure is commonly monitored on the premise that it informs the state of cerebral it is also well established that cerebral blood flow is affected not only by blood pressure, but also by physiological processes such as cerebral autoregulation (Zhang et al 1998a, Panerai et al 2002). Consequently, individuals with similar blood pressure can have disparate levels of brain perfusion depending on their individual autoregulation capacity. Similarly, measuring the oxygenation of arterial blood using conventional digit pulse oximetry may not accurately reflect brain tissue oxygenation (Tobias 2008), which is a complex variable that is influenced by local metabolic conditions of oxygen supply and consumption. These are some reasons why direct monitoring of cerebral blood flow, brain tissue oxygenation, and cerebral autoregulation have become conceptually attractive strategies for optimizing outcomes in care settings (Kirkpatrick et al 1998, Johnston and Czosnyka 2003, Reinhard et al 2005).
Despite decades of research, informed hemodynamic management in many areas of neurocritical care remains enigmatic (Grise and Adeoye 2012). For example, observational studies have shown that blood pressure is frequently elevated during acute stroke and recent data indicate that rapid blood pressure lowering improves functional outcome in hemorrhagic stroke (Anderson et al 2013). However, innumerable clinical trials on the effectiveness of blood pressure lowering in acute ischemic have generated divergent results (Hubert et al 2013). This has prompted speculation that hemodynamic management based on systemic blood pressure monitoring may be too crude to achieve consistent optimization of local cerebral perfusion and oxygenation (Hadjiev and Mineva 2013).
In light of these practical challenges, the goal of this study is to determine the extent to which blood pressure changes can be used as surrogate indices of cerebral blood flow and brain tissue oxygenation under situations where blood pressure and cerebral perfusion may be threatened. We used static and oscillatory lower body negative pressure (OLBNP) as experimental models of hemodynamic instability and linear function analysis to define the timescale and magnitude of the input–output relations between blood pressure, cerebral blood flow, and brain tissue oxygenation. We hypothesized that the transmission of pressure to brain tissue oxygenation is low across all frequency ranges (0.04–0.40 Hz) under both experimental models of hemodynamic instability.
2. Methods
Data for this study were from two independent protocols; (1) OLBNP at 0.05 and 0.1 Hz, and; (2) maximal LBNP to presyncope. Each protocol is described separately.
2.1. Oscillatory lower body negative pressure
2.1.1. Subjects.
Eight healthy, normotensive, non-smoking subjects (5 male, 3 female; age, 28 ± 1 years; height, 169 ± 3cm; weight, 75 ± 5 kg; mean ± SE) volunteered to participate in this study. This protocol is part of an ongoing larger study consisting of additional experiments and interventions that will be published separately at a date, but do not impact the outcome of the data presented herein. The experiments were conducted in the Department of Integrative Physiology & Anatomy at the University of North Texas Health Science Center (UNTHSC), and all experimental protocols and procedures were reviewed and approved by the UNTHSC Institutional Review Board. A complete medical history and physical examination conducted on each potential subject prior to their participation in the study. All female subjects were tested within days 1–4 of the early follicular phase of their menstrual cycle, and were also administered a urine pregnancy test prior to experimentation to ensure they were not pregnant. Due to the potential effects on autonomic function, all subjects were instructed to maintain their normal sleep patterns in addition to abstaining from exercise, alcohol, caffeine and other pharmacological stimulants 24 h before each protocol. After familiarization with the laboratory, subjects were briefed with a description of all procedures and risks associated with the ex1Miments and each gave written informed consent to participate in the study.
2.1.2. Instrumentation.
Subjects were placed in the supine position with their lower body inside a LBNP chamber (VUV Analytics, Austin, TX) and positioned on a bicycle seat to ensure they did not move during chamber decompression. Durable plastic and a neoprene band were wrapped around the subject’s waist to create an airtight seal with the LBNP cham1M. Subjects were instrumented with a standard lead Il ECG (shielded leads, cable and amplifier, AD Instruments, Bella Vista, NSW, Australia), infrared finger photoplethysmography to measure beat-to-beat arterial blood pressure (Finometer®, TNO-TPD Biomedical Instrumentation, Amsterdam, The Netherlands), a 2MHz transcranial Doppler (TCI)) ultrasound probe for assessment of blood velocity in the middle cerebral artery (MCAv; ST3, Spencer Technologies, Seattle, WA), a flat near infrared spectroscopy (MRS) sensor over the right or left frontal lobe for assessment of oxy-hemoglobin (HbO2), deoxy-hemoglobin (dHb), and cerebral oxygen saturation (ScO2, Oxip1exTS, ISS Inc., Champaign-Urbana, L), and a nasal cannula to capture expired gases for assessment of end-tidal CO2 (etCO2) and respiration rate (ML206 Gas Analyzer, AD Instruments, Bella Vista, NSW, Australia). For the majority of subjects, MCAv and ScO2 were measured on the same side. All signals were recorded at 1000Hz using commercially available data acquisition hardware and software (PowerLab and LabChart Pro, AD Instruments, Bella Vista, NSW, Australia).
2.1.3. Study design.
Following instrumentation, 5 min of resting baseline data was collected. OLBNP between 0 and −60mmHg was applied for 20 cycles at 0.05 Hz (very low frequency, VLF), then 20 cycles at 0.1 Hz (low frequency, IS), with a 5min rest period between each protocol. Subjects remained as relaxed as possible, and breathed spontaneously throughout the OLBNP profiles. Following completion of the OLBNP protocols, subjects remained in the supine posture for an additional 5 min recovery period.
2.1.4. Data analysis.
All waveform data was exported into commercial analysis software (WinCPRS, Absolute Aliens, Turku, Finland). R waves generated from the ECG siB1al were detected and marked at their occurrence in time. Heart rate (HR) was derived from the R–R interval (RRI) signal. Diastolic arterial pressure (DAP) and systolic arterial pressure (SAP) were marked from the blood pressure tracings. Mean arterial pressure (MAP) and mean MCAv were automatically calculated from the area under the arterial pressure and MCAv tracings via the WinCPRS software. Stroke volume (SV) was estimated on a beat-to-beat basis by the Finometer® using the established pulse contour method (Jansen et al 1990) and recorded directly to the LabChart file. Cardiac output (CO) was calculated as the product of HR and SV, total peripheral resistance CTPR) was calculated as MAP divided by CO, and cerebrovascular resistance (CVR) was calculated as MAP divided by mean MCAv. All variables were calculated from the 300s baseline period, and from the 20-cycles of 0.05 Hz OLBNP (400s) and 0.1 Hz OLBNP (200s).
Oscillatory patterns of MAP, mean MCAv, and ScO2 were determined with fast Fourier power spectral analysis. Data were made equidistant by interpolating linearly and re-sampling at 5Hz. Data were then passed through a low-pass filter with a cutoff frequency of 0.5 Hz. Data sets were fast Fourier transformed with a Hanning window to obtain power spectra. Spectral power was expressed as the integrated area within the VLF range (0.04–0.07 Hz), and LF range (0.07–0.2Hz). The coherence between MAP and mean MCAv, MAP and ScO2, and mean MCAv and ScO2 was calculated by dividing the squared cross-spectral densities of the two signals by the product of the individual autospectra (60s windows).
2.1.5. Statistics.
One-way repeated measures ANOVAs were used for comparison of all responses (baseline, 0.05 Hz OLBNP, 0.1 Hz OLBNP). For frequency domain variables, comparisons were made only within a frequency band (VLF, LF). Holm-Sidak post-hoc tests were used to compare responses to the OLBNP protocols versus baseline only. Paired t-tests were used to compare MAP-Sc02 coherence and mean MCAv-ScO2 coherence to MAP-mean MCAv coherence within a specific frequency band. Unless otherwise stated, all data are presented as mean ± SE, and exact p values are reported for comparisons.
2.2. Maximal LBNP to presyncope
2.2.1. Subjects.
Twenty-one healthy, normotensive, non-smoking subjects (13 male, 8 female; age, 27 ± 1 years; height, 171 ± 2cm; weight, 77 ± 3kg; mean ± SE) were included in the analysis of this study. Twenty-five subjects completed this protocol, but four did not reach true pre-syncope according to the criteria described below. Six of the final 21 subjects also participated in the OLBNP study. The experiments were conducted in the Department of Integrative Physiology & Anatomy at the University of North Texas Health Science Center (UNTHSC), and all experimental protocols and procedures were reviewed and approved by the UNTHSC Institutional Review Board. A complete medical history and physical examination conducted on each potential subject prior to their participation in the study. All inclusion and exclusion criteria were identical to the OLBNP study. After familiarization with the laboratory, subjects were briefed with a description of all procedures and risks associated with the experiments and each gave written informed consent to participate in the study.
2.2.2. Study design.
Subject instrumentation was to the OLBNP study. The maximal LBNP protocol consisted of a 5 min baseline period followed by progressive 5 min stages of chamber decompression at −15, −30, −45, −60, −70, −80, −90, and −100 mmHg. The protocol was terminated following completion of 5 min at −100 mmHg LBNP, or with the onset of presyncope, defined as one or a combination of the following criteria: sudden bradycardia, SAP < 80mmHg, and/or voluntary subject termination due to presyncopal symptoms such as gray-out, nausea, sweating, dizziness, or general discomfort. Following presyncope, subjects remained in the LBNP chamber for a 10min recovery period.
2.2.3. Data analysis.
The data processing procedures were identical to the OLBNP study, except that all variables were calculated from the final 240s (4 min) of baseline, and the last completed sub-maximal level of LBNP prior to the onset of presyncope (sub-max). For example, even if a subject reached pre-syncope 4 min into the −70 mmHg LBNP level, the last 4 min of the preceding −60mmHg level was used for analysis.
2.2.4. Statistics.
Paired t-tests were used to compare responses between baseline and sub-max for all variables. Paired t-tests were also used to compare MAP-ScO2 coherence and mean MCAv-ScO2 coherence to MAP-mean MCAv coherence within a specific frequency band. Unless otherwise stated, all data are presented as mean ± SE, and exact p values are reported for comparisons.
3. Results
3.1. Oscillatory lower body negative pressure
The hemodynamic responses to OLBNP at 0.05 and 0.1 Hz are presented in table 1. The only variable that changed with OLBNP was CVR, increasing compared with baseline at both OLBNP frequencies. The power spectral density (PSD) for MAP, mean MCAv, and ScO2 at baseline, and during the two OLBNP protocols are shown in figure 1. Compared with baseline, VLF power increased during 0.05 Hz OLBNP for MAP (p < 0.001), and ScO2 (p = 0.06). The increase in mean MCAv VLF power was not statistically distinguishable from baseline (p = 0.49). LF power increased for MAP (p < 0.001), mean MCAv (p = 0.08), and ScO2 (p = 0.03) during 0.1Hz OLBNP compared with baseline. During 0.05Hz OLBNP, VLF coherence increased for MAP-ScO2 (p = 0.04), and during 0.1 Hz OLBNP LF coherence increased for MAP-ScO2 (p < 0.001) and mean MCAv-ScO2 (p = 0.003) (figure 2). Compared with MAP-mean MCAv coherence within each frequency band, coherence was lower between MAP-ScO2 and mean MCAv-ScO2 at baseline and during both OLBNP protocols (p ≤ 0.004), except for VLF during 0.1 Hz OLBNP (p ≤ 0.20) (figure 2).
Table 1.
Time domain cardiovascular responses to OLBNP at 0.05 Hz (VLF) and 0.1 Hz (LF) (N = 8).
| Physiological parameter | Baseline | 0.05 Hz OLBNP | 0.1 Hz OLBNP |
|---|---|---|---|
| RRI (ms) | 1004 ± 36 | 989 ± 36 | 986 ± 40 |
| HR (beats min−1) | 62.0 ± 2.6 | 61.8 ± 2.6 | 62.1 ± 2.9 |
| MAP (mmHg) | 91.9 ± 3.1 | 90.7 ± 2.6 | 93.6 ± 2.9 |
| SV (ml) | 98.6 ± 4.3 | 99.0 ± 4.7 | 99.0 ± 4.9 |
| CO (l min−1) | 6.1 ± 0.4 | 6.1 ± 0.3 | 6.1 ± 0.3 |
| TPR (mmHg I−1 min−1) | 15.2 ± 0.5 | 15.0 ± 0.4 | 15.5 ± 0.5 |
| Mean MCAv (cms−1) | 69.2 ± 4.2 | 65.4 ± 4.3 | 66.8 ± 4.7 |
| CVR (mmHg cm−1 s−1) | 1.3 ± 0.1 | 1.4 ± 0.1a | 1.4 ± 0.1a |
| ScO2 (%) | 66.9 ± 1.7 | 66.1 ± 2.1 | 66.2 ± 2.1 |
| HbO2 (μM) | 33.0 ± 3.0 | 32.3 ± 3.3 | 32.2 ± 3.2 |
| dHb (μM) | 16.1 ± 1.2 | 16.1 ± 1.2 | 16.0 ± 1.2 |
| etCO2 (mmHg) | 41.4 ± 1.1 | 40.0 ± 1.3 | 40.0 ± 1.3 |
| Respiration rate (breaths min−1) | 12.3 ± 1.3 | 13.4 ± 1.3 | 11.9 ± 1.7 |
p ≤ 0.04 compared to baseline (one-way repeated measures ANOVA).
OLBNP, oscillatory lower body negative pressure; RRI, R-R interval; HR, heart rate; MAP, mean arterial pressure; SV, stroke volume; CO, cardiac output; TPR, total peripheral resistance; MCAv, middle cerebral artery velocity; CVR, cerebrovascular resistance; ScO2. cerebral oxygen saturation; HbO2, oxy-hemoglobin; dHb, deoxy-hemoglobin; etCO2, end-tidal carbon dioxide.
Figure 1.
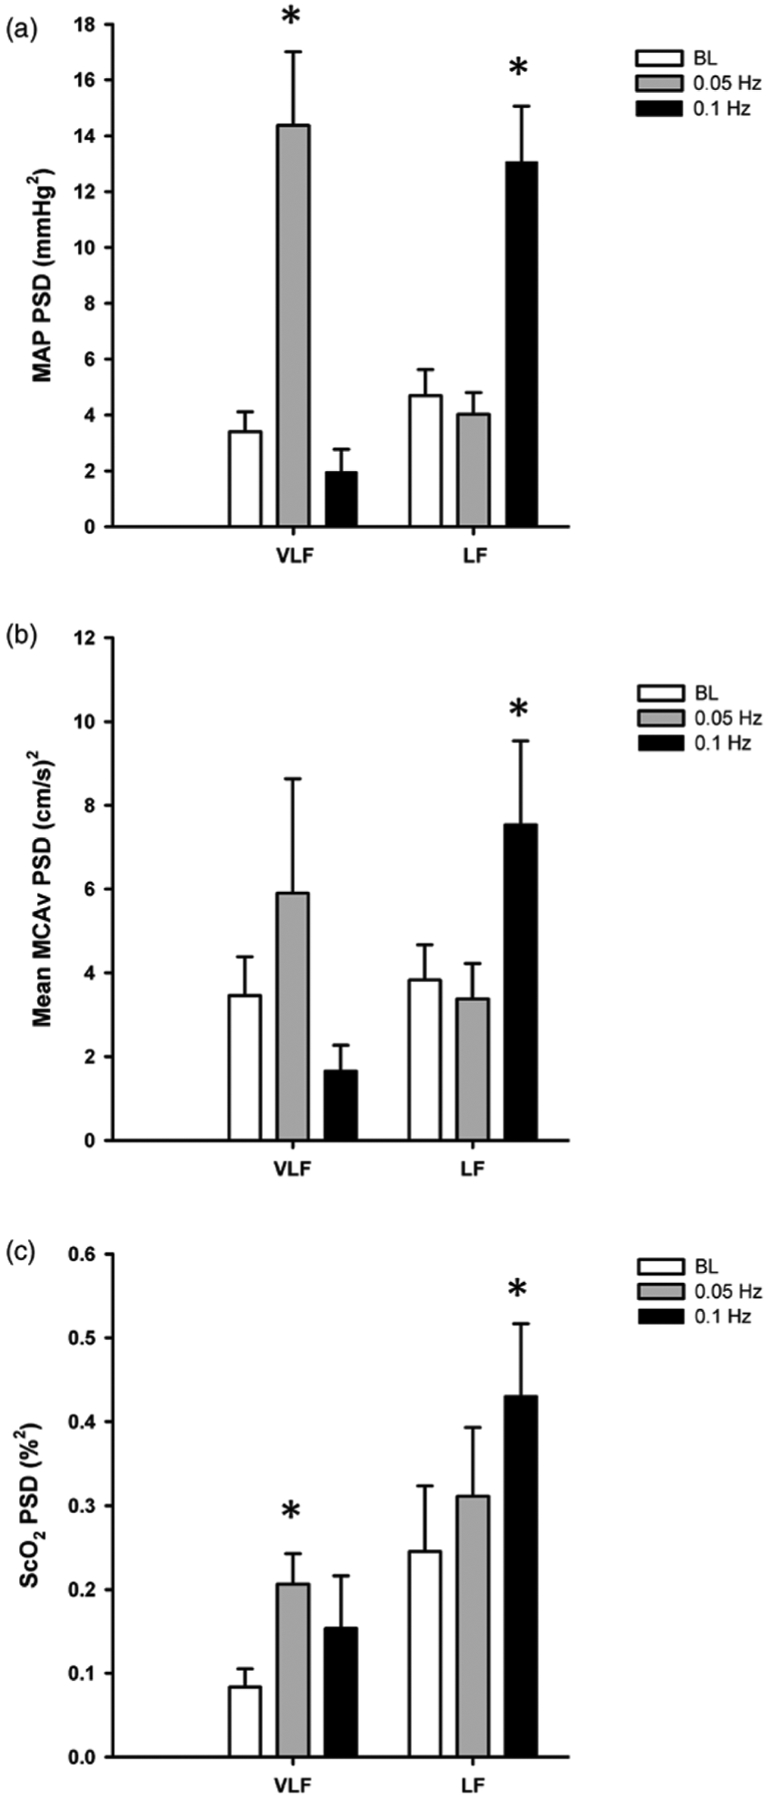
Power spectral density (PSD) for (a) mean arterial pressure (MAP), (b) mean middle cerebral artery velocity (MCAv), and (c) cerebral oxygen saturation (ScO2) in the very low frequency (VLF) and low frequency (LF) ranges at baseline (BL; white bars) and during oscillatory lower body negative pressure (OLBNP) at 0.05Hz (gray bars) and 0.1 Hz (black bars). *Denotes p ≤ 0.08 compared with BL within the specific frequency band (VLF, LF).
Figure 2.
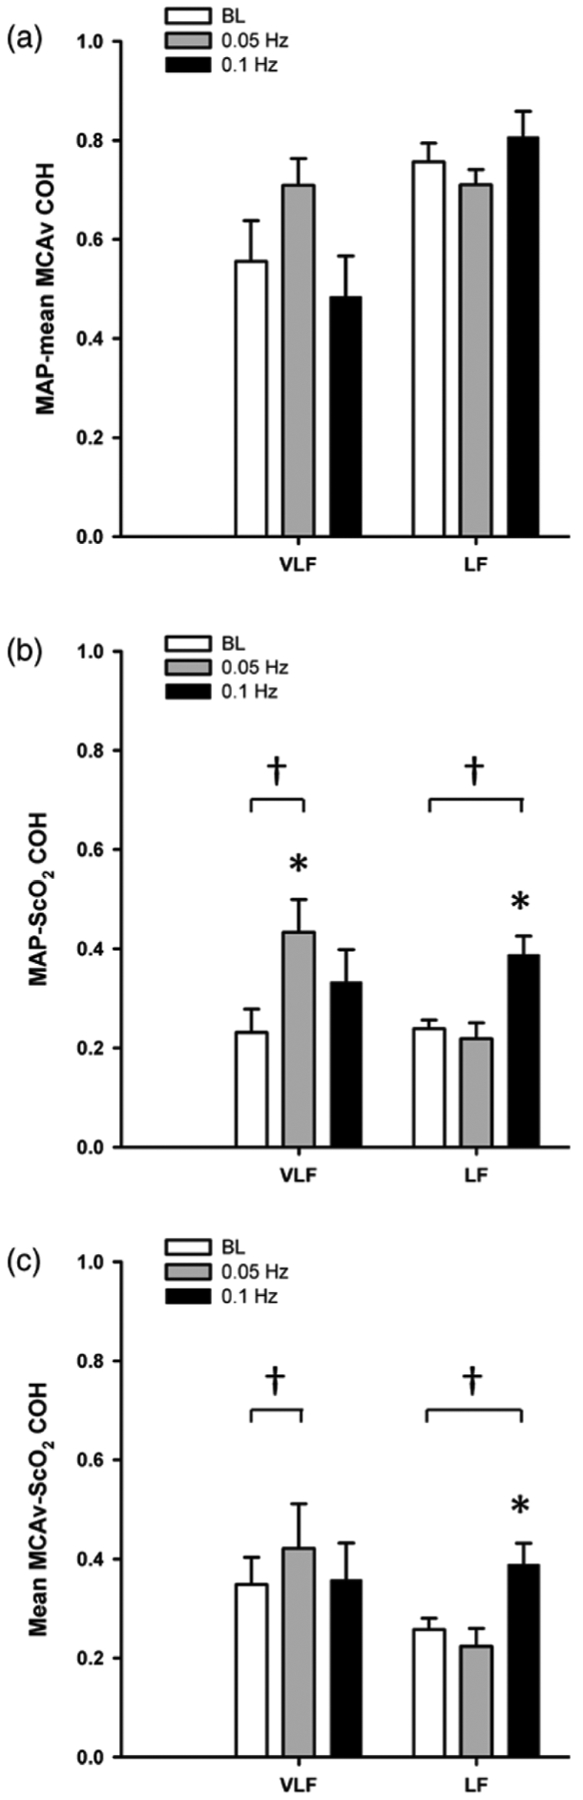
Cross-spectral coherence (COH) (a) between mean arterial pressure (MAP) and mean middle cerebral artery velocity (MCAv), (b) MAP and cerebral oxygen saturation (ScO2), and (c) MCAv-ScO2 in the very low frequency (VLF), and low frequency (LF) ranges at baseline (BL; white bars) and during oscillatory lower body negative pressure (OLBNP) at 0.05Hz (gray bars) and 0.1 Hz (black bars). *Denotes p ≤ 0.04 compared with BL within the specific frequency band (VLF, LF); †Denotes p ≤ 0.04 compared with MAP-mean MCAv COH within the specific frequency band and OLBNP frequency.
3.2. Maximal LBNP presyncope
The LBNP protocol was terminated at −45mmHg for two subjects, −60 mmHg for six subjects, −70mmHg for seven subjects, −80mmHg for subjects, and −90mmHg for three subjects. The baseline and sub-max hemodynamic data are presented in table 2. As expected, LBNP elicited a 45 ± 3% reduction in SV, and a decrease in MAP, stimulating baroreflex-mediated increases in HR and TPR. Both mean MCAv and ScO2 decreased, and CVR increased with LBNP. Respiration rate remained constant, but etCO2 was reduced by 8.4 ± 1.3 mmHg.
Table 2.
Time domain cardiovascular responses to sub-maximal LBNP (N = 21).
| Physiological parameter | Baseline | Sub-maximal LBNP |
|---|---|---|
| RRI (ms) | 993 ± 28 | 631 ± 24a |
| HR (beats min−1) | 62.9 ± 1.8 | 98.3 ± 3.7a |
| MAP (mmHg) | 93.6 ± 1.5 | 86.9 ± 1.3a |
| SV (ml) | 100.6 ± 3.8 | 54.5 ± 3.0a |
| %Δ SV | 0.0 | −45.3 ± 2.5a |
| CO (l min−1) | 6.2 ± 0.3 | 5.2 ± 0.2a |
| TPR (mmHg I−1 min−1) | 15.6 ± 0.7 | 17.3 ± 0.9a |
| Mean MCAv (cm s−1) | 62.1 ± 3.1 | 50.2 ± 2.7a |
| CVR (mmHg cm−1 s−1) | 1.6 ± 0.1 | 1.8 ± 0.1a |
| ScO2 (%) | 67.2 ± 1.5 | 62.9 ± 1.6a |
| HbO2 (μM) | 34.2 ± 2.7 | 30.8 ± 2.5a |
| dHb (μM) | 16.2 ± 1.4 | 17.6 ± 1.4a |
| etCO2 (mmHg) | 41.7 ± 0.7 | 33.4 ± 1.5a |
| Respiration rate (breaths min−1) | 12.1 ± 0.7 | 12.3 ± 0.9 |
p < 0.002 compared with baseüne (paired t-test).
LBNP, lower body negative pressure; RRI, R–R interval; HR, heart rate; MAP, mean arterial pressure; SV, stroke volume; CO, cardiac output; TPR, total peripheral resistance; MCAv, middle celebral artery CVR, cerebrovascular resistance; ScO2, cerebral oxygen saturation; HbO2, oxy-hemoglobin; dHb, doxy-hemoglobin; etCO2, end-tidal carbon dioxide.
PSD for MAP, mean MCAv, and ScO2 at baseline and sub-max are presented in figure 3. LBNP elicited increases in LF power for all three variables compared with baseline (p ≤ 0.02), and a decrease in mean MCAv VLF (p = 0.02). During LBNP, LF coherence increased between MAP-mean MCAv (p = 0.04), and between mean MCAv-ScO2 (p = 0.05), but did not change between MAP-ScO2 (p = 0.20) (figure 4). Compared with MAP-mean MCAv coherence within each frequency band, coherence was lower between MAP-ScO2 and mean MCAv-ScO2 at baseline and during LBNP (p ≤ 0.005) (figure 4).
Figure 3.

Power spectral density (PSD) for (a) mean arterial pressure (MAP), (b) mean middle cerebral artery velocity (MCAv), and (c) cerebral oxygen saturation (ScO2) in the very low frequency (VLF), and low frequency (LF) ranges at baseline (BL; black bars) and during sub-maximal (sub-max; white bars) lower body negative pressure. *Denotes p ≤ 0.02 compared with BL within the specific frequency band (VLF, LF).
Figure 4.
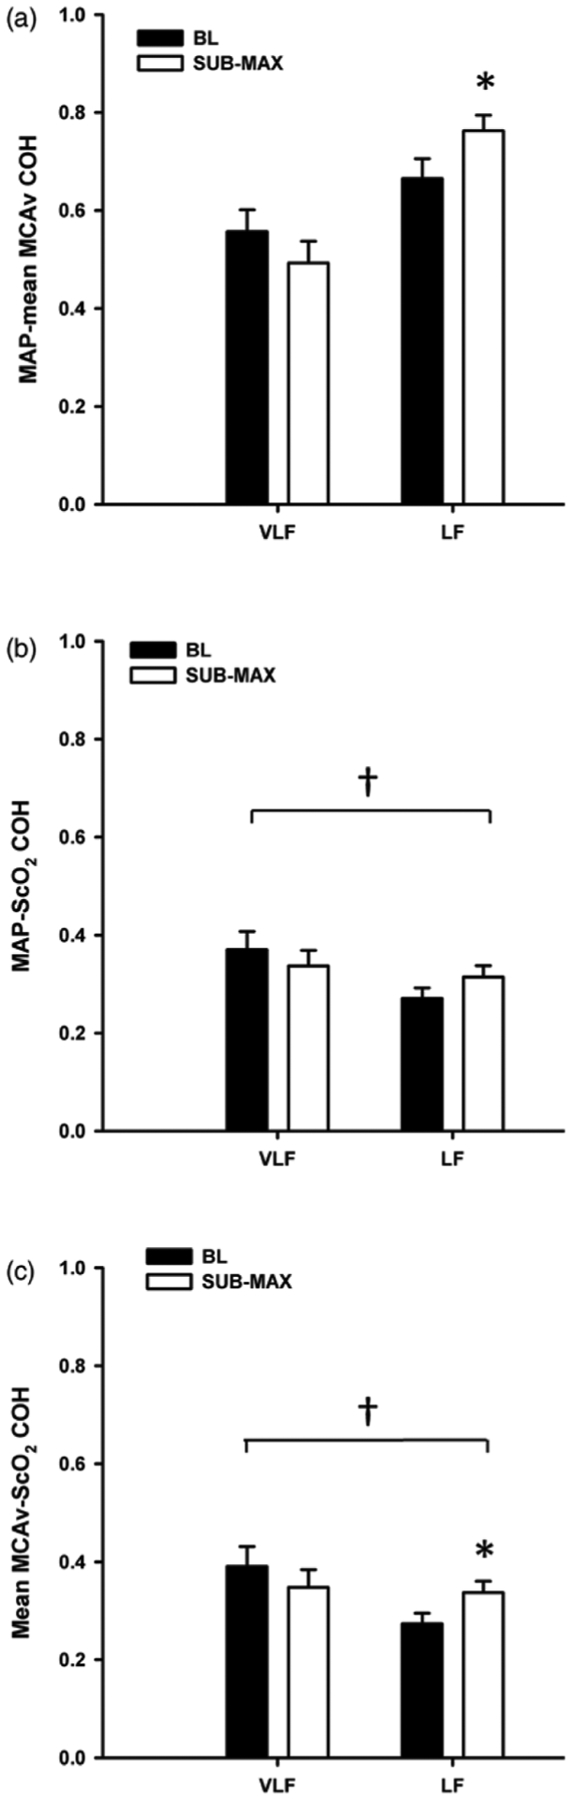
Cross-spectral coherence (COH) between (a) mean arterial pressure (MAP) and mean middle cerebral artery velocity (MCAv), (b) MAP and cerebral oxygen saturation (ScO2), and (c) MCAv-ScO2 in the very low frequency (VLF), and low frequency (LF) ranges at baseline (BL; black bars) and during sub-maximal (sub-max; white bars) lower body negative pressure. *Denotes p ≤ 0.05 compared with BL within the specific frequency band (VLF, LF); †Denotes p ≤ 0.005 compared with MAP-mean MCAv COH within the specific frequency band and time point (BL or sub-max).
4. Discussion
In order to assess blood pressure variability can be used as a surrogate index of cerebral blood flow and brain tissue oxygenation variability, we induced variations in arterial pressure via maximal static LBNP and OLBNP in healthy human subjects, and determined the relationships between arterial pressure, cerebral blood flow, and cerebral tissue oxygenation. Our key findings (1) both 0.1 Hz OLBNP and sub-maximal LBNP elicited increases in LF power for MAP, mean MCAv, and scO2; (2) 0.05 Hz OLBNP increased VLF power in MAP and ScO2 only; (3) coherence between MAP and mean MCAv was consistently higher compared with coherence between MAP and ScO2, and between mean MCAv and ScO2. These data indicate high linearity between arterial pressure and cerebral blood flow variations, but reduced linearity between pressure and cerebral tissue oxygenation, and between cerebral blood flow and cerebral oxygenation. These findings suggest that measuring arterial pressure variability may not always provide adequate information about the downstream effects on cerebral tissue oxygenation, the key end-point of interest for neuronal viability in many common neuro-critical care settings. Furthermore, measuring absolute arterial pressure does not provide an accurate representation of absolute cerebral blood flow and oxygenation under hypovolemic conditions either; with a 45% reduction in central blood volume following application of sub-maximal LBNP, cerebral blood flow and oxygenation fell by ~19% and ~6.5%, despite just a ~7% (~7mmHg) decrease in MAP (as a reference, at presyncope MCAv and Sc02 reduced by up to ~25–30% (Bondar et al 1995, Rickards et al 2011) and ~10–15% (Glaister and Miller 1990, Madsen et al 1995, van Lieshout et at 2003)). Collectively, these findings consistent with our hypothesis and support the use of direct measures of cerebral blood flow and/or oxygenation in clinical situations where accurate assessment of the metabolic environment of the brain is desirable (e.g. stroke, traumatic brain injury, myocardial infarction).
4.1. Oscillatry lower body negative pressure
OLBNP has been shown to reliably induce oscillations at specific frequencies of interest, with the amplitude of oscillations proportional to the magnitude of applied pressure (Brown et al 2004, Hamner et al 2004). In the current study, the frequencies of 0.05 and 0.1 Hz OLBNP were chosen as they fall within the commonly utilized frequency ranges for assessing arterial pressure to cerebral blood flow relationships (VLF: 0.02–0.07 Hz, and LF: 0.07–0.2Hz), often termed ‘dynamic cerebral autoregulation’ (Zhang et al 1998a, Claassen et al 2009). As expected, both 0.1 Hz and 0.05 Hz OLBNP induced large increases in LF and VLF power in arterial pressure, respectively, and induced an increase in cerebral blood flow power (with 0.1 Hz OLBNP), as previously demonstrated (Hamner et al 2004, Claassen et al 2009) (see Methodological Considerationssection for discussion of MCAv VLF response). While cerebral tissue oxygenation variability was also elevated under both OLBNP frequencies (0.05 and 0.1 Hz), the magnitude of oscillations was small compared with pressure and flow (figure 1(c)). To our knowledge, this is one of very few studies (Reinhard et al 2006, van Beek et al 2012, Oudegeest-Sander et al 2014) to assess cerebal oxygen variability with forced oscillations at fixed frequencies (via OLBNP, repeated squat-to-stand maneuvers, or paced breathing). As absolute values of HbO2, dHb, and ScO2 did not change from baseline with either 0.1 or 0.05 Hz OLBNP (table 1), it does not appear as though these forwed oscillations affect the delivery or utilization of oxygen at the level of the tissue in otherwise healthy individuals.
Many studies utilizing methods to force oscillations in arterial pressure and cerebral blood flow via OLBNP (Brown et al 2004, Hamner et al 2004, Tzeng et al 2011), repeated squat-to-stand (Birch et al 1995, Claassen et al 2009) or sit-to-stand maneuvers (Oudegeest-Sander et al 2014), and paced breathing (Reinhard et al 2006, Lucas et al 2013) have demonstrated increases in both MAP and mean MCAv and high coherence between MAP and mean MCAv at the specific oscillation frequency. In fact, forced oscillations are frequently used as a simple means to increase coherence between MAP and mean MCAv, and thereby decrease inter-subject variability for subsequent investigation of cerebral autoregulation via transfer function analysis (Reinhard et al 2006, Claassen et al 2009). In a recent study, Oudegeest-Sander et al (2014) also reported an increase in coherence between mean MCAv and HbO2 during repeated sit-to-stand maneuvers at 0.05 Hz (>0.5) compared with resting baseline (<0.4) in both young and old subjects. In the current study, average baseline coherence between mean MCAv and ScO2 and between MAP and ScO2 were consistently below 0.4 at all frequencies, increasing to ≥0.4 at the specific frequencies of OLBNP, consistent with these findings (Oudegeest-Sander et al 2014). Despite these increases in coherence with OLBNP, however, the coherence between MAP and mean MCAv was always higher at each frequency of forced oscillations, suggesting diminished linearity in the coupling of oscillations from mean MCAv to ScO2 or from MAP to ScO2. These results, therefore, also indicate that there is not direct linear transmission of oscillations originating in systemic arterial pressure to cerebral blood flow and finally to cerebral oxygenation at the level of the tissue (MAP-MCAv COH > MCAv-ScO2 COH = MAP-ScO2 COH). The lower coherence of both pressure and flow to cerebral tissue oxygen, and the small amplitude of ScO2 oscillations suggest that brain tissue oxygenation may be protected from upstream variability in both pressure and flow. As our subject cohort was young and healthy, we did not assess whether these relationships would be altered in and/or clinical populations.
In a study of older patients with unilateral severe obstructive carotid disease breathing at a paced rate of 6 breaths min−l (0.1 Hz), Tzeng et al (2006) showed a decrease in 0.1 Hz phase between MCAv and HbO2, while van Beek et al (2012) reported increases in both phase and gain between MCAv and Hb02 in older patients with Alzheimer’s disease during repeated sit-to-stand maneuvers at 0.05 Hz. Oudegeest-Sander et al (2014) also report a reduced 0.05 Hz phase for MCAv-HbO2 in elderly subjects compared with young controls during repeated sit-to-stand maneuvers at 0.05 Hz. When assessing pressure-flow relationships with transfer function analysis, low coherence, high phase, and low gain are traditionally interpreted as a positive response (independence of flow from pressure), while high coherence, low phase and high gain are interpreted as an impaired response (greater dependence of flow on pressure); the same interpretation of transfer function metrics was applied to these studies assessing the relationships between MCAv and HbO2. While some of the reported relationships are conflicting, reflecting a known lack of convergent validity between transfer function analysis metrics (Tzeng et al 2012), it appears as though clinical cerebral pathologies and age may increase the likelihood of high variability in arterial pressure and/or cerebral blood flow negatively impacting cerebral microvascular oxygenation.
4.2. Maximal LBNP
While OLBNP is an ideal method to force hemodynamic variations at specific frequencies, maximal LBNP was also used to induce clinically meaningful reductions in blood volume, and to elicit spontaneous LF variations in arterial It is well established that increases in arterial pressure LF oscillations during hypovolemia are associated with increased LF variability in sympathetic activity. Cooke et al (2009) demonstrated a parallel increase in muscle sympathetic activity (MSNA) LF power with increasing MSNA during maximal LBNP, reflected in progressively increasing LF coherence between MSNA and pressure. Similarly, with progressive sympathetic withdrawal in syncopal subjects during head-up Kamiya et al (2005) showed concomitant reductions in MSNA and MSNA LF power, and in MAP and MAP LF While some investigations have shown increases in MAP and mean MCAv LF power and high MAP-mean MCAv LF coherence with LBNP (Zhang et al 1998b, Rickards et al 2011), others have reported increases only in MAP LF power and not MCAv LaF power (Brown et al 2003, 2004), citing cerebral autoregulation as the mechanisms responsible for buffering the of variability from pressure to flow, In the current study, transfer of LF variability from pressure to flow is the most plausible explanation for the elevated LF power in both cerebral blood flow and oxygenation at sub-maximal levels of LBNP. As with the OLBNP protocol, however, the magnitude of ScO2 oscillations was small compared with pressure and flow (figure 3(c)), and the coherence between ScO2 and both MAP and MCAv was low. While cerebral oxygen variability has not been previously reported with central hypovolemia elicited with LBNP, increased L.F oscillations in cerebral oxygenation have been demonstrated during orthostatic maneuvers (sitting and standing from supine), and were associated with increased LF power in arterial pressure (Tachtsidis et al 2004). As the MRS technique assesses tissue sample volumes containing multiple vessel types, including arterioles, capillaries, and venules, measures of dHb, HbO2, and ScO2 are generally considered ‘post-cellular’ (Pollard et al 1996, Madsen and Secher 1999). Consequently, based on the HbO2 and dHb responses, it appears as though oxygen extraction increased with sub-maximal LBNP (decreased HbO2 and dHb); the role of increased oscillations on oxygen extraction and utilization during cerebral hypoperfusion, however, is unclear as we did not have a control group where oxygen saturation oscillations were suppressed.
The reduced linearity between MAP and ScO2 is also not surprising considering the large number of physiological steps between MAP and the oxygenation state of a sample of mixed-venous blood (MRS-derived ScO2). ScO2 reflects the combined effects of oxygen delivery (affected by cerebral blood flow and arterial oxygen content) and tissue oxygen extraction, which, in turn, is influenced by tissue metabolism. Under normoxic conditions, the low coherence between mean MCAv and ScO2 may reflect the ability of cerebral blood flow to effectively respond to changing metabolic demand induced by the LBNP stimulus, and functioning metabolic blood flow regulatory mechanisms. On the other hand, increased coherence between flow and ScO2 may imply impaired regulation in the clinical setting. This is an intriguing hypothesis that requires further investigation, particularly considering variations in oxygen delivery, arterial oxygen content, and tissue metabolism likely differ across patient populations.
4.3. Methodological considerations
Compared with other studies assessing phase and gain between cerebral blood flow and oxygenation (Reinhard et al 2006, van Beek et al 2012, Oudegeest-Sander et al 2014), we were not confident in the reliability of these measures due to low coherence at baseline, and during OLBNP and sub-maxima1 LBNP (<0.5). As such, a direct comparison with the results of these studies is limited. This low coherence can result not only from non-linearity between two signals, but also due to high extraneous noise (low signal to noise ratio), no relationship between the two signals of interest (Zhang et al 1998a), a large time lag between changes in the two signals, or additional factors that may be influencing only one of the variables of interest (e.g. variations in cerebral metabolism, intracranial pressure, the non-linear nature of the oxy-hemoglobin dissociation curve). However, (1) there are clear physiological mechanisms relating all three of these measurements, and; (2) use of OLBNP increases the signal to noise ratio, evidenced by clear increases in in all signals (except MCAv VLF) at the specific oscillating frequency. Therefore, the low coherence was likely a result of reduced linearity between responses of the two pairs of signals (MCAv-ScO2 and MAP-ScO2), although the additional potentially confounding factors outlined above cannot be accounted for in this study.
Using broad frequency ranges for assessment of LF and VLF power may have diluted the calculated power for MAP, mean MCAv and ScO2. For example, despite an average 1.5-fold increase in mean MCAv VLF with 0.05Hz OLBNP, there was no statistically distinguishable difference compared with baseline (p = 0.49). Further inspection of this data revealed that MCAv VLF power actually decreased within the range of 0.04–0.07 Hz with 0.05 Hz OLBNP in three of the eight subjects, but there was a distinct peak on the power spectrum at 0.05 Hz for each of these subjects. This entrainment of spontaneous activity to the imposed oscillation frequency may have lead to reduced activity in adjacent frequencies within this band which was not compensated by increased activity at the OLBNP frequency, subsequently leading to an overall reduction in power in this band. The reason for this discrepancy in these three subjects is not clear and warrants further investigation.
Accruing evidence suggests that measurements of cerebral oxygenation with some MRS monitoring devices significantly affected by skin contamination, some by up to 35% (Davie and Grocott 2012, Sorensen et al 2012, Hirasawa et al 2014, Sorensen et al 2014). In this study, we used a spatially resolved MRS device with emitter distances of 2.0, 2.5, 3.0, and 3.5mm from the detector. Theoretically, the emitters closest to the detector should measure shallow oxygenation (e.g. skin, muscle, fat) which is then mathematically removed from the resultant cerebral HbO2 and dHb measurements derived from the light emitted and detected furthest from the detector (i.e. cortical tissue). While the influence of skin contamination on this particular MRS device has not been quantified, compared to other systems that have been tested (Davie and Grocott 2012, Sorensen et al 2014), this device has four emitters versus only two, increasing the likelihood that superficial tissue contamination is removed from the final measurement of cerebral tissue oxygenation.
As in any investigation utilizing TCD ultrasound, we assume the diameter of the MCA was constant throughout the investigation, so measures of blood velocity reflect blood flow. Recent studies (Coverdale et al 2014, Verbree et al 2014) using high resolution magnetic resonance imaging (MRI) technology have revealed that increases in arterial CO2 elicit MCA vasodilation (etCO2 ≥ 9mmHg above baseline), and decreases in arterial CO2 elicit MCA vasoconstriction (etCO2 13mmHg below baseline). As the OLBNP protocols did not alter etCO2, and sub-maximal LBNP elicited hypocapnia to only 8.4 ± 1.3 mmHg below baseline, it is unlikely that MCA decreased in this study; the effect of profound hypotension and resulting sympathetic activity on MCA diameter, however, has not been assessed.
Finally, in a recent review, we highlighted an emerging debate about the clinical implications of high arterial pressure and blood flow variability, and concluded that the time scale of variability may be of most importance when determining protective versus deleterious effects; short time scale variability appears to be cerebro-protective, while mid-to-longer term fluctuations are associated with primary and secondary end-organ dysfunction (Rickards and Tzeng 2014). In the current study we only assessed very short-term acute variability, on the of seconds to minutes. Perhaps of more clinical relevance may be assessment of the relationships between arterial pressure, cerebral blood flow, and cerebral tissue oxygenation variability across longer chronic time scales, such as days, weeks, or months. Nevertheless, in many neurocritical care settings, the ability to detect hemodynamic compromise within the order of minutes is paramount and there is data suggesting that even short (5 min) recordings have predictive utility (Dawson et al 2000a, 2000b).
5. Conclusions
Preservation of cerebral perfusion and oxygenation with variations in perfusion pressure is essential to the maintenance of consciousness and the survival of cerebral tissue. This study demonstrated that while arterial pressure, cerebral blood flow, and cerebral oxygenation oscillate at the same frequencies with either forced or spontaneous variability, the coupling between flow and oxygenation, and between pressure and oxygenation is consistently lower than the coupling between pressure and flow. The magnitude of oscillations in cerebral oxygen is also diminished compared with pressure and flow. We conclude that measuring variations in arterial pressure should not be regarded as a robust surrogate indicator of cerebral blood flow or brain tissue oxygenation under situations where blood pressure and cerebral perfusion may be threatened. Instead, we recommend that direct assessment of cerebral blood flow and oxygenation should be assessed whenever feasible.
Acknowledgments
CAR is responsible for conception of the work, conducting experiments, supervising data analysis, drafting the work and revising it critically for important intellectual content, and final approval of the version to be published. JDS and HBC are responsible for conducting experiments, data analysis, reviewing the work crifical.ly for important intellectual content, and final approval of the version to be published. VIX is responsible for conducting experiments, reviewing the work critically for important intellectual content and final approval of the version to be published. YCT is responsible for conception of the work, drafting the work and revising it critically for important intellectual content, and final approval of the version to be published.
We thank our subjects for their time and cheerful cooperation, and Dr Albert Yurvati, Dr Levi Rice, and Dr Sibi Thomas for their assistance with subject medical examinations. This work is supported, in part, by grants to CAR from the US Army Medical Research and Material Command (W81XWH-11-2-0137) and a University of Texas at San Antonio (UTSA) Collaborative Seed Grant. YCT is supported by grants from the New Zealand Health Research Council (Ref 11/125). The content is solely the responsibility of the authors and does not necessarily represent the official views the US Department of Defense.
References
- Anderson CS et al. 2013. Rapid blood-pressure lowering in patients with acute intracerebral hemorrhage New Engl. J. Med 368 2355–65 [DOI] [PubMed] [Google Scholar]
- Birch AA, Dirnhuber MJ, Hartley-Davies R, Iannotti F and Neil-Dwyer G 1995. Assessment of autoregulation by of changes in blood pressure Stroke 26 834–7 [DOI] [PubMed] [Google Scholar]
- Bondar RL, Kassam MS, Stein F, Dunphy PT, Fortney S and Riedesel ML 1995. Simultaneous cerebrovascular md cardiovascular responses during presyncope Stroke 26 1794–800 [DOI] [PubMed] [Google Scholar]
- Brown CM, Dutsch M, Hecht MJ, Neundorfer B and Hilz MJ 2003. Assessment of cerebrovascular and cardiovascular responses to lower body negative pressure as a test of cerebral autoregulation J. Neurol. Sci 208 71–8 [DOI] [PubMed] [Google Scholar]
- Brown CM, Dutsch M, Ohring S, Neundorfer B and Hilz MJ 2004. Cerebral autoregulation is compromised during simulated in gravitational stress Eur. J. Appl. Physiol 91 279–86 [DOI] [PubMed] [Google Scholar]
- Claassen JA, Levine BD and Zhang R 2009. Dynamic cerebral autoregulation during repeated squat-stand maneuvers J. Appl. Physiol 106 153–60 [DOI] [PMC free article] [PubMed] [Google Scholar]
- Cooke WH, Rickards CA, Ryan KL, Kuusela TA and Convertino VA 2009. Muscle sympathetic nerve activity during intense lower body negative pressure to presyncope in J. Physiol 587 4987–99 [DOI] [PMC free article] [PubMed] [Google Scholar]
- Coverdale NS, Gati JS, Opalevych O, Perrotta A and Shoemaker JK 2014. Cerebral blood flow velocity underestimates cerebral blood flow during modest hypercapnia and hypocapnia J. Appl. Physiol 117 1090–6 [DOI] [PubMed] [Google Scholar]
- Davie SN and Grocott HP 2012. Impact of extracranial contamination on regional cerebral oxygen saturation: a comparison of three cerebral oximetry technologies Anesthesiology 116 834–40 [DOI] [PubMed] [Google Scholar]
- Dawson SL, Blake MJ, Panerai RB and Potter JF 2000a. Dynamic but not static autoregulation is impaired in acute ischaemic stroke Cerebrovasc. Dis. 10 126–32 [DOI] [PubMed] [Google Scholar]
- Dawson SL, Manktelow BN, Robinson TG, Panerai RB and Potter JF 2000b. Which parameters of beat-to-beat blood pressure and variability best predict early outcome after acute ischemic stroke? Stroke 31 463–8 [DOI] [PubMed] [Google Scholar]
- Glaister DH and Miller NL 1990. Cerebral tissue oxygen status and psychomotor performance during lower body negative pressure (LBNP) Aviat. Space Environ. Med 61 99–105 [PubMed] [Google Scholar]
- Grise EM and Adeoye O 2012. Blood pressure control for acute ischemic and hemorrhagic Curr. Opin. Crit. Care 18 132–8 [DOI] [PubMed] [Google Scholar]
- Hadjiev DI and Mineva PP 2013. Elevated blood pressure management in acute ischemic remains controversial: could this issue be resolved? Med. Hypotheses 80 50–2 [DOI] [PubMed] [Google Scholar]
- Hamner JW, Cohen MA, Mukai S, Lipsitz LA and Taylor JA 2004. Spectral indices of human cerebral blood flow control: responses to augmented blood pressure oscillations. J. Physiol 559 965–73 [DOI] [PMC free article] [PubMed] [Google Scholar]
- Hirasawa A, Yanagisawa S, Tanaka N, Funane T, Kiguchi M, Sorensen H, Secher NH and Ogoh S 2014. Influence of skin blood flow and source-detector distance on near-infrared spectroscopy-determined cerebral oxygenation in humans Clin. Physiol. Funct. Imaging (at press) [DOI] [PubMed] [Google Scholar]
- Hubert GJ, Muller-Barna P and Haberl RL 2013. Unsolved issues in the management of high blood pressure in acute ischemic stroke Int. J. Hypertens 2013 349782. [DOI] [PMC free article] [PubMed] [Google Scholar]
- Jansen JR, Wesseling KT, Settels JJ and Schreuder JJ 1990. Continuous cardiac output monitoring by pulse contour during surgery Eur. Heart J 11(suppl. I) 26–32 [DOI] [PubMed] [Google Scholar]
- Johnston AJ and Czosnyka M 2003. Measuring cerebral autoregulation in stroke patients Stroke 34 e39–40 [DOI] [PubMed] [Google Scholar]
- Kamiya A et al. 2005. Low-frequency oscillation of sympathetic nerve activity decreases during development of tilt-induced syncope preceding sympathetic withdrawal and bradycardia Am. J. Physiol 289 H1758–69 [DOI] [PubMed] [Google Scholar]
- Kirkpatrick PJ, Lam J, Al-Rawi P, Smielewski P and Czosnyka M 1998. Defining thresholds for critical ischemia by using spectroscopy in the adult brain J. Neurosurg 89 389–94 [DOI] [PubMed] [Google Scholar]
- Lucas SJ, Lewis NC, E L, Thomas KN and Ainslie PN 2013. Slow breathing as a means to improve orthostatic tolerance: a randomized sham-controlled trial J. Appl. Physiol 115 202–11 [DOI] [PubMed] [Google Scholar]
- Madsen P, Lyck F, Pedersen M, Olesen HL, Nielsen H and Secher NH 1995. Brain and muscle oxygen saturation during head-up-tilt-induced central hypovolaemia in humans Clin. Physiol. 15 523–33 [DOI] [PubMed] [Google Scholar]
- Madsen PL and Secher NH 1999. Near-infrared oximetry of the brain Prog. Neurobiol. 58 541–60 [DOI] [PubMed] [Google Scholar]
- Oudegeest-Sander MH, van Beek AH, Abbink K, Olde Rikkert MG, Hopman MT and Claassen JA 2014. Assessment of dynamic cerebral autoregulation and cerebrovascular CO2 reactivity in ageing by measurements of blood flow md cortical oxygenation Exp. Physiol 99 586–98 [DOI] [PubMed] [Google Scholar]
- Panerai RB, Hudson V, Fan L, Mahony P, Yeoman PM, Hope T and Evans DH 2002. Assessment of dynamic cerebral autoregulation based on spontaneous fluctuations in arterial blood pressure and intracranial pressure Physiol. Meas. 23 59–72 [DOI] [PubMed] [Google Scholar]
- Pollard V, Prough S, DeMelo AE, Deyo DJ, Uchida T and Stoddart HF 1996. Validation in volunteers of a near-infrared spectroscope for monitoring brain oxygenation in vivo Anesth. Analg. 82 269–77 [DOI] [PubMed] [Google Scholar]
- Reinhard M, Roth M, Guschlbauer B, Harloff A, Timmer J, Czosnyka M and Hetzel A 2005. Dynamic cerebral autoregulation in ischemic stroke assessed from spontaneous blood pressure fluctuations Stroke 36 1684–9 [DOI] [PubMed] [Google Scholar]
- Reinhard M, Wehrle-Wieland E, Grabiak D, Roth M, Guschlbauer B, Timmer J, Weiller C and Hetzel A 2006. Oscillatory cerebral hemodynamics–the macro- versus microvascular level J. Neuml. Sci 250 103–9 [DOI] [PubMed] [Google Scholar]
- Rickards CA, Ryan KL, Cooke WH and Convertino VA 2011. Tolerance to central hypovolemia: the influence of oscillations in pressure and blood velocity J. Appl. Physiol 111 1048–58 [DOI] [PubMed] [Google Scholar]
- Rickards CA and Tzeng YC 2014. Arterial pressure and cerebral blood flow variability: friend or foe? A review Front. Physiol 5 120. [DOI] [PMC free article] [PubMed] [Google Scholar]
- Sorensen H, Rasmussen P, Siebenmann C, Zaar M, Hvidtfeldt M, Ogoh S, Sato K, Kohl-Bareis M, Secher NH and Lundby C 2014. Extra-cerebral oxygenation influence on near-infrared-spectroscopy-determined frontal lobe oxygenation in healthy volunteers: a comparison between INVOS-4100 and NIRO-200NX Clim. Physiol. Funct. Imaging (at press) [DOI] [PubMed] [Google Scholar]
- Sorensen H, Secher NH, Siebenmann C, Nielsen HB, Kohl-Bareis M, Lundby C and Rasmussen P 2012. Cutaneous vasoconstriction affects near-infrared spectroscopy determined cerebral oxygen saturation during administration of norepinephrine Anesthesiology 117 263–70 [DOI] [PubMed] [Google Scholar]
- Tachtsidis I, Elwell CE, Leung TS, Lee C-W, Smith M and Delpy DT 2004. Investigation of cerebral haemodynamics by near-infrared spectroscopy in young healthy volunteers reveals posture-dependent spontaneous oscillations Physiol. Meas. 25 437–45 [DOI] [PubMed] [Google Scholar]
- Tobias JD 2008. Cerebral oximetry monitoring with near infrared spectroscopy detects alterations in oxygenation before pulse oximetry J. Intensive Care Med 23 384–8 [DOI] [PubMed] [Google Scholar]
- Tzeng YC, Ainslie PN, Cooke WH, Peebles KC, Willie CK, MacRae BA, Smirl JD, Horsman HM and Rickards CA 2012. Assessment of cerebral autoregulation: the quandary of quantification Am. J. Physiol 303 H658–71 [DOI] [PubMed] [Google Scholar]
- Tzeng YC, Chan GS, Willie CK and Ainslie PN 2011. Determinants of human cerebral pressure-flow velocity relationships: new insights from vascular modelling and Ca2+ channel blockade J. Physiol 589 3263–74 [DOI] [PMC free article] [PubMed] [Google Scholar]
- van Beek AH, Lagro J, Olde-Rikkert MG, Zhang R and Claassen JA 2012. Oscillations in cerebral blood flow and cortical oxygenation in Alzheimer’s disease Neurobiol. Aging 33 428 e21–31 [DOI] [PubMed] [Google Scholar]
- van Lieshout JJ, Wieling W, Karemaker JM and Secher NH 2003. Syncope, cerebral perfusion, and oxygenation J. Appt. Physiol 94 833–48 [DOI] [PubMed] [Google Scholar]
- Verbree J, Bronzwaer AS, Ghariq E, Versluis MJ, Damen MJ, van Buchem MA, Dahan A, Van Lieshout JJ and van Osch MJ 2014. Assessment of middle cerebral artery diameter during hypocapnia and hypercapnia in humans using ultra high-field MRI J. Appl. Physiol 117 1084–9 [DOI] [PubMed] [Google Scholar]
- Zhang R, Zuckerman JH, Giller CA and Levine BD 1998a. Transfer function analysis of dynamic cerebral autoregulation in humans Am. J. Physiol 274 H233–41 [DOI] [PubMed] [Google Scholar]
- Zhang R, Zuckerman JH and Levine BD 1998b. Deterioration of autoregulation during orthostatic stress: insights from the frequency domain J. Appl. Physiol 85 1113–22 [DOI] [PubMed] [Google Scholar]