

Abstract
At the end of 2019, a novel coronavirus, designated as SARS-CoV-2, emerged in Wuhan, China and was identified as the causal pathogen of COVID-19. The epidemic scale of COVID-19 has increased dramatically, with confirmed cases increasing across China and globally. Understanding the potential affecting factors involved in COVID-19 transmission will be of great significance in containing the spread of the epidemic. Environmental and meteorological factors might impact the occurrence of COVID-19, as these have been linked to various diseases, including severe acute respiratory syndrome (SARS) and Middle East respiratory syndrome (MERS), whose causative pathogens belong to the same virus family as SARS-CoV-2. We collected daily data of COVID-19 confirmed cases, air quality and meteorological variables of 33 locations in China for the outbreak period of 29 January 2020 to 15 February 2020. The association between air quality index (AQI) and confirmed cases was estimated through a Poisson regression model, and the effects of temperature and humidity on the AQI-confirmed cases association were analyzed. The results show that the effect of AQI on confirmed cases associated with an increase in each unit of AQI was statistically significant in several cities. The lag effect of AQI on the confirmed cases was statistically significant on lag day 1 (relative risk (RR) = 1.0009, 95% confidence interval (CI): 1.0004, 1.0013), day 2 (RR = 1.0007, 95% CI: 1.0003, 1.0012) and day 3 (RR = 1.0008, 95% CI: 1.0003, 1.0012). The AQI effect on the confirmed cases might be stronger in the temperature range of 10 °C ≤ T < 20 °C than in other temperature ranges, while the RR of COVID-19 transmission associated with AQI was higher in the relative humidity (RH) range of 10% ≤ RH < 20%. Results may suggest an enhanced impact of AQI on the COVID-19 spread under low RH.
Keywords: COVID-19, Transmission, Air quality, Aerosol, Relative humidity, Temperature
Graphical abstract

Highlights
-
•
AQI - COVID-19-confirmed cases association is statistically significant in some cities.
-
•
Lag effect of AQI on confirmed cases is statistically significant on lag 1–3 days.
-
•
AQI effect on the confirmed cases in temperature range of 10–20 °C may be stronger.
-
•
Impact of AQI on the spread of COVID-19 may be enhanced under low relative humidity.
1. Introduction
Human beings have suffered two large-scale outbreaks of pneumonia caused by coronavirus in the first two decades of 21th century, caused by severe acute respiratory syndrome coronavirus (SARS-CoV) (Drosten et al., 2003), and Middle East respiratory syndrome coronavirus (MERS-CoV) (Zaki et al., 2012). In December 2019, 27 patients with pneumonia infection of unknown etiology were reported in the city of Wuhan, Hubei Province, China (Huang et al., 2020). Later, on 7 January, a novel coronavirus termed Severe Acute Respiratory Syndrome Coronavirus 2 (SARS-CoV-2), was identified as the causative pathogen of COVID-19 (Lu et al., 2020). Clinically, the common symptoms of COVID-19 appear to be fever, cough, myalgia or fatigue, hemoptysis, diarrhea, dyspnea, lymphopenia and kidney failure (Chen et al., 2020). More recently, anosmia and other forms of olfactory dysfunction in COVID-19 patients (Bagheri et al., 2020; Brann et al., 2020) were identified. Early confirmed cases of COVID-19 were speculated to have had contact history with a seafood market in Wuhan (Zhou et al., 2020a, Zhou et al., 2020b). Soon, human-to-human transmission was revealed through detection of infection in at least one household cluster (Chan et al., 2020) and in health workers caring for COVID-19 patients (Wang et al., 2020). There has been a rapid increase in COVID-19 confirmed cases since the identification of SARS-CoV-2. As of 15 February 2020, 68,500 cumulative confirmed cases and 1665 deaths have been documented domestically (NHC, 2020b), and 528 cases and 2 deaths were reported out of China (WHO, 2020b). The World Health Organization declared the COVID-19 epidemic a public health emergency of international concern on 30 January 2020 (WHO, 2020a). Respiratory viruses, such as SARS-CoV and MERS-CoV, contained in infectious droplets and body fluids are capable of contaminating the human conjunctival epithelium and inducing complications in infected patients, thus leading to respiratory infection (Belser et al., 2013; Olofsson et al., 2005). The transmission of SARS-CoV-2 between humans may occur by three routes (NHC, 2020a): 1) direct transmission via inhalation of respiratory droplets (coughs or sneezes by infected patients in close proximity); 2) contact transmission through touch of a surface or object contaminated with the virus; and 3) aerosol transmission in confined spaces. An early study by Liu et al. (2020) suggests an even more severe transmissibility than SARS-CoV (Liu et al., 2020).
There is significant evidence that air pollution is associated with premature mortality (Lelieveld et al., 2015; Giannadaki et al., 2014) and adverse health effects (West et al., 2013; Hirabayashi and Nowak, 2016). A global estimate showed that 4.3 million deaths occurred as a result of deteriorated air quality (Lelieveld, 2017; Cohen et al., 2017). Elevated nitrogen oxides (NOx) and particulate matter (PM) concentrations have been linked to increased incidence rates of cardiovascular and pulmonary diseases, asthma, diabetes and cancers (Shiraiwa et al., 2017; Hertel et al., 2013). Specifically, air pollution has been linked to virus-induced diseases, such as influenza (Chen et al., 2010; Thach et al., 2010), pneumonia and acute lower respiratory infections (Horne et al., 2018; Glass and Rosenthal, 2018), and severe acute respiratory syndrome (SARS) (Cui et al., 2003). A positive association between air quality and SARS case fatality was identified by Cui et al. (2003). As a major air pollutant, particulate matter (PM) is capable of remaining airborne for a long period (Cowling et al., 2013; Kim et al., 2015). Infectious virus and viral RNA can be detected on particles with aerodynamic diameters larger and smaller than 5 μm (Milton et al., 2013; Lindsley et al., 2010). PM of 5 μm or less in diameter attached with viruses can be inhaled and penetrated deep into the respiratory tract and to the alveolar region (30% penetration for 5 μm particles). Inside the human body, viral agents attached on the PM can be delivered directly to the respiratory epithelial cells and translocated to other organs (Nemmar, 2004; Tellier, 2009), thus inducing infections and various health effects. Particularly, airborne PM2.5 (PM with aerodynamic diameter ≤ 2.5 μm) has been reported to be associated with daily human influenza cases (Lindsley et al., 2010; Liang et al., 2014;) and respiratory syncytial virus infection (Vandini et al., 2013; Nenna et al., 2017). Moreover, SARS mortality was found to be positively correlated with PM with aerodynamic diameter smaller than 10 μm (PM10). Additionally, meteorological conditions, such as temperature and humidity are associated with the spread of numerous viral diseases, such as influenza and respiratory syncytial virus (Bloom-Feshbach et al., 2013; Lowen et al., 2007), SARS and MERS (Lin et al., 2006; Gardner et al., 2019). Epidemiological studies have shown that lower temperature may increase the risk of transmission for both SARS and MERS (Lin et al., 2006; Gardner et al., 2019), and infection with MERS-CoV is more likely to occur under dry conditions (Gardner et al., 2019).
Although much more about COVID-19 remains to be learned, the causal pathogen, SARS-CoV-2 belongs to the same virus family as SARS-CoV and MERS-CoV, and all three of these coronaviruses have been identified to be capable of airborne transmission (Zhou et al., 2020a; Yu et al., 2004; Zumla and Hui, 2014). Moreover, the transmission of SARS and MERS has been associated with air quality and meteorological conditions (Cui et al., 2003; Lin et al., 2006; Gardner et al., 2019). Therefore, it is reasonable to speculate that environmental and meteorological factors might affect the spread of COVID-19.
The spread of the COVID-19 epidemic has significantly declined in some counties, e.g., in China, due to unprecedented nationwide interventions. However, the COVID-19 outbreak shows no signs of slowing down from a global perspective. A more comprehensive understanding of COVID-19, including the possible potential impacts of environmental factors, would be of significance for containing its spread. Therefore, this study focuses on analyzing the association between the air quality index (AQI) and the confirmed cases of COVID-19 and investigating the effect of temperature and humidity on the AQI - COVID-19-confirmed case association.
2. Method and material
2.1. Study data
The time-series daily data including number of cumulative confirmed case of COVID-19, air quality and meteorological variables of 33 locations in China for the outbreak period of 29 January 2020 to 15 February 2020 were collected.
COVID-19 patients were diagnosed and confirmed according to the diagnosis and treatment guidelines for novel coronavirus-infected pneumonia (various versions) issued by the National Health Commission of China (NHC). China established a reporting system of infectious diseases and public health emergencies after the SARS epidemic (Wang et al., 2015). Since the outbreak of the COVID-19 epidemic, the daily, and even 12-hourly confirmed cases (mild, moderate, severe and critical), suspected cases, close contact cases, and deaths were reported to Health Commissions at all stages (county level, municipal, provincial and national). The COVID-19 patient numbers of the 33 cities were derived from the Health Commissions at the municipal and provincial levels.
Air quality is monitored in China through a monitoring network covering four levels: national, provincial, municipal and county level. There are 1436 urban air quality monitoring stations located in 338 cities of prefecture-level or higher, 96 in rural areas and 15 background stations (MEE, 2016). Air pollutants, including sulfur dioxide (SO2), nitrogen dioxide (NO2), particulates with aerodynamic diameter <10 μm (PM10) and 2.5 μm (PM2.5), carbon monoxide (CO), and ozone (O3), are measured hourly using automatic instruments according to technical protocols of the Ministry of Ecology and Environment of China (MEE). Quality assurance and quality control procedures follow the standards and requirements regulated by the MEE. The AQI has been adopted in China, whose level is determined on the basis of the levels of six monitored atmospheric pollutants. The AQI demonstrates a direct indication of how clear or polluted the air is and the associated potential health risk (MEE, 2012). For instance, an AQI value of 0 to 50 indicates good air quality with low possibility of affecting public health. As the AQI values become higher, they imply more severe health concerns (51–100, moderate; 101–150, unhealthy for sensitive groups; 151–200, unhealthy, 201–300, very unhealthy; >300, hazardous). The daily AQI and other pollutants in each city are broadcasted by the environmental official departments and the China National Environmental Monitoring Center (CNEMC). We extracted daily averages of air quality data, including AQI, PM2.5, PM10, NO2, SO2 and O3-8h over the study period from a data platform (https://www.aqistudy.cn/historydata/), whose data are recorded from an air quality data publishing platform operated by CNEMC.
Weather variables, including temperature, relative humidity, atmospheric pressure, and wind speed, were obtained as daily averages (mean daily values are derived by averaging the hourly values when the average daily data are not available, from a meteorological data provider (http://hz.zc12369.com/home/) and the China Meteorological Data Service Center (http://data.cma.cn/en)). Meteorological variable, air quality data and number of COVID-19 confirmed cases are summarized as the mean daily averages over the study period in the Supporting Information (SI).
2.2. Analytical method
The time-series Poisson regression, which has been frequently used in corresponding studies (Gasparrini et al., 2012, Gasparrini et al., 2015; Guo et al., 2013), is used in this study. Since the weather conditions are correlated with health effects and the impact may last for a few days (Patz et al., 2000; Peng et al., 2006), the meteorological factors, including daily mean temperature (T), relative humidity (RH), atmospheric pressure and wind speed, are controlled for eliminating the potential confounding effects, with a seven-day moving average and a natural cubic spline with three degrees of freedom (Chen et al., 2017; Gasparrini, 2014). The association between AQI and the confirmed cases of COVID-19 is investigated by estimating the effect of AQI on the confirmed cases associated with an increase in each AQI unit, which is referred to as relative risk (RR).
To characterize the lag associations between AQI and the number of COVID-19 confirmed cases, the associations were examined using a lag model (from lag 0 to lag 7). The lag-response association suggests the temporal variation in risk after a specific exposure, and it reveals the distribution of current and delayed effects that accumulate across the lag period (Gasparrini et al., 2015). While exploring the possible effect of ambient temperature and humidity on the associations between AQI and confirmed cases of COVID-19, an interactive term between AQI and confirmed cases of COVID-19 was added on the basis of daily temperature and humidity. The daily temperature and relative humidity during the study period are categorized in different range groups (see Table 2, Table 3), and the temperature range of 20 °C < T ≤ 24.9 °C during the study period and the relative humidity range of 10% ≤ RH < 20% (RH below 10% not appeared) are considered as the reference group for the effect estimation. Data were analyzed using R version 3.6.2 (R Core Team, 2019) and the supplementary package of ‘dnlm’.
Table 2.
Effect of different temperature ranges on AQI – COVID 19 confirmed cases association.
| Temperature range | Relative risk, 95% CI |
|---|---|
| T < −20 °C (− 22.8 ≤ °C T < −20 °C) | 1 (1, 1) (reference group) |
| −20 °C ≤ T < −10 °C | 1.0039684 (1.00114264, 1.00704327) |
| −10 °C ≤ T < 0 °C | 1.00711894 (1.0044128, 1.01009672) |
| 0 °C ≤ T < 10 °C | 1.00635137 (1.00372986, 1.00925885) |
| 10 °C ≤ T < 20 °C | 1.00886322 (1.00613776, 1.01185857) |
| T ≥ 20 °C (20 °C ≤ T < 24.9 °C) | 1.00646535 (1.00396607, 1.00897226) |
Table 3.
Effect of different humidity ranges on AQI – COVID 19 confirmed cases association.
| Humidity range | Relative risk, 95% CI |
|---|---|
| 10% ≤ RH < 20% | 1 (1, 1) (reference group) |
| 20% ≤ RH < 40% | 0.99327799 (0.86661034, 1.15354) |
| 40% ≤ RH < 60% | 0.99077184 (0.86443011, 1.15062239) |
| 60% ≤ RH < 80% | 0.98974706 (0.86353798, 1.14943006) |
| 80% ≤ RH ≤ 100% | 0.98975936 (0.86354868, 1.14944439) |
3. Results
Fig. 1A illustrates the spatial distribution of AQI in investigated cities, from which a geographical heterogeneity was observed. The highest levels of AQI were represented by cities located in western and northern regions of China, such as Urumqi, Shijiazhuang and Xi'an, all of them are inland cities, while cities with lower AQI are mostly located in the south of China, and mostly in coastal areas, e.g., Shenzhen, Sanya and Guiyang. During the period of study, the highest AQI was recorded in Urumqi, whereas the lowest was represented by Shenzhen among the 33 investigated locations. As detailed in Fig. 1B, the number of COVID-19 patients appears to be higher in cities like Chongqing, Wenzhou, Shenzhen, Beijing and Shanghai, which are economically more capable, while cities such as Lhasa, Ordos, and Xining reported much fewer confirmed cases of COVID-19; these cities are located in west or north-west of China and are economically less developed. The largest count of confirmed new cases (60 cases) was reported in Shenzhen on 31 January 2020, while in cities such as Lhasa, Kunming and Shenyang, no new cases were observed on some days during the observation period (e.g., Kunming on 9 and 14 February 2020). Specifically, until 15 February 2020, only 1 case of COVID-19 patient was confirmed in Lhasa. In total, there were 4883 confirmed cased in the investigated cities.
Fig. 1.
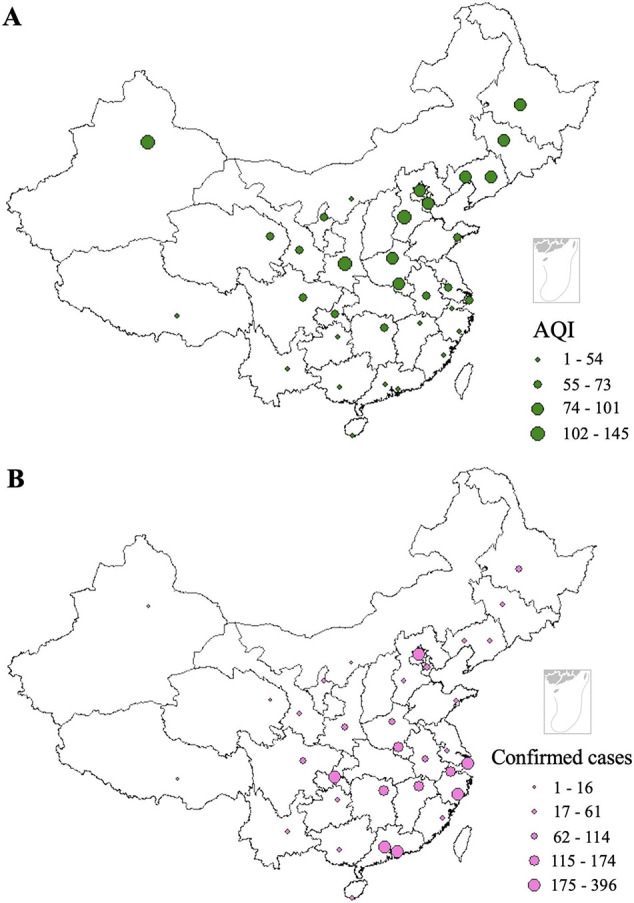
Spatial distribution of (A) mean daily averages of AQI and (B) COVID-19 confirmed cases during the study period.
Air quality data are correlated with meteorological parameters (Kumar and Goyal, 2011; Luo et al., 2017). The Pearson correlations of AQI and meteorological variables over the study period are summarized in Table 1 . The AQI was statistically significantly negatively correlated with temperature and wind speed (r = −0.30, and − 0.20, respectively), while no significant correlation was observed with atmospheric pressure. There was a strong correlation between relative humidity and atmospheric pressure (r = 0.53) and temperature (r = 0.42), while weak or no significant correlations were observed between other meteorological factors.
Table 1.
Correlation of AQI and meteorological variables.
| Factors | AQI | Temperature | Relative humidity | Wind speed | Atmospheric pressure |
|---|---|---|---|---|---|
| AQI | 1.00 | ||||
| Temperature | −0.30** | 1.00 | |||
| Relative humidity | −0.08* | 0.42** | 1.00 | ||
| Wind speed | −0.20** | 0.05 | 0.07 | 1.00 | |
| Atmospheric pressure | 0.08 | 0.21** | 0.53** | 0.06 | 1.00 |
**: P < 0.01, P* < 0.05.
The association between AQI and count of confirmed COVID-19 cases, considered as relative risk, for each individual location is detailed in Fig. 2 . The relative risk estimated is variable by cities. Statistically significant correlations between AQI and count of confirmed cases were observed in Jinzhong (RR = 1.008, 95% CI: 1.003, 1.014), Beijing (RR = 1.006; 95% CI: 1.005, 1.008), Tianjin (RR = 1.005, 95% CI: 1.004, 1.006) and Xi'an (RR = 1.003; 95% CI: 1.001, 1.005), which are located in the north and north-west of China, whereas no statistical significance was detected for cities such as Lanzhou (RR = 0.989, 95% CI: 0.978, 0.999), Changsha (RR: 0.990, 95% CI: 0.989, 0.993), Nanning (RR = 0.991, 95% CI: 0.987, 0.996) and Changchun (RR: 0.993, 95% CI: 0.989, 0.996), most of which are located in the southern region of China.
Fig. 2.

Association of COVID-19 confirmed cases and increase of each AQI unit for different cities.
Fig. 3 demonstrates the lag association of AQI and the number of confirmed COVID-19 cases. The effect of AQI on the COVID-19 confirmed cases was statistically significant at lag day 1 (RR = 1.0009, 95% CI: 1.0004, 1.0013), day 2 (RR = 1.0007, 95% CI: 1.0003, 1.0012) and day 3 (RR = 1.0008, 95% CI: 1.0003, 1.0012), indicating a significant association of the effect of AQI on the COVID-19-confirmed cases at lag 1–3 days.
Fig. 3.
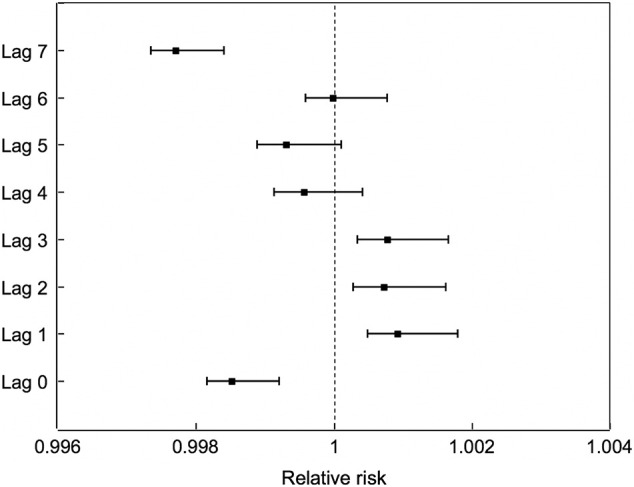
Association of COVID-19 confirmed cases and increase of each AQI unit on different lag days.
Table 2, Table 3 detail the results of the effects of temperature and relative humidity on the association of AQI and the count of confirmed COVID-19 cases. The effect of AQI on the confirmed COVID-19 cases in the temperature range of 10 °C ≤ T < 20 °C might be stronger (with higher RR value) than in other temperature ranges. With regard to the effect of AQI on the COVID-19-confirmed cases in different humidity ranges, the RR values were lower in the relative humidity ranges of 20% ≤ RH < 40%, 40% ≤ RH < 60%, 60% ≤ RH < 80% and 80% ≤ RH ≤ 100% than in the range of 10% ≤ RH < 20%, indicating an enhanced effect of AQI on the confirmed cases under lower RH. This may reflect the fact that viruses (such as respiratory virus and SARS-CoV) (Paynter, 2015; Chan et al., 2011) have better stability under low humidity, resulting in strengthened transmission capability.
4. Discussion
Identifying the key factors that impact the spread of COVID-19 will be of great significance in containing the spread of the COVID-19 epidemic. Generally, infectious agent, host and environment are the three factors that affect the epidemiology of transmissible diseases (Lin et al., 2006). Since respiratory diseases are more common in late winter and early spring, such as SARS (Lin et al., 2006; Cui et al., 2003), the occurrence of COVID-19 might, partially, be subjected to environmental and meteorological conditions.
Both long- and short-term exposure to air pollution has been associated with a variety of adverse health effects, including acute respiratory inflammation, asthma and chronic obstructive pulmonary disease (COPD) (McConnell et al., 2010; Sarnat et al., 2012; Gan et al., 2013; Andersen et al., 2011), and SARS (Cui et al., 2003). Although the mechanisms for a causal association between air quality and SARS-CoV-2 transmission could be complicated, previous studies may provide clues. Viruses are among the smallest of common primary aerosol particle classes, with physical diameters as low as 20 nm (Duan, 2008), e.g., SARS-CoV-2 has enveloped virions that measure approximately 50–200 nm (Xu et al., 2020). However, viruses are not commonly airborne as independent individuals and are more likely attached to other suspended particles (Yang et al., 2011; Chen et al., 2010), such as PM2.5. Particles that are small enough will remain airborne for a long period of time because of their low settling velocity, e.g., a 3-m fall takes 67 min for a 5-μm particle (Tellier, 2009). Hence, the air pollutant concentration, such as PM2.5 and PM10 concentrations, may affect the aerosol transmission of SARS-CoV-2. Fine particles with viruses attached can be inhaled, resulting in the direct delivery of the viral agents to the respiratory epithelial cells (Chen et al., 2010; Jaspers et al., 2005). PM10 has been speculated to impact the transmission of SARS (Cui et al., 2003). Additionally, studies have revealed that both Na+ and Cl− ions can interact with virus lipid bilayers (Valley et al., 2011), while Mg+ and Ca2+ can induce structural and mechanical changes in lipid bilayers through strong binding (Cordomí et al., 2008; Lee et al., 2008). Thus, chemical components of airborne particles may affect the virus inactivation and the transmission capability. Exhaled viruses in airborne environments are generally coated with saliva or mucus that serve as a resistance against environmental extremes (Tang, 2009). High temperature may affect the survival of viruses, as it can impact the state of viral proteins (including enzymes) and genome (RNA or DNA) (Tang, 2009). A number of studies have emphasized the correlation of temperature and health (Deschenes, 2014; Stafoggia et al., 2008; Gasparrini et al., 2015), e.g., primary MERS human cases in Saudi Arabia were more likely to occur in cold conditions (Gardner et al., 2019), and there was a much higher risk of increased daily SARS incidence on days with lower temperature (Lin et al., 2006).
Many airborne viruses have been shown to be sensitive to ambient humidity, which has been hypothesized to be attributed to virus inactivation resulting from the removal of structural water molecules from the virus's capsid (Yang and Marr, 2012) and damage to the virus on the surface of aerosol due to surface tension, shear stress, and conformational rearrangement driven by hydrophobicity. Generally, enveloped viruses (such as SARS-CoV-2) (Xu et al., 2020), which contain a lipid membrane, survive better at lower relative humidity (Sobsey and Meschke, 2003), e.g., more MERS cases were likely to occur under dry conditions (Gardner et al., 2019), while nonenveloped viruses tend to be more stable at higher RH (Sobsey and Meschke, 2003). In this study, the effect of humidity on confirmed cases of COVID-19 and AQI correlation might be enhanced under lower RH ranges. However, many exceptions have been identified and remain unexplained (Lakadamyali et al., 2003; Laliberte et al., 2011). As a novel coronavirus, the effect of humidity on the spread of COVID-19 deserves further investigation.
Several limitations in this study must be acknowledged. First, the reproductive number (R0) of SARS-CoV-2, which has been estimated to be much higher than that of SARS-CoV (Liu et al., 2020), and the controlling measures imposed by the governments of all stages have not been accounted for in this study. Second, data at the individual level are not accessible; as such, the effects or confounding effects of potential factors affecting COVID-19 infection, such as age, gender, medical history and smoking status, could not be assessed. Additionally, the difference in medical competence and socioeconomic by region might also affect the number of COVID-19 patients. Nevertheless, efforts in attempting to analyze the possible environmental and meteorological impacts might be significant in protecting medical professionals and in containing the COVID-19 epidemic. Future studies with more detailed consideration of the epidemiological parameters of COVID-19, such as reproductive number, hospitalization period, case fatality proportion, individual air pollutants (e.g., PM2.5, PM10 and O3), and social circumstance, might be more helpful.
5. Conclusion
In this study, the data of COVID-19 confirmed cases in 33 locations in China, together with air quality and meteorological data for the COVID-19 outbreak period of 29 January 2020 to 15 February 2020, were collected. The association between the confirmed cases and AQI is analyzed. The results of this study suggest that the AQI was statistically significantly associated with confirmed cases of COVID-19 in several cities, such as Jinzhong and Beijing. The AQI effect on COVID-19 spread was statistically significant on lag day 1, lag day 2 and lag day 3. Examination of temperature and humidity effect on the AQI - confirmed case association shows that the relative risk of COVID-19 transmission associated with AQI was higher in the temperature range 10 °C ≤ T < 20 °C, and the AQI might have a stronger effect on the confirmed cases in the relative humidity range of 10% ≤ RH < 20%.
Declaration of competing interests
The authors declare that they have no known competing financial interests or personal relationships that could have appeared to influence the work reported in this paper.
CRediT authorship contribution statement
Hao Xu:Conceptualization, Methodology, Writing - original draft.Chonghuai Yan:Writing - review & editing, Validation.Qingyan Fu:Methodology, Writing - review & editing.Kai Xiao:Data curation.Yamei Yu:Data curation, Visualization.Deming Han:Software.Wenhua Wang:Writing - review & editing.Jinping Cheng:Conceptualization, Supervision.
Acknowledgements
This work was supported by the Key Philosophy and Social Science Research Project of Ministry of Education of China (No. 17JZD025), the National Natural Science Foundation of China (No. 21777094), and the Institute of Urban Governance at Shanghai Jiao Tong University (Key Special Project of China, No. SJTU-2019UGBD-01). We appreciate greatly the funding support. Moreover, we would like to express our sincerest and greatest gratitude and respect to the medical professionals and all those fighting the COVID-19 epidemic.
Editor: Damia Barcelo
Footnotes
Supplementary data to this article can be found online at https://doi.org/10.1016/j.scitotenv.2020.139211.
Appendix A. Supplementary data
Supplementary tables
References
- Andersen Z.J., Hvidberg M., Jensen S.S., Ketzel M., Loft S., Sørensen M., Tjønneland A., Overvad K., Raaschou-Nielsen O. Chronic obstructive pulmonary disease and long-term exposure to traffic-related air pollution: a cohort study. Am. J. Respir. Crit. Care Med. 2011;183:455–461. doi: 10.1164/rccm.201006-0937OC. [DOI] [PubMed] [Google Scholar]
- Bagheri S.H.R., Asghari A.M., Farhadi M., Shamshiri A.R., Kabir A., Kamrava S.K., Jalessi M., Mohebbi A., Alizadeh R., Honarmand A.A., Ghalehbaghi B., Salimi A. Coincidence of COVID-19 epidemic and olfactory dysfunction outbreak (preprint) Otolaryngology. 2020 doi: 10.1101/2020.03.23.20041889. [DOI] [PMC free article] [PubMed] [Google Scholar]
- Belser J.A., Rota P.A., Tumpey T.M. Ocular tropism of respiratory viruses. Microbiol. Mol. Biol. Rev. 2013;77:144–156. doi: 10.1128/MMBR.00058-12. [DOI] [PMC free article] [PubMed] [Google Scholar]
- Bloom-Feshbach K., Alonso W.J., Charu V., Tamerius J., Simonsen L., Miller M.A., Viboud C. Latitudinal variations in seasonal activity of influenza and respiratory syncytial virus (RSV): a global comparative review. PLoS One. 2013;8 doi: 10.1371/journal.pone.0054445. [DOI] [PMC free article] [PubMed] [Google Scholar]
- Brann D., Tsukahara T., Weinreb C., Logan D.W., Datta S.R. Non-neural expression of SARS-CoV-2 entry genes in the olfactory epithelium suggests mechanisms underlying anosmia in COVID-19 patients (preprint) Neuroscience. 2020 doi: 10.1101/2020.03.25.009084. [DOI] [Google Scholar]
- Chan J.F.-W., Yuan S., Kok K.-H., To K.K.-W., Chu H., Yang J., Xing F., Liu J., Yip C.C.-Y., Poon R.W.-S., Tsoi H.-W., Lo S.K.-F., Chan K.-H., Poon V.K.-M., Chan W.-M., Ip J.D., Cai J.-P., Cheng V.C.-C., Chen H., Hui C.K.-M., Yuen K.-Y. A familial cluster of pneumonia associated with the 2019 novel coronavirus indicating person-to-person transmission: a study of a family cluster. Lancet. 2020;395:514–523. doi: 10.1016/S0140-6736(20)30154-9. [DOI] [PMC free article] [PubMed] [Google Scholar]
- Chan K.H., Peiris J.S.M., Lam S.Y., Poon L.L.M., Yuen K.Y., Seto W.H. The effects of temperature and relative humidity on the viability of the SARS coronavirus. Adv. Virol. 2011;2011:1–7. doi: 10.1155/2011/734690. [DOI] [PMC free article] [PubMed] [Google Scholar]
- Chen G., Zhang W., Li S., Williams G., Liu C., Morgan G.G., Jaakkola J.J.K., Guo Y. Is short-term exposure to ambient fine particles associated with measles incidence in China? A multi-city study. Environ. Res. 2017;156:306–311. doi: 10.1016/j.envres.2017.03.046. [DOI] [PubMed] [Google Scholar]
- Chen N., Zhou M., Dong X., Qu J., Gong F., Han Y., Qiu Y., Wang J., Liu Y., Wei Y., Xia J., Yu T., Zhang X., Zhang L. Epidemiological and clinical characteristics of 99 cases of 2019 novel coronavirus pneumonia in Wuhan, China: a descriptive study. Lancet. 2020;395:507–513. doi: 10.1016/S0140-6736(20)30211-7. [DOI] [PMC free article] [PubMed] [Google Scholar]
- Chen P.-S., Tsai F.T., Lin C.K., Yang C.-Y., Chan C.-C., Young C.-Y., Lee C.-H. Ambient influenza and avian influenza virus during dust storm days and background days. Environ. Health Perspect. 2010;118:1211–1216. doi: 10.1289/ehp.0901782. [DOI] [PMC free article] [PubMed] [Google Scholar]
- Cohen A.J., Brauer M., Burnett R., Anderson H.R., Frostad J., Estep K., Balakrishnan K., Brunekreef B., Dandona L., Dandona R., Feigin V., Freedman G., Hubbell B., Jobling A., Kan H., Knibbs L., Liu Y., Martin R., Morawska L., Pope C.A., Shin H., Straif K., Shaddick G., Thomas M., van Dingenen R., van Donkelaar A., Vos T., Murray C.J.L., Forouzanfar M.H. Estimates and 25-year trends of the global burden of disease attributable to ambient air pollution: an analysis of data from the Global Burden of Diseases Study 2015. Lancet. 2017;389:1907–1918. doi: 10.1016/S0140-6736(17)30505-6. [DOI] [PMC free article] [PubMed] [Google Scholar]
- Cordomí A., Edholm O., Perez J.J. Effect of ions on a dipalmitoyl phosphatidylcholine bilayer. A molecular dynamics simulation study. J. Phys. Chem. B. 2008;112:1397–1408. doi: 10.1021/jp073897w. [DOI] [PubMed] [Google Scholar]
- Cowling B.J., Ip D.K.M., Fang V.J., Suntarattiwong P., Olsen S.J., Levy J., Uyeki T.M., Leung G.M., Malik Peiris J.S., Chotpitayasunondh T., Nishiura H., Mark Simmerman J. Aerosol transmission is an important mode of influenza a virus spread. Nat. Commun. 2013;4 doi: 10.1038/ncomms2922. [DOI] [PMC free article] [PubMed] [Google Scholar]
- Cui Y., Zhang Z.-F., Froines J., Zhao J., Wang H., Yu S.-Z., Detels R. Air pollution and case fatality of SARS in the People’s Republic of China: an ecologic study. Environ. Health. 2003;2 doi: 10.1186/1476-069X-2-15. [DOI] [PMC free article] [PubMed] [Google Scholar]
- Deschenes O. Temperature, human health, and adaptation: a review of the empirical literature. Energy Econ. 2014;46:606–619. doi: 10.1016/j.eneco.2013.10.013. [DOI] [Google Scholar]
- Drosten C., Günther S., Preiser W., van der Werf S., Brodt H.-R., Becker S., Rabenau H., Panning M., Kolesnikova L., Fouchier R.A.M., Berger A., Burguière A.-M., Cinatl J., Eickmann M., Escriou N., Grywna K., Kramme S., Manuguerra J.-C., Müller S., Rickerts V., Stürmer M., Vieth S., Klenk H.-D., Osterhaus A.D.M.E., Schmitz H., Doerr H.W. Identification of a novel coronavirus in patients with severe acute respiratory syndrome. N. Engl. J. Med. 2003;348:1967–1976. doi: 10.1056/NEJMoa030747. [DOI] [PubMed] [Google Scholar]
- Duan D. 2008. From the Smallest Virus to the Biggest Gene: Marching Towards Gene Therapy for Duchenne Muscular Dystrophy 7. [PMC free article] [PubMed] [Google Scholar]
- Gan W.Q., FitzGerald J.M., Carlsten C., Sadatsafavi M., Brauer M. Associations of ambient air pollution with chronic obstructive pulmonary disease hospitalization and mortality. Am. J. Respir. Crit. Care Med. 2013;187:721–727. doi: 10.1164/rccm.201211-2004OC. [DOI] [PubMed] [Google Scholar]
- Gardner E.G., Kelton D., Poljak Z., Van Kerkhove M., von Dobschuetz S., Greer A.L. A case-crossover analysis of the impact of weather on primary cases of Middle East respiratory syndrome. BMC Infect. Dis. 2019;19 doi: 10.1186/s12879-019-3729-5. [DOI] [PMC free article] [PubMed] [Google Scholar]
- Gasparrini A. Modeling exposure-lag-response associations with distributed lag non-linear models. Stat. Med. 2014;33:881–899. doi: 10.1002/sim.5963. [DOI] [PMC free article] [PubMed] [Google Scholar]
- Gasparrini A., Armstrong B., Kenward M.G. Multivariate meta-analysis for non-linear and other multi-parameter associations. Stat. Med. 2012;31:3821–3839. doi: 10.1002/sim.5471. [DOI] [PMC free article] [PubMed] [Google Scholar]
- Gasparrini A., Guo Y., Hashizume M., Lavigne E., Zanobetti A., Schwartz J., Tobias A., Tong S., Rocklöv J., Forsberg B., Leone M., De Sario M., Bell M.L., Guo Y.-L.L., Wu C., Kan H., Yi S.-M., de Sousa Zanotti Stagliorio Coelho M., Saldiva P.H.N., Honda Y., Kim H., Armstrong B. Mortality risk attributable to high and low ambient temperature: a multicountry observational study. Lancet. 2015;386:369–375. doi: 10.1016/S0140-6736(14)62114-0. [DOI] [PMC free article] [PubMed] [Google Scholar]
- Giannadaki D., Pozzer A., Lelieveld J. Modeled global effects of airborne desert dust on air quality and premature mortality. Atmos. Chem. Phys. 2014;14:957–968. doi: 10.5194/acp-14-957-2014. [DOI] [Google Scholar]
- Glass R.I., Rosenthal J.P. International approach to environmental and lung health. A perspective from the Fogarty International Center. Ann. Am. Thorac. Soc. 2018;15:S109–S113. doi: 10.1513/AnnalsATS.201708-685MG. [DOI] [PMC free article] [PubMed] [Google Scholar]
- Guo Y., Li S., Tian Z., Pan X., Zhang J., Williams G. The burden of air pollution on years of life lost in Beijing, China, 2004–08: retrospective regression analysis of daily deaths. BMJ. 2013;347:f7139. doi: 10.1136/bmj.f7139. [DOI] [PMC free article] [PubMed] [Google Scholar]
- Hertel, O., Jensen, S.S., Ketzel, M., Becker, T., Peel, R.G., Ørby, P.V., Skjøth, C.A., Ellermann, T., Raaschou-Nielsen, O., Sørensen, M., Bräuner, E.V., Andersen, Z.J., Loft, S., Schlünssen, V., Bønløkke, J.H., Sigsgaard, T., 2013. Utilizing monitoring data and spatial analysis tools for exposure assessment of atmospheric pollutants in Denmark, in: McConnell, L.L., Dachs, J., Hapeman, C.J. (Eds.), Occurrence, Fate and Impact of Atmospheric Pollutants on Environmental and Human Health. American Chemical Society, Washington, DC, pp. 95–122. doi: 10.1021/bk-2013-1149.ch006. [DOI]
- Hirabayashi S., Nowak D.J. Comprehensive national database of tree effects on air quality and human health in the United States. Environ. Pollut. 2016;215:48–57. doi: 10.1016/j.envpol.2016.04.068. [DOI] [PubMed] [Google Scholar]
- Horne B.D., Joy E.A., Hofmann M.G., Gesteland P.H., Cannon J.B., Lefler J.S., Blagev D.P., Korgenski E.K., Torosyan N., Hansen G.I., Kartchner D., Pope C.A. Short-term elevation of fine particulate matter air pollution and acute lower respiratory infection. Am. J. Respir. Crit. Care Med. 2018;198:759–766. doi: 10.1164/rccm.201709-1883OC. [DOI] [PubMed] [Google Scholar]
- Huang C., Wang Y., Li X., Ren L., Zhao J., Hu Y., Zhang L., Fan G., Xu J., Gu X., Cheng Z., Yu T., Xia J., Wei Y., Wu W., Xie X., Yin W., Li H., Liu M., Xiao Y., Gao H., Guo L., Xie J., Wang G., Jiang R., Gao Z., Jin Q., Wang J., Cao B. Clinical features of patients infected with 2019 novel coronavirus in Wuhan, China. Lancet. 2020;395:497–506. doi: 10.1016/S0140-6736(20)30183-5. [DOI] [PMC free article] [PubMed] [Google Scholar]
- Jaspers I., Ciencewicki J.M., Zhang W., Brighton L.E., Carson J.L., Beck M.A., Madden M.C. Diesel exhaust enhances influenza virus infections in respiratory epithelial cells. Toxicol. Sci. 2005;85:990–1002. doi: 10.1093/toxsci/kfi141. [DOI] [PubMed] [Google Scholar]
- Kim K.-H., Kabir E., Kabir S. A review on the human health impact of airborne particulate matter. Environ. Int. 2015;74:136–143. doi: 10.1016/j.envint.2014.10.005. [DOI] [PubMed] [Google Scholar]
- Kumar A., Goyal P. Forecasting of daily air quality index in Delhi. Sci. Total Environ. 2011;409:5517–5523. doi: 10.1016/j.scitotenv.2011.08.069. [DOI] [PubMed] [Google Scholar]
- Lakadamyali M., Rust M.J., Babcock H.P., Zhuang X. Visualizing infection of individual influenza viruses. Proc. Natl. Acad. Sci. 2003;100:9280–9285. doi: 10.1073/pnas.0832269100. [DOI] [PMC free article] [PubMed] [Google Scholar]
- Laliberte J.P., Weisberg A.S., Moss B. The membrane fusion step of Vaccinia virus entry is cooperatively mediated by multiple viral proteins and host cell components. PLoS Pathog. 2011;7 doi: 10.1371/journal.ppat.1002446. [DOI] [PMC free article] [PubMed] [Google Scholar]
- Lee S.-J., Song Y., Baker N.A. Molecular dynamics simulations of asymmetric NaCl and KCl solutions separated by phosphatidylcholine bilayers: potential drops and structural changes induced by strong Na+-lipid interactions and finite size effects. Biophys. J. 2008;94:3565–3576. doi: 10.1529/biophysj.107.116335. [DOI] [PMC free article] [PubMed] [Google Scholar]
- Lelieveld J. Clean air in the anthropocene. Faraday Discuss. 2017;200:693–703. doi: 10.1039/C7FD90032E. [DOI] [PubMed] [Google Scholar]
- Lelieveld J., Evans J.S., Fnais M., Giannadaki D., Pozzer A. The contribution of outdoor air pollution sources to premature mortality on a global scale. Nature. 2015;525:367–371. doi: 10.1038/nature15371. [DOI] [PubMed] [Google Scholar]
- Liang Y., Fang L., Pan H., Zhang K., Kan H., Brook J.R., Sun Q. PM2.5 in Beijing – temporal pattern and its association with influenza. Environ. Health. 2014;13 doi: 10.1186/1476-069X-13-102. [DOI] [PMC free article] [PubMed] [Google Scholar]
- Lin K., Yee-Tak Fong D., Zhu B., Karlberg J. Environmental factors on the SARS epidemic: air temperature, passage of time and multiplicative effect of hospital infection. Epidemiol. Infect. 2006;134:223–230. doi: 10.1017/S0950268805005054. [DOI] [PMC free article] [PubMed] [Google Scholar]
- Lindsley W.G., Blachere F.M., Thewlis R.E., Vishnu A., Davis K.A., Cao G., Palmer J.E., Clark K.E., Fisher M.A., Khakoo R., Beezhold D.H. Measurements of airborne influenza virus in aerosol particles from human coughs. PLoS One. 2010;5 doi: 10.1371/journal.pone.0015100. [DOI] [PMC free article] [PubMed] [Google Scholar]
- Liu T., Hu J., Xiao J., He G., Kang M., Rong Z., Lin L., Zhong H., Huang Q., Deng A., Zeng W., Tan X., Zeng S., Zhu Z., Li J., Gong D., Wan D., Chen S., Guo L., Li Y., Sun L., Liang W., Song T., He J., Ma W. Time-varying transmission dynamics of novel coronavirus pneumonia in China (preprint) Syst. Biol. 2020 doi: 10.1101/2020.01.25.919787. [DOI] [Google Scholar]
- Lowen A.C., Mubareka S., Steel J., Palese P. Influenza virus transmission is dependent on relative humidity and temperature. PLoS Pathog. 2007;3:e151. doi: 10.1371/journal.ppat.0030151. [DOI] [PMC free article] [PubMed] [Google Scholar]
- Lu R., Zhao X., Li J., Niu P., Yang B., Wu H., Wang W., Song H., Huang B., Zhu N., Bi Y., Ma X., Zhan F., Wang L., Hu T., Zhou H., Hu Z., Zhou W., Zhao L., Chen J., Meng Y., Wang J., Lin Y., Yuan J., Xie Z., Ma J., Liu W.J., Wang D., Xu W., Holmes E.C., Gao G.F., Wu G., Chen W., Shi W., Tan W. Genomic characterisation and epidemiology of 2019 novel coronavirus: implications for virus origins and receptor binding. Lancet. 2020;395:565–574. doi: 10.1016/S0140-6736(20)30251-8. [DOI] [PMC free article] [PubMed] [Google Scholar]
- Luo X.-S., Zhao Z., Chen Y., Ge X., Huang Y., Suo C., Sun X., Zhang D. Effects of emission control and meteorological parameters on urban air quality showed by the 2014 Youth Olympic Games in China. Fresenius Environ. Bull. 2017;26:11. [Google Scholar]
- McConnell R., Islam T., Shankardass K., Jerrett M., Lurmann F., Gilliland F., Gauderman J., Avol E., Künzli N., Yao L., Peters J., Berhane K. Childhood incident asthma and traffic-related air pollution at home and school. Environ. Health Perspect. 2010;118:1021–1026. doi: 10.1289/ehp.0901232. [DOI] [PMC free article] [PubMed] [Google Scholar]
- MEE (Ministry of Ecology and Environment of People’’s Republic of China) Ministry of Ecology and Environment of People’s Republic of China; 2012. Technical Regulation on Ambient Air Quality Index (on Trial): HJ633-2012. (Beijing, China) [Google Scholar]
- MEE (Ministry of Ecology and Environment of People’’s Republic of China) Ministry of Ecology and Environment of People’s Republic of China; 2016. Report on the State of the Ecology and Environment in China. (Beijing, China) [Google Scholar]
- Milton D.K., Fabian M.P., Cowling B.J., Grantham M.L., McDevitt J.J. Influenza virus aerosols in human exhaled breath: particle size, culturability, and effect of surgical masks. PLoS Pathog. 2013;9 doi: 10.1371/journal.ppat.1003205. [DOI] [PMC free article] [PubMed] [Google Scholar]
- Nemmar A. Possible mechanisms of the cardiovascular effects of inhaled particles: systemic translocation and prothrombotic effects. Toxicol. Lett. 2004;149:243–253. doi: 10.1016/j.toxlet.2003.12.061. [DOI] [PubMed] [Google Scholar]
- Nenna R., Evangelisti M., Frassanito A., Scagnolari C., Pierangeli A., Antonelli G., Nicolai A., Arima S., Moretti C., Papoff P., Villa M.P., Midulla F. Respiratory syncytial virus bronchiolitis, weather conditions and air pollution in an Italian urban area: an observational study. Environ. Res. 2017;158:188–193. doi: 10.1016/j.envres.2017.06.014. [DOI] [PMC free article] [PubMed] [Google Scholar]
- NHC (National Health Commission, China) Pneumonia diagnosis and treatment of 2019-nCoV infection from Chinese NHC and CDC 2020. 2020. http://www.nhc.gov.cn/xcs/zhengcwj/202002/8334a8326dd94d329df351d7da8aefc2/files/b218cfeb1bc54639af227f922bf6b817.pdf (accessed on 20 February 2020)
- NHC (National Health Commission, China) Update on new coronavirus pneumonia epidemic as of 24:00 on February 15. 2020. http://www.nhc.gov.cn/xcs/yqtb/202002/4a1b1ec6c03548099de1c3aa935d04fd.shtml (accessed on 20 February 2020)
- Olofsson S., Kumlin U., Dimock K., Arnberg N. Avian in uenza and sialic acid receptors: more than meets the eye? Lancet Infect. Dis. 2005;5:184–188. doi: 10.1016/S1473-3099(05)01311-3. [DOI] [PubMed] [Google Scholar]
- Patz J.A., Engelberg D., Last J. The effects of changing weather on public health. Annu. Rev. Public Health. 2000;21:271–307. doi: 10.1146/annurev.publhealth.21.1.271. [DOI] [PubMed] [Google Scholar]
- Paynter S. Humidity and respiratory virus transmission in tropical and temperate settings. Epidemiol. Infect. 2015;143:1110–1118. doi: 10.1017/S0950268814002702. [DOI] [PMC free article] [PubMed] [Google Scholar]
- Peng R.D., Dominici F., Louis T.A. Model choice in time series studies of air pollution and mortality. J. R. Stat. Soc. A Stat. 2006;169:179–203. doi: 10.1111/j.1467-985X.2006.00410.x. [DOI] [Google Scholar]
- R Core Team . The R Foundation for Statistical Computing; Vienna, Austria: 2019. R: A language and environment for statistical computing.https://www.r-project.org/index.html [Google Scholar]
- Sarnat S.E., Raysoni A.U., Li W.-W., Holguin F., Johnson B.A., Luevano S.F., Garcia J.H., Sarnat J.A. Air pollution and acute respiratory response in a panel of asthmatic children along the U.S.–Mexico border. Environ. Health Perspect. 2012;120:437–444. doi: 10.1289/ehp.1003169. [DOI] [PMC free article] [PubMed] [Google Scholar]
- Shiraiwa M., Ueda K., Pozzer A., Lammel G., Kampf C.J., Fushimi A., Enami S., Arangio A.M., Fröhlich-Nowoisky J., Fujitani Y., Furuyama A., Lakey P.S.J., Lelieveld J., Lucas K., Morino Y., Pöschl U., Takahama S., Takami A., Tong H., Weber B., Yoshino A., Sato K. Aerosol health effects from molecular to global scales. Environ. Sci. Technol. 2017;51:13545–13567. doi: 10.1021/acs.est.7b04417. [DOI] [PubMed] [Google Scholar]
- Sobsey M.D., Meschke J.S. 2003. Virus Survival in the Environment With Special Attention to Survival in Sewage Droplets and Other Environmental Media of Fecal or Respiratory Origin Draft – August 21, 2003 71. [Google Scholar]
- Stafoggia M., Schwartz J., Forastiere F., Perucci C.A. Does temperature modify the association between air pollution and mortality? A multicity case-crossover analysis in Italy. Am. J. Epidemiol. 2008;167:1476–1485. doi: 10.1093/aje/kwn074. [DOI] [PubMed] [Google Scholar]
- Tang J.W. The effect of environmental parameters on the survival of airborne infectious agents. J. R. Soc. Interface. 2009;6 doi: 10.1098/rsif.2009.0227.focus. [DOI] [PMC free article] [PubMed] [Google Scholar]
- Tellier R. Aerosol transmission of influenza a virus: a review of new studies. J. R. Soc. Interface. 2009;6 doi: 10.1098/rsif.2009.0302.focus. [DOI] [PMC free article] [PubMed] [Google Scholar]
- Thach T.-Q., Wong C.-M., Chan K.-P., Chau Y.-K., Neil Thomas G., Ou C.-Q., Yang L., Peiris J.S.M., Lam T.-H., Hedley A.J. Air pollutants and health outcomes: assessment of confounding by influenza. Atmos. Environ. 2010;44:1437–1442. doi: 10.1016/j.atmosenv.2010.01.036. [DOI] [Google Scholar]
- Valley C.C., Perlmutter J.D., Braun A.R., Sachs J.N. NaCl interactions with phosphatidylcholine bilayers do not Alter membrane structure but induce long-range ordering of ions and water. J. Membr. Biol. 2011;244:35–42. doi: 10.1007/s00232-011-9395-1. [DOI] [PubMed] [Google Scholar]
- Vandini S., Corvaglia L., Alessandroni R., Aquilano G., Marsico C., Spinelli M., Lanari M., Faldella G. Respiratory syncytial virus infection in infants and correlation with meteorological factors and air pollutants. Ital. J. Pediatr. 2013;39(1) doi: 10.1186/1824-7288-39-1. [DOI] [PMC free article] [PubMed] [Google Scholar]
- Wang C., Horby P.W., Hayden F.G., Gao G.F. A novel coronavirus outbreak of global health concern. Lancet. 2020;395:470–473. doi: 10.1016/S0140-6736(20)30185-9. [DOI] [PMC free article] [PubMed] [Google Scholar]
- Wang Y.Q., Zhang X.Y., Sun J.Y., Zhang X.C., Che H.Z., Li Y. Spatial and temporal variations of the concentrations of PM10, PM2.5 and PM1 in China. Atmos. Chem. Phys. 2015;15:13585–13598. doi: 10.5194/acp-15-13585-2015. [DOI] [Google Scholar]
- West J.J., Smith S.J., Silva R.A., Naik V., Zhang Y., Adelman Z., Fry M.M., Anenberg S., Horowitz L.W., Lamarque J.-F. Co-benefits of mitigating global greenhouse gas emissions for future air quality and human health. Nat. Clim. Chang. 2013;3:885–889. doi: 10.1038/nclimate2009. [DOI] [PMC free article] [PubMed] [Google Scholar]
- WHO (World Health Organization) Statement on the second meeting of the international health regulations (2005) emergency committee regarding the outbreak of novel coronavirus (2019-nCoV) 2020. https://www.who.int/news-room/detail/30-01-2020-statement-on-the-second-meeting-of-the-international-health-regulations-(2005)-emergency-committee-regarding-the-outbreak-of-novel-coronavirus-(2019-ncov)
- WHO (World Health Organization) Coronavirus disease 2019 (COVID - 19) situation report - 26. 2020. https://www.who.int/docs/default-source/coronaviruse/situation-reports/20200215-sitrep-26-covid-19.pdf?sfvrsn=a4cc6787_2
- Xu X., Chen P., Wang J., Feng J., Zhou H., Li X., Zhong W., Hao P. Evolution of the novel coronavirus from the ongoing Wuhan outbreak and modeling of its spike protein for risk of human transmission. Sci. China Life Sci. 2020 doi: 10.1007/s11427-020-1637-5. [DOI] [PMC free article] [PubMed] [Google Scholar]
- Yang W., Marr L.C. Mechanisms by which ambient humidity may affect viruses in aerosols. Appl. Environ. Microbiol. 2012;78:6781–6788. doi: 10.1128/AEM.01658-12. [DOI] [PMC free article] [PubMed] [Google Scholar]
- Yang W., Elankumaran S., Marr L.C. Concentrations and size distributions of airborne influenza A viruses measured indoors at a health Centre, a day-care Centre and on aeroplanes. J. R. Soc. Interface. 2011;8:1176–1184. doi: 10.1098/rsif.2010.0686. [DOI] [PMC free article] [PubMed] [Google Scholar]
- Yu I.T.S., Li Y., Wong T.W., Tam W., Chan A.T., Lee J.H.W., Leung D.Y.C., Ho T. Evidence of airborne transmission of the severe acute respiratory syndrome virus. N. Engl. J. Med. 2004;350:1731–1739. doi: 10.1056/NEJMoa032867. [DOI] [PubMed] [Google Scholar]
- Zaki A.M., van Boheemen S., Bestebroer T.M., Osterhaus A.D.M.E., Fouchier R.A.M. Isolation of a novel coronavirus from a man with pneumonia in Saudi Arabia. N. Engl. J. Med. 2012;367:1814–1820. doi: 10.1056/NEJMoa1211721. [DOI] [PubMed] [Google Scholar]
- Zhou D., Zhang P., Bao C., Zhang Y., Zhu N. Emerging understanding of etiology and epidemiology of the novel coronavirus (COVID-19) infection in Wuhan, China (preprint) Life Sci. 2020 doi: 10.20944/preprints202002.0283.v1. [DOI] [Google Scholar]
- Zhou P., Yang X.-L., Wang X.-G., Hu B., Zhang L., Zhang W., Si H.-R., Zhu Y., Li B., Huang C.-L., Chen H.-D., Chen J., Luo Y., Guo H., Jiang R.-D., Liu M.-Q., Chen Y., Shen X.-R., Wang X., Zheng X.-S., Zhao K., Chen Q.-J., Deng F., Liu L.-L., Yan B., Zhan F.-X., Wang Y.-Y., Xiao G.-F., Shi Z.-L. A pneumonia outbreak associated with a new coronavirus of probable bat origin. Nature. 2020 doi: 10.1038/s41586-020-2012-7. [DOI] [PMC free article] [PubMed] [Google Scholar]
- Zumla A., Hui D.S. Infection control and MERS-CoV in health-care workers. Lancet. 2014;383:1869–1871. doi: 10.1016/S0140-6736(14)60852-7. [DOI] [PMC free article] [PubMed] [Google Scholar]
Associated Data
This section collects any data citations, data availability statements, or supplementary materials included in this article.
Supplementary Materials
Supplementary tables