Abstract
Natural selection drives populations towards higher fitness, but second-order selection for adaptability and mutational robustness can also influence evolution. In many microbial systems, diminishing returns epistasis contributes to a tendency for more-fit genotypes to be less adaptable, but no analogous patterns for robustness are known. To understand how robustness varies across genotypes, we measure the fitness effects of hundreds of individual insertion mutations in a panel of yeast strains. We find that more-fit strains are less robust: they have distributions of fitness effects with lower mean and higher variance. These differences arise because many mutations have more strongly deleterious effects in faster-growing strains. This negative correlation between fitness and robustness implies that second-order selection for robustness will tend to conflict with first-order selection for fitness.
The dynamics and outcomes of adaptive evolution depend on the genetic variation available to a population. Because mutations interact epistatically, the availability and strength of beneficial and deleterious mutations can vary across genotypes (1). As “first-order” natural selection drives populations towards higher fitness, “second-order” selection can favor genotypes with better prospects for future evolution, steering populations into regions of the fitness landscape with better uphill prospects (i.e. are more adaptable) or into “flatter” regions with fewer or less steep downhill paths (i.e. are more robust to deleterious mutations) (2–5). While second-order selection has been observed in microbes, viruses, and digital organisms (4–8), our understanding of how and why genotypes differ in their robustness and adaptability is incomplete.
Many laboratory microbial populations display a consistent pattern of declining adaptability, such that less-fit genotypes adapt more rapidly than more-fit genotypes (9–13). This is at least partially explained by “diminishing returns” epistasis, in which individual beneficial mutations become less beneficial in more-fit genetic backgrounds (12–15). In contrast to adaptability, genetic variation in mutational robustness has not been systematically characterized, and no analogs to diminishing returns or the rule of declining adaptability are known. There is evidence for both antagonistic and synergistic epistasis between pairs of deleterious mutations (16–19), but little is known about how the entire distribution of fitness effects (DFE) of deleterious mutations changes across different genetic backgrounds and whether robustness, like adaptability, depends systematically on fitness.
There are several ways to define and measure mutational robustness (2–4). Here we consider only the single-step mutational neighborhood of a genotype. We define robustness based on the distribution of fitness effects of single mutations and refer to strains in which these mutations are more deleterious on average as less robust (though we note that the appropriate precise definition of mutational robustness can depend on the full DFE and the specific population genetic question). To understand genetic variation in single-step mutational robustness, we aim to measure how the DFE varies across genotypes, and how these differences arise from epistasis at the level of individual mutations. To do so, we would ideally like to measure the fitness effects of identical large sets of random mutations in multiple genotypes. This would allow us to compare the DFE of these mutations across genotypes and to identify the genetic basis of differences in robustness.
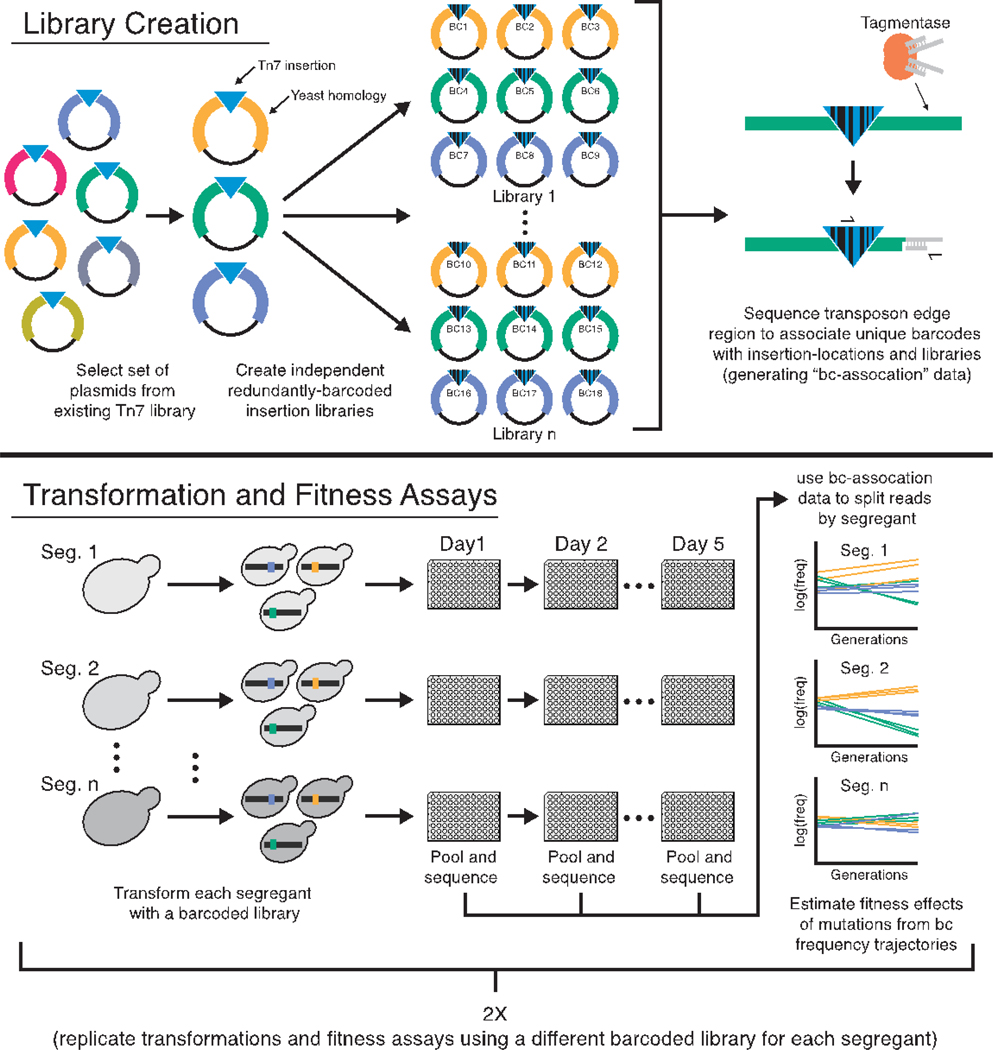
To this end, we developed a pipeline to measure the effects of sets of specific insertion mutations in a panel of Saccharomyces cerevisiae genotypes (Fig. 1). Briefly, we transform yeast strains with transposon mutagenesis libraries derived from (20) in which each plasmid is tagged by multiple unique DNA barcodes. Homology-directed repair then creates the same set of transposon insertion mutations in each strain. We propagate the resulting mutant pools in batch culture and measure barcode frequency trajectories to estimate the fitness effect of each mutation in each strain (21) (figs. S1 and S2). Using this approach, we conducted two experiments to measure mutational robustness in F1 segregants derived from a yeast cross between a laboratory and a wine strain (BY and RM). These segregants differ at more than 35,000 loci and have previously been sequenced and phenotyped (22). They vary in fitness (across a 22.5% range) in our focal environment, and those with lower fitness are more adaptable (9).
Figure 1. Schematic of mutagenesis and fitness assay pipeline.
Plasmids with different colors indicate different regions of homology from the yeast genome.
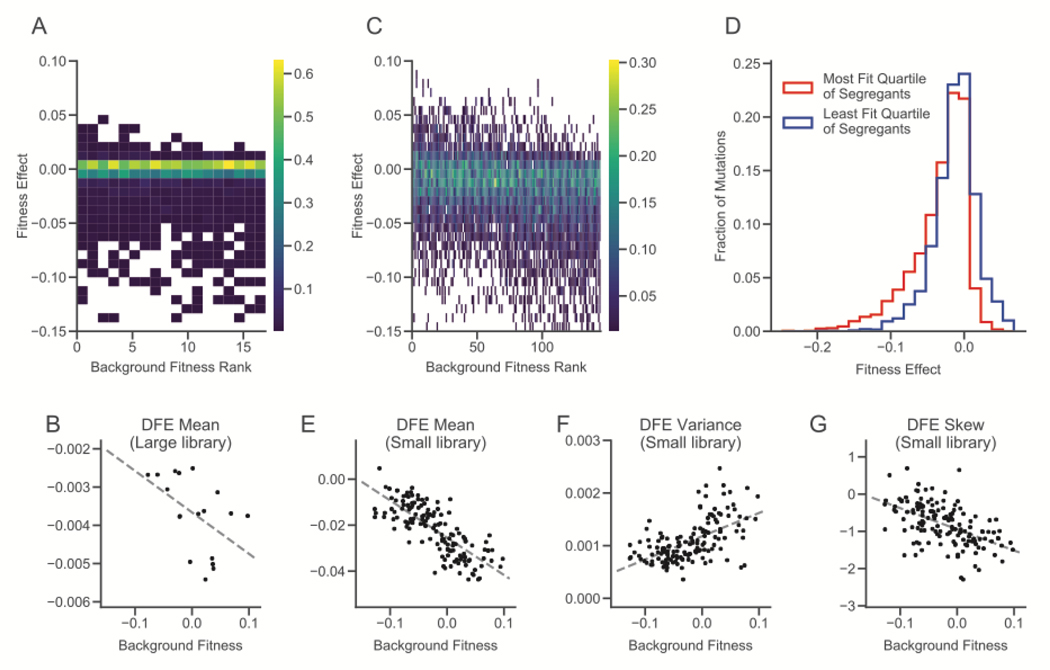
In the first, “large library” experiment, we transformed 18 randomly chosen segregants from (9) with libraries consisting of 1147 mutations (fig. S3) (21). While these are not a random sample of all naturally occurring mutations in yeast, they represent an unbiased set of genomic disruptions. Due to gene essentiality, differences in cloning or transformation efficiency, or other complications, we were unable to measure the fitness effect of every mutation in every segregant (see (21) and fig. S4 for analysis of the effects of missing data). We successfully measured the effects of 710 mutations in at least one segregant (on average 414 per segregant). 457 of these 710 (64%) had no detectable fitness effects in any segregant. Most remaining mutations were deleterious, and their DFE varied systematically across strains. Specifically, the mean fitness effect of these mutations decreases with the background fitness of the segregant (i.e. more-fit segregants tend to be less robust with respect to random insertion mutations, P=0.03, two-sided t test, Figs. 2, A and B, S5).
Figure 2. Distributions of fitness effects of insertion mutations.
(A) Distributions of fitness effects in the large library experiment. Segregants are organized by background fitness. Color represents the fraction of mutations for each segregant in each fitness effect bin (see scale bar at right). (B) Relationship between background fitness and the mean of the DFE for the large library experiment (P = 0.03, two-sided t test). (C) Distributions of fitness effects in the small library experiment. Color represents the fraction of mutations for each segregant in each fitness effect bin (see scale bar at right). (D) Combined distribution of fitness effects of most-fit and least-fit quartile of segregants in the small library experiment. (E-G) Relationship between background fitness and DFE statistics for the small library experiment (P = 4.13 × 10⁻³¹, P = 7. 83 × 10−14, P = 4.08 × 10⁻¹², respectively, two-sided t test).
Because we only measured fitness effects across 18 segregants in our large library experiment, and 64% of the mutations were indistinguishable from neutral, we were unable to detect more subtle changes in the DFE or to connect DFE-level changes to patterns of epistasis for individual mutations. To address this limitation, in our second experiment we transformed a larger group of 163 randomly chosen segregants with a “small” library, created by selecting a subset of 91 insertions from our large library that had significant fitness effects in the largest number of segregants (21). This small library filters out insertions with undetectable or rare effects but is otherwise unbiased.
Again, we find that the mean of the DFE decreases as segregant fitness increases (Fig. 2, C, D, and E). We also find significant correlations between background fitness and the variance and skew of the DFE: more-fit segregants have wider DFEs that are skewed towards more deleterious mutations (Fig. 2, C, F, and G, S6). These results imply that mutational robustness is negatively correlated with background fitness. This suggests that second-order selection for robustness could be constrained by conflict with first-order selection for fitness.
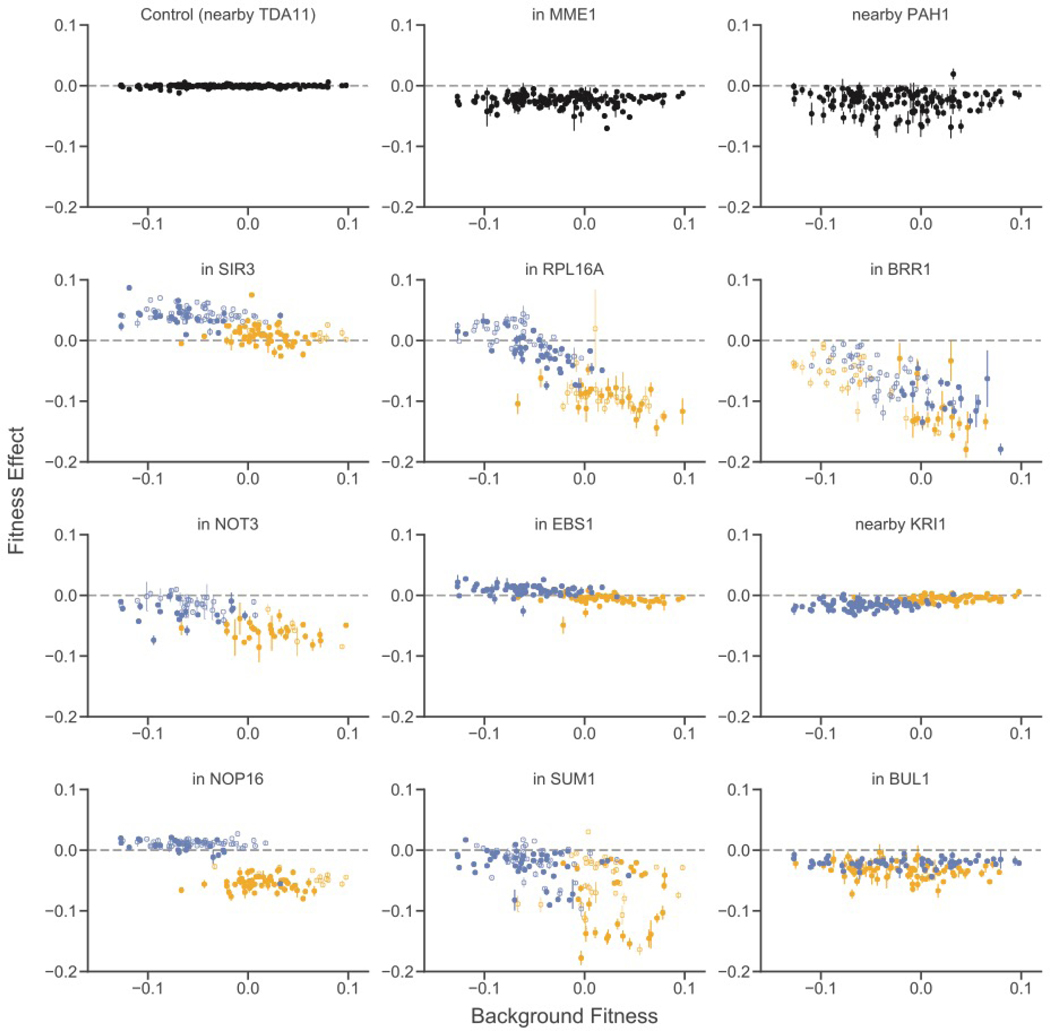
The DFE is composed of individual mutations. To understand why the shape of the DFE varies between segregants, we examined how the effects of these individual mutations vary. We observe a variety of types of epistasis (Figs. 3 and S7), including nearly constant effects across backgrounds (e.g. PAH1, MME1) and diminishing returns (e.g. SIR3). However, the most frequent pattern (48 cases, see below) is “increasing cost” epistasis such that the mutation is more deleterious in more-fit segregants (Figs. 3 and 4A). This is the deleterious-mutation analog of “diminishing returns” epistasis. Strikingly, this effect can cross zero: some mutations are beneficial in the least-fit segregants, neutral in intermediate-fitness segregants, and deleterious in higher-fitness segregants (e.g. RPL16A). This negative correlation is not universal; six mutations exhibit the opposite pattern (e.g. KRI1).
Figure 3. Patterns of epistasis for individual mutations.
Fitness effects of 12 representative insertion mutations are plotted against segregant background fitness. The top left mutation is one of five putatively neutral insertions used as controls. Allelic state at the largest-effect quantitative trait locus for the fitness effect of each mutation is shown by yellow (BY) or blue (RM) color; allelic state at the second largest-effect quantitative trait locus is shown by closed (BY) or open (RM) symbol. If no significant QTLs were detected, all data points are black. Analogous plots for all insertion mutations are shown in fig. S7. Error bars represent standard errors (21).
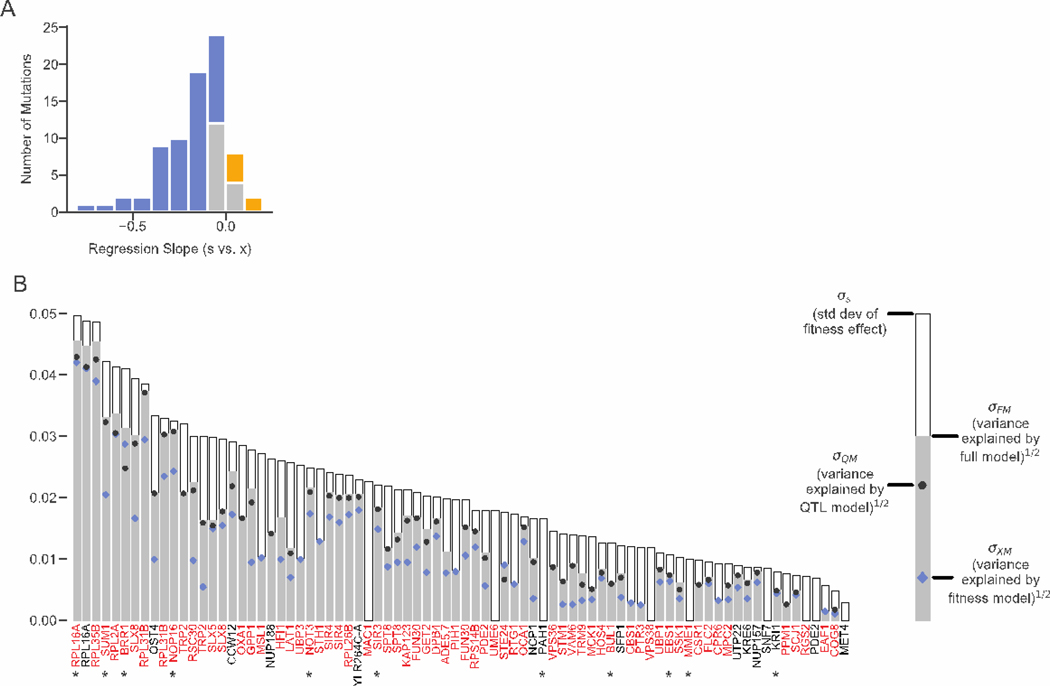
Figure 4. Genetic determinants of fitness effects.
(A) Histogram of regression slopes between fitness effect and background fitness for each mutation. Significant negative and positive correlations are shown in blue and yellow, respectively. (B) For each mutation, the standard deviation of fitness effect across segregants and the square root of the variance explained by each of the three models. For each mutation, the variance explained by models that were not significantly better than a no-epistasis model are not plotted. Mutations shown in red or black are insertions in or near the corresponding gene respectively; stars indicate the mutations shown in Figure 3. Only mutations with fitness effect measurements in at least fifty segregants are shown.
In addition to background fitness, specific genetic loci can influence the fitness effects of individual mutations (e.g. NOP16, Fig. 3). We used the same procedure as in (9, 22) to identify such QTLs for each mutation (fig. S8). To quantify how these QTLs and background fitness explain the variation in the fitness effect of each mutation, we fit three linear models to our data (21). The “fitness” model includes segregant fitness as the only predictor. The “QTL” model includes only segregant genotype at a small number of QTLs. The “full model” includes both segregant fitness and QTL effects.
We find that at least one of these three models is significantly better than the null model without epistasis for 71 of the 80 mutations for which we have measurements in at least 50 segregants (Fig. 4B). For mutations where the fitness model has explanatory power (64 cases, 80.0%), most are more deleterious in more fit backgrounds (58 cases), and most of these are deleterious on average (i.e. exhibit increasing cost epistasis, 48 cases). QTLs have explanatory power in 60 cases (75.0%), but because many QTLs also affect segregant fitness, QTL and fitness contributions are confounded. To understand which of our models best explains the fitness effects of each mutation while involving as few parameters as possible, we compare the Akaike information criterion (AIC) of each model. The AIC is lowest for the background fitness model for 10 mutations (12.5%), the QTL model for 16 mutations (20%), and the full model for 45 mutations (56.25%). However, even when the background fitness model does not have the lowest AIC, in many cases it explains close to as much variation as the QTL or full model.
One potential explanation for increasing cost epistasis is that mutations have effects during the saturation phase of our batch culture propagation, and more-fit strains are less robust because they spend longer in saturation. We measured fitness within a single growth cycle and found that this is not the case. Instead, differences in fitness arise almost exclusively during exponential growth (21, figs. S9 to S11).
To understand why faster growing strains are less robust, we looked for functional similarities among genes disrupted by mutations with similar epistatic patterns (i.e. by mutations whose fitness effects were modified by the same QTL (fig. S12) or by mutations with strong fitness-mediated epistasis (21)). We found enrichment in several GO terms among such genes at p<0.05 (though none remain significant after multiple-hypothesis correction; Table S1) (23). Most notably, the fitness-mediated epistasis set and the set associated with the most commonly-observed QTL are enriched for ribosome and translation-related functions. This QTL is also the strongest background fitness QTL, and includes variants in KRE33, a gene involved in small ribosomal subunit assembly (see (9)). Metabolic control theory provides a possible link between this functional information and increasing cost epistasis. Specifically, it predicts that a deleterious mutation in one enzyme will have a weaker effect if other enzymes in any sequential biological pathway are already defective, given that fitness is correlated with metabolic flux through that pathway (18, 24). This also applies to sequential pathways in transcription and translation (25), so increasing costs epistasis could arise because more-fit segregants have a better optimized ribosome synthesis or protein synthesis pathway and therefore experience greater costs when deleterious mutations affect these pathways. While these results are not definitive, they suggest that further generalizations could be drawn from a deeper understanding of the cell-physiological basis of fitness-mediated epistasis.
Our results are limited to the analysis of individual gene disruption mutations in a specific set of yeast strains, and it is possible that other types of mutations (e.g. regulatory changes or second-step mutations) exhibit different patterns. However, to the extent that the patterns of fitness-dependent epistasis observed here and in previous work on beneficial mutations (9–15) hold more broadly and over multiple mutational steps, their net effect is a predictable change in the local properties of the fitness landscape as populations adapt. This local mutational neighborhood becomes less favorable in more-fit genotypes: uphill steps become flatter or even change to downhill, and many downhill paths become steeper. On such landscapes, first-order selection for high-fitness genotypes conflicts with second-order selection, and populations evolve towards more fit but less robust and less adaptable genotypes. Thus, even if true fitness peaks exist, populations may never attain them, instead reaching a dynamic balance between beneficial and deleterious mutations (26).
Supplementary Material
Acknowledgements
We thank E. Jerison, L. Rast, A. Nguyen-Ba, J. Yodh, G. Wildenberg, and members of the Desai lab for experimental assistance and/or comments on the manuscript.
Funding: This work was supported by an NSF Graduate Research Fellowship (to M.S.J.), a BWF Career Award at the Scientific Interface (Grant 1010719.01), the Alfred P. Sloan Foundation (Grant FG-2017–9227), the Hellman Foundation, the Simons Foundation (Grant 376196), the NSF (DEB-1655960), and the NIH (GM104239). Computational work was performed on the Odyssey cluster supported by the Research Computing Group at Harvard University.
Footnotes
Competing interests: None declared.
Data and materials availability: Data described in the paper are presented in the Supplementary Materials. Raw sequencing data is publicly available at the NCBI Sequence Read Archive (accession no. SRP216610), and all analysis code is available from Zenodo (27).
References and Notes
- 1.Wright S, Proc. Sixth Int. Cong. Genet. 1, 356–366 (1932). [Google Scholar]
- 2.Masel J, Trotter MV, Trends Genet. 26, 406–414 (2010). [DOI] [PMC free article] [PubMed] [Google Scholar]
- 3.Lenski RE, Barrick JE, Ofria C, PLoS Biol. 4, e428 (2006). [DOI] [PMC free article] [PubMed] [Google Scholar]
- 4.Payne JL, Wagner A, Nat. Rev. Genet. 20, 24–38 (2019). [DOI] [PubMed] [Google Scholar]
- 5.Wilke CO, Wang JL, Ofria C, Lenski RE, Adami C, Nature. 412, 331–333 (2001). [DOI] [PubMed] [Google Scholar]
- 6.Woods RJ et al. , Science. 331, 1433–1436 (2011). [DOI] [PMC free article] [PubMed] [Google Scholar]
- 7.Novella IS, Presloid JB, Beech C, Wilke CO, Virol J. 87, 4923–4928 (2013). [DOI] [PMC free article] [PubMed] [Google Scholar]
- 8.Lauring AS, Andino R, PLoS Pathog. 6, e1001005 (2010). [DOI] [PMC free article] [PubMed] [Google Scholar]
- 9.Jerison ER et al. , Elife. 6 (2017). [Google Scholar]
- 10.Kryazhimskiy S, Rice DP, Jerison ER, Desai MM, Science. 344, 1519–1522 (2014). [DOI] [PMC free article] [PubMed] [Google Scholar]
- 11.Wünsche A et al. , Nature Ecology & Evolution. 1, 0061 (2017). [DOI] [PubMed] [Google Scholar]
- 12.Wiser MJ, Ribeck N, Lenski RE, Science. 342, 1364–1367 (2013). [DOI] [PubMed] [Google Scholar]
- 13.Couce A, Tenaillon OA, Front. Genet. 6, 99 (2015). [DOI] [PMC free article] [PubMed] [Google Scholar]
- 14.Chou H-H, Chiu H-C, Delaney NF, Segrè D, Marx CJ, Science. 332, 1190–1192 (2011). [DOI] [PMC free article] [PubMed] [Google Scholar]
- 15.Khan AI, Dinh DM, Schneider D, Lenski RE, Cooper TF, Science. 332, 1193–1196 (2011). [DOI] [PubMed] [Google Scholar]
- 16.Elena SF, Lenski RE, Nature. 390, 395–398 (1997). [DOI] [PubMed] [Google Scholar]
- 17.Sanjuán R, Moya A, Elena SF, Proc. Natl. Acad. Sci. U. S. A. 101, 15376–15379 (2004). [DOI] [PMC free article] [PubMed] [Google Scholar]
- 18.Jasnos L, Korona R, Nat. Genet. 39, 550–554 (2007). [DOI] [PubMed] [Google Scholar]
- 19.Costanzo M et al. , Science. 327, 425–431 (2010). [DOI] [PMC free article] [PubMed] [Google Scholar]
- 20.Kumar A et al. , Genome Res. 14, 1975–1986 (2004). [DOI] [PMC free article] [PubMed] [Google Scholar]
- 21.Materials and methods and supplementary text are available as supplementary materials.
- 22.Bloom JS, Ehrenreich IM, Loo WT, Lite T-LV, Kruglyak L, Nature. 494, 234–237 (2013). [DOI] [PMC free article] [PubMed] [Google Scholar]
- 23.Klopfenstein DV et al. , Sci. Rep. 8, 10872 (2018). [DOI] [PMC free article] [PubMed] [Google Scholar]
- 24.Szathmáry E, Genetics. 133, 127–132 (1993). [DOI] [PMC free article] [PubMed] [Google Scholar]
- 25.MacLean RC, J. Evol. Biol. 23, 488–493 (2010). [DOI] [PubMed] [Google Scholar]
- 26.Rice DP, Good BH, Desai MM, Genetics. 200, 321–329 (2015). [DOI] [PMC free article] [PubMed] [Google Scholar]
- 27.Johnson MS, Zenodo (2019); 10.5281/zenodo.3402230. [DOI] [Google Scholar]
- 28.Durfee T et al. , J. Bacteriol. 190, 2597–2606 (2008). [DOI] [PMC free article] [PubMed] [Google Scholar]
- 29.Vandewalle K et al. , Nat. Commun. 6, 7106 (2015). [DOI] [PMC free article] [PubMed] [Google Scholar]
- 30.Baym M, Shaket L, Anzai IA, Adesina O, Barstow B, Nat. Commun. 7, 13270 (2016). [DOI] [PMC free article] [PubMed] [Google Scholar]
- 31.Stern DL, bioRxiv 037762 (2017). [Google Scholar]
- 32.Langmead B, Salzberg SL, Nat. Methods. 9, 357–359 (2012). [DOI] [PMC free article] [PubMed] [Google Scholar]
- 33.Balakrishnan R et al. , Database, (2012). [Google Scholar]
- 34.Baym M et al. , PLoS One. 10, e0128036 (2015). [DOI] [PMC free article] [PubMed] [Google Scholar]
- 35.Gibson DG et al. , Nat. Methods. 6, 343–345 (2009). [DOI] [PubMed] [Google Scholar]
- 36.McCusker JH, Cold Spring Harb. Protoc. 2017, db.prot088104 (2017). [Google Scholar]
- 37.Lee ME, DeLoache WC, Cervantes B, Dueber JE, ACS Synth. Biol. 4, 975–986 (2015). [DOI] [PubMed] [Google Scholar]
- 38.Gietz RD, Schiestl RH, Nat. Protoc. 2, 35–37 (2007). [DOI] [PubMed] [Google Scholar]
- 39.Levy SF et al. , Nature. 519, 181–186 (2015). [DOI] [PMC free article] [PubMed] [Google Scholar]
- 40.Venkataram S et al. , Cell. 166, 1585–1596.e22 (2016). [Google Scholar]
Associated Data
This section collects any data citations, data availability statements, or supplementary materials included in this article.


