

Abstract
The National Beef Quality Audit–2016 marks the fourth iteration in a series assessing the quality of live beef and dairy cows and bulls and their carcass counterparts. The objective was to determine the incidence of producer-related defects, and report cattle and carcass traits associated with producer management. Conducted from March through December of 2016, trailers (n = 154), live animals (n = 5,470), hide-on carcasses (n = 5,278), and hide-off hot carcasses (n = 5,510) were surveyed in 18 commercial packing facilities throughout the United States. Cattle were allowed 2.3 m2 of trailer space on average during transit indicating some haulers are adhering to industry handling guidelines for trailer space requirements. Of the mixed gender loads arriving at processing facilities, cows and bulls were not segregated on 64.4% of the trailers surveyed. When assessed for mobility, the greatest majority of cattle surveyed were sound. Since the inception of the quality audit series, beef cows have shown substantial improvements in muscle. Today over 90.0% of dairy cows are too light muscled. The mean body condition score for beef animals was 4.7 and for dairy cows and bulls was 2.6 and 3.3, respectively. Dairy cattle were lighter muscled, yet fatter than the dairy cattle surveyed in 2007. Of cattle surveyed, most did not have horns, nor any visible live animal defects. Unbranded hides were observed on 77.3% of cattle. Carcass bruising was seen on 64.1% of cow carcasses and 42.9% of bull carcasses. However, over half of all bruises were identified to only be minor in severity. Nearly all cattle (98.4%) were free of visible injection-site lesions. Current results suggest improvements have been made in cattle and meat quality in the cow and bull sector. Furthermore, the results provide guidance for continued educational and research efforts for improving market cow and bull beef quality.
Keywords: audit, beef quality, bull, cow, dairy
INTRODUCTION
The market cow and bull assessment of the National Beef Quality Audit-2016 (NBQA–2016) marks the fourth iteration in a series of studies designed to assess the status of the mature cattle beef industry in the United States. The first market cow and bull beef quality audit (then called the National Non-Fed Beef Quality Audit–1994), conducted by Colorado State University, followed the completion of the 1991 National Beef Quality Audit for steers and heifers (Lorenzen et al., 1993), and was aimed at understanding and quantifying the producer-related quality defects of cows and bulls and their carcasses (National Cattlemen's Beef Association, 1994; Smith et al., 1994). In determining the initial benchmarks for beef and dairy cow and bull cattle and meat quality, the study concluded cows and bulls were too frequently light muscled and thin, and excessive defects were too often observed. Conclusions urged producers to capitalize on management practices to improve the value of cows and recoup the worth of appropriate on-farm practices.
Five years later, the 1994 benchmarks were used as reference data in the National Market Cow and Bull Beef Quality Audit-1999 (NMCBBQA–1999; Roeber et al., 2000; Roeber et al., 2001). This study measured the quality improvement and/or decline in live cattle, carcass, and offal traits over the 5-yr period. Concomitantly, the NMCBBQA–1999 established new beef quality benchmarks utilized in future initiatives, such as the injection-site lesion prevalence in cow primals (Roeber et al., 2002), brought forth by the beef industry.
Eight years later, Texas A&M University led the third NMCBBQA to continue the progression of measuring quality changes and determining the status of the market cow and bull beef industry (Nicholson, 2008; Nicholson et al., 2013). This audit incorporated new information regarding the use of electric prods, animal handling techniques, animal traceability and other data aimed at further quantifying animal welfare and handling practices at processing facilities, a great concern of the beef industry at the time.
The objective of the NBQA–2016 was to again quantify the status of the beef industry in regards to the contribution made by mature cows and bulls. The NBQA–2016 provides an updated status report of the market cow and bull sector as it pertains to cattle transportation, mobility, and live cattle and carcass characteristics, as well as offal items and by-products. By comparing these data to the NNFBQA–1994, NMCBBQA–1999, and NMCBBQA–2007, the beef industry can assess changes in the quality of live cattle and carcasses from market cows and bulls. In addition, data from this study can provide direction for future initiatives concerned with improving beef quality.
MATERIALS AND METHODS
Animal care and use committee approval was not obtained for this study. Live cattle transportation, live cattle assessments, and mobility data were collected strictly by observation. All other data were collected on carcasses after immobilization.
General Overview
To ensure consistency, all 8 collaborating universities met before data were collected to discuss survey protocols and use of standardized data books. Through the duration of 2016, characterization of transportation, assessment of cattle mobility, and visual assessment of live animals, carcasses and offal, was completed in 18 predetermined federally-inspected beef processing facilities representing 10 states (Table 1). One-third of cattle, carcasses, and offal at each of the 18 surveyed processing facilities were audited over the course of one full production day; if the facility operated 2 shifts per day, cattle in both shifts were surveyed. When possible, all cattle and carcasses surveyed were classified by breed type (beef or dairy) and sex (cow or bull).
Table 1.
National Beef Quality Audit (NBQA): Company and location of live animal, harvest floor, and cooler assessments
| Company | Location |
|---|---|
| ABF Packing | Stephenville, TX |
| American Beef Packers | Chino, CA |
| American Foods Group – Cimpls Inc. | Yankton, SD |
| American Foods Group – Gibbon Packing | Gibbon, NE |
| American Foods Group – Green Bay Dressed Beef | Green Bay, WI |
| American Foods Group – Long Prairie Packing | Long Prairie, MN |
| Cargill Beef Packers | Fresno, CA |
| Cargill Taylor Beef | Wyalusing, PA |
| Caviness Packing | Hereford, TX |
| Central Valley Meat Company | Hanford, CA |
| FPL Foods LLC | Augusta, GA |
| H&B Packing | Waco, TX |
| JBS Green Bay | Green Bay, WI |
| JBS Omaha | Omaha, NE |
| JBS Plainwell | Plainwell, MI |
| JBS Souderton | Souderton, PA |
| JBS Tolleson | Tolleson, AZ |
| Lone Star Beef | San Angelo, TX |
Transportation and Mobility
Truck and trailer information from 10% of all trucks (n = 154) to arrive at the 18 processing facilities were evaluated for type, dimension, use of compartments, and use of center gate. The truck driver was interviewed to determine cattle origin, date and time loaded, distance and time traveled, number and type of cattle in the load, if mixed gender loads were segregated, and if cattle were unloaded during transit. If the driver was unsure of the distance traveled, a map was used to estimate the distance from origin to packing facility. Time traveled was considered the duration between time loaded and time unloaded.
As they were moved from the truck to the holding pen, cattle (n = 4,066) were assessed for mobility using the North American Meat Institute's 4-point scale (North American Meat Institute Animal Welfare Committee, 2015). Animals who fell to the ground and could not rise were classified as non-ambulatory.
Live Cattle Evaluation
Cattle (n = 5,470) were surveyed for live animal characteristics that could drive producer's culling decisions. Each animal surveyed was assigned a muscle score (5-point scale: 1 = light muscled, 5 = heavy muscled) and a body condition score (beef animal: 9-pt scale; 1 = extremely thin, 9 = very obese; dairy animal: 5-point scale; 1.0 = thin, 5.0 = over-conditioned; Elanco Animal Health, 2009; Eversole et al., 2009). With the aim of identifying producer-related defects, the research group assessed cattle for anticipated defects (Table 2). For these predetermined defects, researchers used the scales presented in Table 2 to quantify their observations. Unanticipated defects (not found in Table 2) were noted by researchers when observed.
Table 2.
National Beef Quality Audit (NBQA): Comprehensive list of predetermined defects identified to be a cause for marketing cows and bulls
| Defect | Scale | Description |
|---|---|---|
| Bovine ocular neoplasia (cancer eye) | 0 – 51 | 0 – normal eye |
| 1 – small benign tumor producing finger-like growth, precancerous | ||
| 2 – small white elevated plaque on the eyeball, precancerous | ||
| 3 – growth on the third eyelid or a tumor that is vascular in nature, cancerous | ||
| 4 – tumors that have metastasized to the bony structure around the eye or exhibit lymphatic involve ment of the parotid gland, cancerous | ||
| 5 – eyeball has prolapsed from the orbit and/or exhibits a necrotic condition, cancerous | ||
| Prolapse | Presence/absence | Rectal – protrusion of the rectum through the anus |
| Vaginal – protrusion of the vagina to the exterior of the body cavity | ||
| Hide damage | Presence/absence | Insect damage |
| Latent damage – any visible blemish that could devalue the hide (brands not included) | ||
| Abscess | Presence/absence | Collection of pus in confined tissue spaces |
| Types: facial, knee/hock, hook/pin | ||
| Bottle teats | Presence/absence | The development of raised smooth or rough rings at the teat ends2 |
| Failed suspensory ligament | Presence/absence | Insufficient attachment of the udder to the body cavity so as the ventral portion of the udder lies below the hock and the teats splay outward3 |
| Full bag | Presence/absence | Udder filled with milk |
| Mastitis | Presence/absence | Inflammation of the mammary gland |
| Multiple udder problems | Presence/absence | Any combination of udder defects |
| Retained placenta | Presence/absence | Discolored, malodorous membrane hanging from the vulva4 |
| Lumpy jaw | Presence/absence | Localized abscess that involves the mandible or any other bony tissue of the head5 |
| Calf in pen | Presence/absence | |
| Broken penis | Presence/absence | |
| Foot abnormality | Presence/absence | |
| Swollen joints | Presence/absence | |
| Warts | Presence/absence |
Hide-on Carcass Evaluation
Hide-on carcasses (n = 5,278), were evaluated for the incidence of hide branding; location (butt, side, shoulder) and size (cm2) of brands were recorded. The presence and location (neck, shoulder, top butt, round) of knots was recorded. In addition, researchers observed length of horns.
Hide-off Carcass Evaluation
Carcasses (n = 5,510) were assessed for number, location (round, rib, shortloin, sirloin, chuck, the combination of brisket, plate, and flank) and severity (minimal = less than 0.45 kg trim loss; major = 0.46 kg to 4.54 kg trim loss; critical = 4.55 kg to 18.14 kg trim loss; extreme = loss of an entire primal) of bruises. Furthermore, the number and location (round, rib, shortloin, sirloin, chuck, the combination of brisket, plate, and flank) of visible injection-site lesions on the exterior carcass surface were recorded.
Statistical Analysis
Data were analyzed using JMP Software (JMP, Version 10. SAS Inst. Inc., Cary, NC) and Microsoft Excel for Mac. Distributions, frequencies, means, standard deviations, minimums, and maximums were calculated using the Distribution and Summary functions of JMP.
RESULTS AND DISCUSSION
Transportation
Transportation data by trailer type are presented in Table 3. Across all loads surveyed, cattle were in transit for a mean of 6.7 h and traveled a mean distance of 455.7 km. It is important to note that 3 loads were hauled for over 24 h and 2 loads traveled distances greater than 1,600 km. The Beef Quality Assurance program does not recommend withholding feed and water for longer than 24 h, therefore, transporters should ensure adequate stops during long hauls to meet these guidelines (Beef Quality Assurance Advisory Board, n.d.). In addition, there is evidence increased transportation distance leads to increased carcass bruising in cows (Yeh et al., 1978). On average, there were 26 cattle per load, although load sizes ranged from 1 to 47 head per trailer. As load size increases, it is important that minimum space requirements for each animal are met. The average area allotted per animal for all loads (2.3 m2) and pot bellies alone (1.2 m2) indicate some trailers were hauled at proper (1.0 to 1.8 m2 for horned cattle weighing 364 to 636 kg; 0.97 to 1.7 m2 for polled cattle weighing 364 to 636 kg) load densities as outlined in the Animal Handling Guidelines (Grandin, 2013). Stocking densities such as these helps minimize animal welfare concerns and profit losses due to carcass defects. Even so, some trailers were overstocked, crowding animals on the way to harvest. Transporters should work to limit the frequency of hauling too many cattle on a single load to assure animal safety and maintain carcass value.
Table 3.
National Beef Quality Audit (NBQA): Mean values for time and distance traveled, number of cattle in the load, trailer dimensions, and the subsequent area allotted per animal for all loads surveyed1
| Transportation characteristics | Number of trailers | Mean | Std. dev. | Min. | Max. |
|---|---|---|---|---|---|
| All trailers | |||||
| Time traveled, h | 151 | 6.7 | 6.36 | 0.2 | 39.5 |
| Distance traveled, km | 145 | 455.7 | 440.76 | 3.2 | 2,273.8 |
| Number of cattle in load | 154 | 26 | 13.38 | 1 | 47 |
| Number of compartments used | 152 | 4 | 1.71 | 1 | 7 |
| Trailer area, m2 | 151 | 33.5 | 10.24 | 8.9 | 43.4 |
| Area allotted per animal, m2 | 151 | 2.3 | 3.30 | 0.6 | 20.2 |
| Pot belly trailers | |||||
| Time traveled, h | 100 | 9.3 | 6.25 | 0.2 | 39.5 |
| Distance traveled, km | 95 | 639.8 | 436.38 | 3.21 | 2,273.8 |
| Number of cattle in load | 102 | 35 | 4.88 | 23 | 47 |
| Number of compartments used | 101 | 5 | 1.08 | 2 | 7 |
| Trailer area, m2 | 101 | 40.0 | 2.89 | 17.8 | 43.4 |
| Area allotted per animal, m2 | 101 | 1.2 | 0.17 | 0.6 | 1.7 |
| Mixed-sex loads | |||||
| Time traveled, h | 51 | 8.3 | 5.05 | 0.2 | 19.3 |
| Distance traveled, km | 45 | 623.6 | 412.42 | 3.2 | 1,508.0 |
| Number of cattle in load | 51 | 34 | 8.71 | 5 | 47 |
| Number of compartments used | 50 | 5 | 1.21 | 2 | 7 |
| Trailer area, m2 | 50 | 39.5 | 5.33 | 15.6 | 43.4 |
| Area allotted per animal, m2 | 50 | 1.2 | 0.48 | 0.9 | 4.2 |
Ten percent of cattle trucks were sampled within a day's production at each beef processor during the audit.
A wide variation in trailer dimensions was observed as a result of multiple trailer types used to transport cattle to harvest. Pot belly trailers (67.1%) were the primary type of trailer used to transport cows and bulls to market, followed by gooseneck trailers (30.3%). Pot belly trailers offer greater capacity and allow for group separation through use of center gates and compartments. Of the pot bellies surveyed, 65.3% (n = 95) used the center gate to separate cattle (data not in tabular form). On average, 5 compartments were used for cattle separation in pot belly trailers during transit (Table 3). Nearly 11% (10.8%; n = 93) of pot bellies surveyed utilized the smaller compartment located at the back of the trailer intended for hauling lighter weight, smaller-framed cattle; this is 5.1% points lower than the previous survey (data not in tabular form; Nicholson, 2008). It is important for transporters to understand the weight and size limitations for hauling cattle in this particular compartment. This decrease in percentage points since the NMCBBQA–2007 suggests that there may be fewer transporters using this small compartment. Use of center gate and compartmental divisions provides evidence that transporters may be separating cattle using other compartments to minimize carcass bruising and animal welfare concerns.
Bulls and young bulls transported to a Columbian harvest facility yielded carcasses with a greater incidence of bruising than cow carcasses evaluated in the same study (Strappini et al., 2009). Weeks et al. (2002) described a lesser frequency of bruises on bull carcasses than heifer and steer carcasses. Jarvis et al. (1995) observed a greater incidence of bruising in mixed (heifer and steer) groups and steer-only groups than heifers and bulls independently transported. Researchers speculated that the disruption of cohesive groups, whether that be groups familiar with each other on the farm or ranch or groups of cows mingled with groups of bulls, contributes to the variation in observed carcass bruising (Jarvis et al., 1995; Weeks et al., 2002; Strappini et al., 2009). In the current study, we observed that 64.4% (n = 48) of mixed-sex loads were not hauling cows and bulls in separate compartments (data not in tabular form). This is only a slight percentage change (–2.3% points) from the 66.7% observed in 2007 (Nicholson, 2008). Therefore, segregating cows and bulls during transit may help minimize carcass bruising.
Mobility
Using the scoring system for cattle mobility and locomotion (North American Meat Institute Animal Welfare Committee, 2015), the majority of cattle were assigned a score of 1, walking normal with no apparent lameness (Table 4). Dairy animals had the greatest incidence of minor stiffness, shortness of stride and a slight limp (score 2) when coming off the trucks. This is not surprising given the production management system utilized in the dairy industry; 38.9% of all dairies in 17 dairy-producing states housed lactating cows in tie stalls or stanchions which have hard surfaces (USDA-APHIS Veterinary Services National Animal Health Monitoring System, 2016). Cook and Nordlund (2009) found the greatest rates of lameness in dairy herds to occur in intensively managed, zero-grazed free stall systems. Nonetheless, dairy cows have seen the greatest improvement in soundness (Fig. 1) since 2007, most likely due, in part, to the inception of the National Dairy Farmers Assuring Responsible Management Program, which encourages commitment to quality farm management practices and safe, wholesome dairy products (National Milk Producer's Federation, 2017). Compared to the NMCBBQA–2007, percentages of sound animals have changed +24.6%, +14.2%, +3.3%, and –0.8%-points for dairy cows, beef bulls, beef cows, and dairy bulls, respectively (Nicholson, 2008).
Table 4.
National Beef Quality Audit (NBQA): Percentage of mobility scores1 and downers in all cattle surveyed
| Type of animal | n | Mobility score | ||||
|---|---|---|---|---|---|---|
| 1 | 2 | 3 | 4 | Downers2 | ||
| Beef cows | 1,557 | 87.1 | 10.2 | 2.3 | 0.1 | 0.2 |
| Dairy cows | 1,743 | 76.0 | 18.2 | 4.7 | 0.3 | 0.9 |
| Beef bulls | 321 | 82.9 | 13.7 | 3.4 | 0.0 | 0.0 |
| Dairy bulls | 52 | 76.9 | 19.2 | 3.9 | 0.0 | 0.0 |
Mobility scores were assigned as 1) walks normal with no apparent lameness; 2) exhibits minor stiffness, shortness of stride, slight limp, but still keeps up with normal cattle; 3) exhibits obvious stiffness, difficulty taking steps, walks with an obvious limp and discomfort, and lags behind normal cattle; 4) extremely reluctant to move even when encouraged (North American Meat Institute Animal Welfare Committee, 2015).
Cattle unable to rise.
Figure 1.
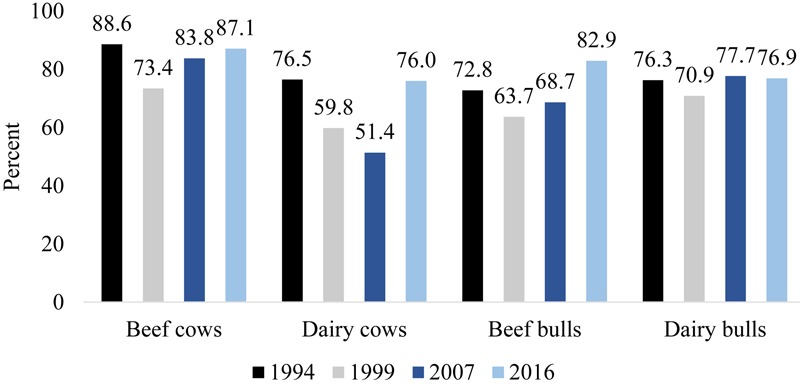
National Beef Quality Audit (NBQA): Percentage of sound (normal mobility) cattle observed in each of the National Market Cow and Bull Beef Quality Audits. Total number of observations were National Non-Fed Beef Quality Audit-1994: beef cows (n = 1,548), dairy cows (n = 1,013), beef bulls (n = 254), dairy bulls (n = 38); National Market Cow and Bull Beef Quality Audit-1999: beef cows (n = 2,237), dairy cows (n = 1,108), beef bulls (n = 419), dairy bulls (n = 79); NMCBBQA-2007: beef cows (n = 2,807), dairy cows (n = 2,112), beef bulls (n = 431), dairy bulls (n = 130); NBQA–2016: beef cows (n = 1,557), dairy cows (n = 1,743), beef bulls (n = 321), dairy bulls (n = 52; Smith et al., 1994; Roeber et al., 2000; Nicholson, 2008).
Although the majority of cows were determined to be sound in the current audit, it is important to realize the need to cull cows before lameness becomes too advanced; Garbarino et al. (2004) and Hernandez et al. (2005) reported lame cattle to have decreased cyclicity and longer postpartum intervals, respectively. In addition, Green et al. (2002) identified milk yield was reduced in lame cattle. Thus, lame cows should be culled early to reduce profit loss due to decreased reproductive health and milking efficiency.
Live Cattle Evaluation
Figure 2 illustrates the representation of muscle scores among all cattle types surveyed. Beef cows, beef bulls, and dairy bulls had the greatest frequency of average muscling (muscle score 3). It was determined that 66.6% of dairy cows were given the lowest muscle score (score 1). Therefore, it is not surprising that a greater percentage of score 1 dairy cows were seen compared to other cattle types. Nonetheless, 66.6% is almost 32% greater than what was reported in 2007 (Nicholson, 2008). If the cow's condition is sufficient for extended retention and it is economically feasible, producers should attempt to increase muscle score before marketing. This may minimize carcass bruising, increase pounds of lean, and reduce criticisms of animal handling practices for cull cows. Figure 3 illustrates the changes in the frequency of inadequately muscled animals being marketed during the four quality audits conducted. The beef cow population over the past 17 yr has continued to show drastic improvements in muscle. Fewer inadequately muscled dairy cows were marketed in 2007 than 1999, but in the current audit we saw remission to an increased frequency of inadequately muscled dairy cows being marketed (Nicholson, 2008). Muscle score can be used as a measure of condition and fitness of animals destined for market. Increasing feed for light-muscled cattle should be considered, as feeding concentrate diets prior to sale has been shown to increase muscle and fat in animals (Matulis et al., 1987; Schnell et al., 1997).
Figure 2.
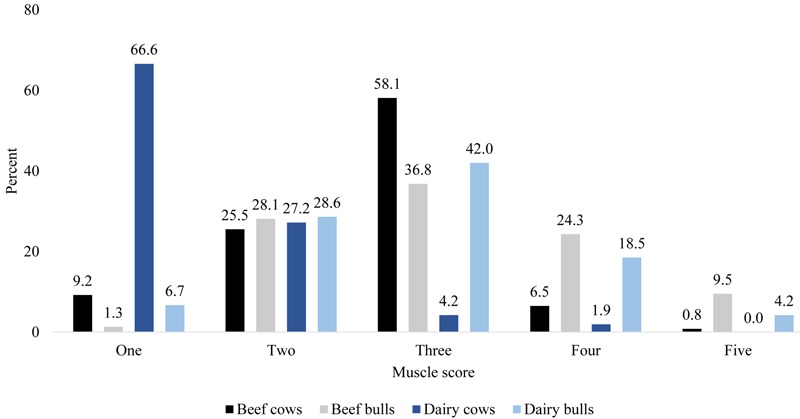
National Beef Quality Audit (NBQA): Frequency of muscle scores observed in surveyed animals. Muscle score was determined based on a 5-point scale: 1 = extremely light muscled, 3 = average muscled, 5 = extremely heavy muscled. Total number of observations were beef cows (n = 1,860), dairy cows (n = 2,809), beef bulls (n = 399), dairy bulls (n = 119).
Figure 3.
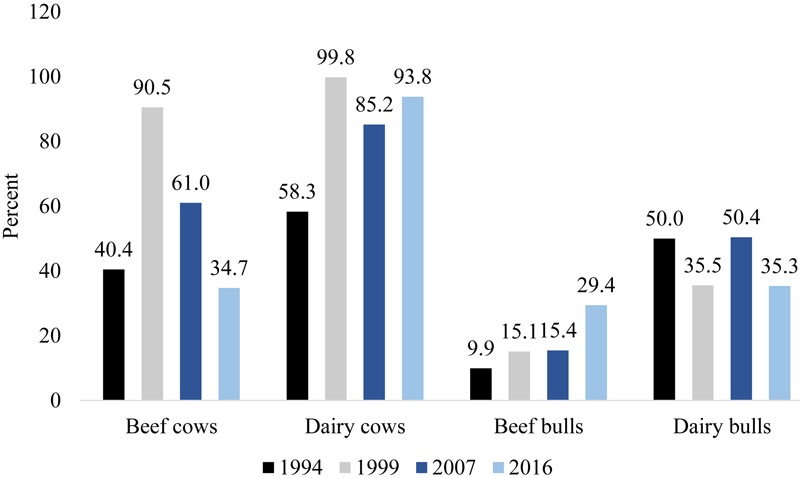
National Beef Quality Audit (NBQA): A comparison between the percentage of cattle that were inadequately muscled (assigned a muscle score 1 (extremely light muscled) and 2 (light muscled) on a 5-point scale) in 1994, 1999, 2007, and 2016. Total number of observations were National Non-fed Beef Quality Audit–1994: beef cows (n = 1,548), dairy cows (n = 1,013), beef bulls (n = 254), dairy bulls (n = 38); National Market Cow and Bull Beef Quality Audit–1999: beef cows (n = 2,237), dairy cows (n = 1,108), beef bulls (n = 419), dairy bulls (n = 79); NMCBBQA–2007: beef cows (n = 2,501), dairy cows (n = 1,954), beef bulls (n = 385), dairy bulls (n = 127); NBQA–2016: beef cows (n = 1,860), dairy cows (n = 2,809), beef bulls (n = 399), dairy bulls (n = 119; Smith et al., 1994; Roeber et al., 2000; Nicholson, 2008).
In tandem with muscle score, body condition score is one useful tool for determining the market readiness of cows and bulls. The mean body condition score (9-point scale) for both beef cows (n = 1,910) and beef bulls (n = 406) was 4.7 (not in tabular form). The mean body condition score (5-point scale) for dairy cows (n = 2,878) and dairy bulls (n = 121) was 2.6 and 3.3, respectively (not in tabular form). Data show there is a greater frequency of advanced-conditioned beef cows and a lesser frequency of beef cows that are too thin than what was reported in 2007 (not in tabular form; Nicholson, 2008). The same holds true for dairy cows; body condition scores for dairy cows improved substantially from 36.1% with body condition score of 3.0 or above in 2007 to 45.0% in 2016 (not in tabular form; Nicholson, 2008). In addition, the distribution of body condition in dairy cows has transitioned since 2007, as the greatest number of dairy cows in 2016 were assigned a condition score of 3.0 versus the greatest number in 2007 being assigned a condition score of 2.5 (Nicholson, 2008). It should be realized that while dairy cattle that are classified in the upper range of the dairy condition scale are being marketed, this most likely does not give evidence these animals are overly fat for some beef fabrication and retail marketing purposes. Conversely, beef cows and bulls with condition scores in excess of seven contribute to excessive pounds of fat trim at the processor.
Too low of a condition score (beef-score 1 and 2; dairy-score 1.0 and 1.5) may indicate to producers that an animal is unable to maintain condition, which comes with production shortfalls (i.e., raising a calf, breeding cows). Figure 4 shows the frequency of cows and bulls identified to be “too thin,” therefore, reducing their market potential. Cattle that are too thin may have too little fat creating increased potential for cold shortening on carcass cooling (Savell et al., 2005). They also are more prone to carcass bruising without the protective fat layer (Weeks et al., 2002). Also, too little fat may cause them to mobilize muscle as a source of energy further reducing their carcass merit.
Figure 4.
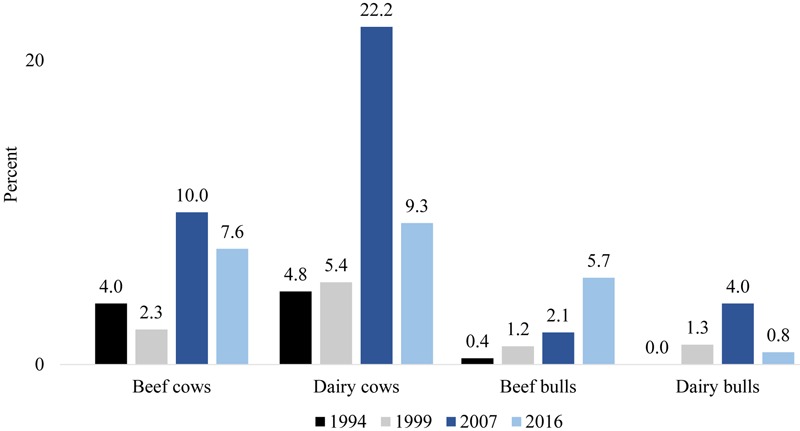
National Beef Quality Audit (NBQA): A comparison between the percentage of cattle that were assigned “too low” of a body condition score (beef score 1 and 2 (extremely thin) on a 9-point scale; dairy score 1.0 and 1.5 (extremely thin) on a 5-pt scale) in 1994, 1999, 2007, and 2016. Total number of observations were National Non-fed Beef Quality Audit–1994: beef cows (n = 1,548), dairy cows (n = 1,013), beef bulls (n = 254), dairy bulls (n = 38); National Market Cow and Bull Beef Quality Audit–1999: beef cows (n = 2,237), dairy cows (n = 1,108), beef bulls (n = 419), dairy bulls (n = 79); NMCBBQA–2007: beef cows (n = 2,800), dairy cows (n = 2,103), beef bulls (n = 431), dairy bulls (n = 124); NBQA–2016: beef cows (n = 1911), dairy cows (n = 2,878), beef bulls (n = 406), dairy bulls (n = 121; Smith et al., 1994; Roeber et al., 2000; Nicholson, 2008). Dairy cattle in 1994 and 1999 were condition scored based on the same 9-point scale as beef cattle.
In contrast, cattle that are too fat (beef-score 8 or 9; dairy-score 4.5 or 5.0) are subject to producing excessive fat trim, which has been identified as a significant lost opportunity for the beef industry (National Cattlemen's Beef Association, 2017). Figure 5 shows the percentage of cattle identified to be over-conditioned in 2016. Since 1994, fewer over-conditioned beef cows are being marketed. There was a 1.3% point decrease in the frequency of over-conditioned beef bulls. Just as expected due to the finish traits of dairy cattle, the data show very few over-conditioned dairy cows were marketed.
Figure 5.
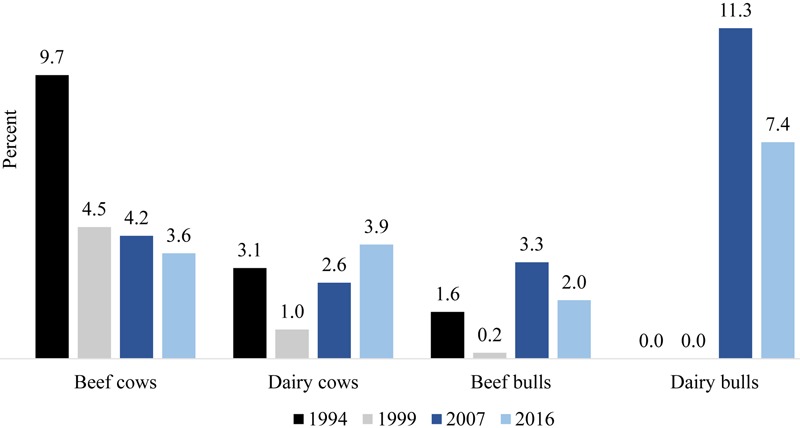
National Beef Quality Audit (NBQA): A comparison between the percentage of cattle that were over-conditioned [beef score 8 and 9 (extremely fat) on a 9-point scale; dairy score 4.5 and 5.0 (extremely fat) on a 5-pt scale] in 1994, 1999, 2007, and 2016. Total number of observations were National Non-fed Beef Quality Audit–1994: beef cows (n = 1,548), dairy cows (n = 1,013), beef bulls (n = 254), dairy bulls (n = 38); National Market Cow and Bull Beef Quality Audit–1999: beef cows (n = 2,237), dairy cows (n = 1,108), beef bulls (n = 419), dairy bulls (n = 79); NMCBBQA–2007: beef cows (n = 2,800), dairy cows (n = 2,103), beef bulls (n = 431), dairy bulls (n = 124); NBQA–2016: beef cows (n = 1,911), dairy cows (n = 2,878), beef bulls (n = 406), dairy bulls (n = 121; Smith et al., 1994; Roeber et al., 2000; Nicholson, 2008). Dairy cattle in 1994 and 1999 were condition-scored based on the same 9-point scale as beef cattle.
Physical defects which impair reproductive efficiency or result in economic losses also are important factors in determining market readiness of cows and bulls. A large majority of cattle surveyed had no defects present when evaluated at the processing facilities (Fig. 6). This may indicate animals were culled for reasons not visible to researchers, including behavior, reproductive inability, or genetic replacement. Nonetheless, researchers did observe the presence of at least one visible defect in 44.1, 32.1, 27.9, and 24.2% of dairy cows, beef bulls, beef cows, and dairy bulls, respectively (not in tabular form). Compared to the 2007 audit, an increased frequency of at least one defect was seen in dairy cows (+7.1% points), beef bulls (+8.2% points) and dairy bulls (+4.5% points; Nicholson, 2008). Overall, defect frequencies (single versus multiple defects) indicate that producers were more likely to cull animals after observing a single defect rather than holding that animal until other conditions occurred (Fig. 6), showing most producers are marketing animals in a timely manner.
Figure 6.
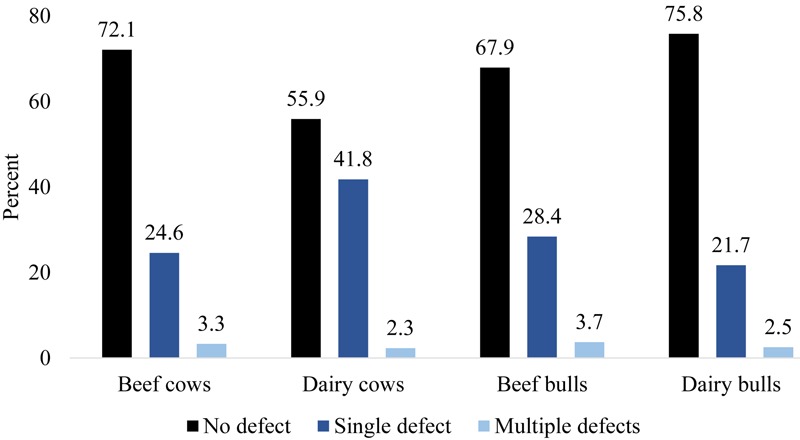
National Beef Quality Audit (NBQA): Distribution of defects observed on cattle surveyed. Total number of observations were beef cows (n = 1,912), dairy cows (n = 2,855), beef bulls (n = 402), dairy bulls (n = 120). Defects included: bottle teats, broken penis, failed suspensory ligament, foot abnormality, full bag, lumpy jaw, mastitis, multiple udder problems, retained placenta, swollen joints, and warts.
Bovine ocular neoplasia (cancer eye), which is a concern for both a cosmetic and welfare reasons, was not identified in 99.0% of all cattle surveyed (not in tabular form). Non-reproductive defect frequencies are shown in Fig. 7. Foot abnormalities in beef bulls were more prevalent than cows or dairy bulls, and occurred more frequently in 2016 than in 2007 (+6.4% points; Nicholson, 2008). Nicholson (2008) reported dairy cows had the greatest frequency of foot abnormalities of all cattle types surveyed in 2007. However, the percentage of dairy cattle characterized with a foot abnormality has fallen 5% points. Only a small percentage of cattle possessed some form of abscess. Of the abscesses observed in beef cows (n = 36), 55.6% were located on the face, 16.7% were located on the hooks or pins, and 8.3% were located on the knee or hock (not in tabular form). Dairy cattle abscesses (n = 85) were most frequently located on the knee or hock (50.6%) and only 20.0, 17.6, and 11.8% were located on the hooks and pins, face, or “other” area (i.e., shoulder, brisket, round, withers and rib), respectively. Nearly 82% of the abscesses in beef bulls (n = 11) were on the face. Lumpy jaw was observed in 1.2% of beef cows and 0.5% of beef bulls surveyed.
Figure 7.
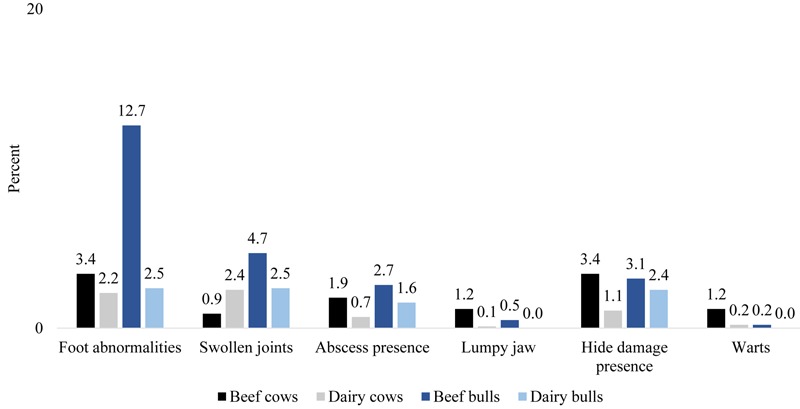
National Beef Quality Audit (NBQA): Distribution of live animal defects pertinent to all surveyed cattle. Total number of observations were beef cows (n = 1,913), dairy cows (n = 2,856), beef bulls (n = 402), dairy bulls (n = 120).
Reproductive soundness is often compromised in cows that show signs of failed suspensory ligaments, mastitis, udder problems, and retained placentas. These reproductive defects were observed in surveyed cattle at frequencies outlined in Fig. 8. Dairy cows had the greatest incidence of reproductive defects, with the exception of bottle teats for which beef cows had the greater frequency. Bottle teats were previously reported (Frisch, 1982) to cause higher calf mortality due to inadequate milk production to support the calf. Dairy cows (14.7%) in the current audit had a much greater frequency of failed suspensory ligaments compared to the 3.6% reported in 2007 (Nicholson, 2008). Conversely, dairy cows surveyed in 2016 had a lesser frequency (–6.1% points) of multiple udder defects than in 2007 (Nicholson, 2008). Beef cows had a greater rate of mastitis observance in 2016 than beef cows in 2007 (+1.7% points; Nicholson, 2008).
Figure 8.
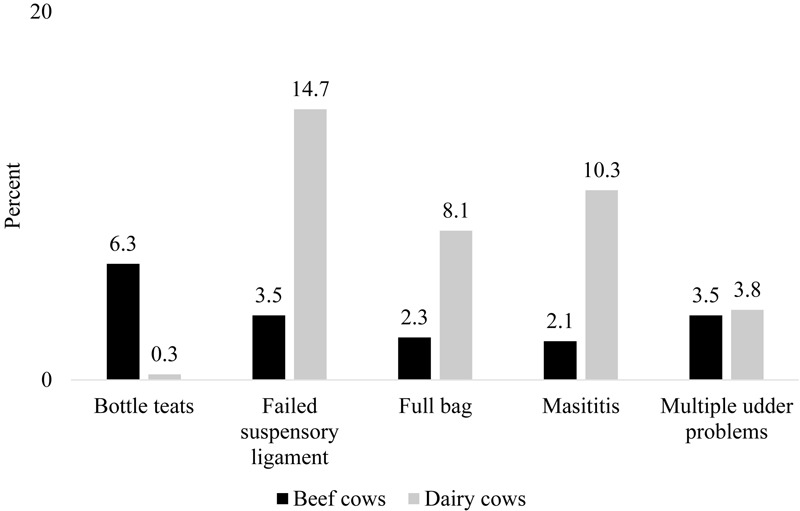
National Beef Quality Audit (NBQA): Distribution of defects associated with reproductive soundness in cows. Total number of observations were beef cows (n = 1,913) and dairy cows (n = 2,856).
Bulls are often culled for inability to breed cows. This could be caused by sperm infertility, a broken penis, an incapacity to travel across range due to structural feet and leg problems, or loss of libido. Observations indicated that 6.7% of beef bulls (n = 402) and 0.0% of dairy bulls (n = 120) had broken penises. In 2007, there was higher incidence (+3.8% points) of broken penises in dairy bulls compared to the current audit (Nicholson, 2008).
Horn presence may be a cause of carcass bruising (Shaw et al., 1976; Grandin, 1980). Therefore, the cattle were surveyed for presence and length of horns (Table 5). Of the cattle evaluated, horns were not seen on 90.3, 87.9, 82.7, and 69.0% of beef cows, dairy cows, beef bulls, and dairy bulls, respectively. These are higher frequencies than reported for beef cows (80.8%), beef bulls (79.3%), and dairy bulls (54.8%) in 2007 (Nicholson, 2008). The greatest frequency of horned beef cattle (4.5% cows; 10.1% bulls) had horn lengths greater than 12.7 cm. In contrast, the greatest frequency of horned dairy cattle (7.0% cows; 16.7% bulls) had horn lengths less than 2.54 cm. This may indicate dairy producers are more effectively tipping horned cattle to ensure safety for animals and handlers during the production lifetime of animals. This also inadvertently helps minimize undue carcass bruising.
Table 5.
National Beef Quality Audit (NBQA): Percentage of horn presence and size in surveyed cattle
| Horn size | Beef cows (n = 2,094) | Dairy cows (n = 2,584) | Beef bulls (n = 398) | Dairy bulls (n = 84) |
|---|---|---|---|---|
| No horns | 90.3 | 87.9 | 82.7 | 69.0 |
| < 2.54 cm | 1.9 | 7.0 | 2.5 | 16.7 |
| 2.54 cm to 12.7 cm | 3.4 | 4.6 | 4.8 | 13.1 |
| > 12.7 cm | 4.5 | 0.5 | 10.1 | 1.2 |
A knot, generally defined as a swelling resulting from an inappropriate intramuscular or subcutaneous injection of animal health products, poses a potential quality concern in the beef and dairy industries (Roeber et al., 2000). If animal health products are not administered subcutaneously in the neck region and instead administered in more valuable muscles, there can be increased incidence of injection-site lesions visible in high-valued primals and subprimals during fabrication. This causes significant loss in meat yield. Of the cattle surveyed (n = 5,160), 97.9% displayed no visible sign of a knot (not in tabular form). Of the knots visible (n = 109), 45.0% were observed in the neck, 14.7% in the shoulder, 14.7% in the top butt, 6.4% in the round, and 19.3% elsewhere not specified by recorders (not in tabular form). Knots in the neck do not pose a quality concern, as the Beef Quality Assurance program advocates animal health injections being administered subcutaneously in the neck, the least valuable area in the carcass (Beef Quality Assurance Advisory Board, n.d.). In 2007, 2.6% of all cattle surveyed (n = 5,520) had a knot in the neck, 4.6% in the shoulder, 0.2% in the top butt, and 0.5% in the round (Nicholson, 2008). Compared to the 2016 survey results, where 0.9, 0.3, 0.3, and 0.1% of all cattle (n = 5,160) had a knot in the neck, shoulder, top butt, and round, respectively, it appears efforts to reduce injection-site lesions through Beef Quality Assurance training and producer education have been effective.
Hide Evaluation
Roeber et al. (2000) identified branding as a management practice that reduces the value of cattle hides. Branding has been a practice that dates back to 2700 B.C. (Stamp, 2013). Although hot-iron branding is the most permanent form of identification, it also provides a means for devaluation of the hide. At $53 USD/hide piece (USDA-AMS, 2017), cow hides are valued at 3 times that of other offal by-products making it the most valuable item in the drop credit. In the NMCBBQA–1999, branded hides were identified as being the cause for an industry loss of $6.27 USD per animal (Roeber et al., 2000). The dollar value lost due to hide brands and latent damage in 2016 was determined to be $7.47 USD per animal (National Cattlemen's Beef Association, 2017). Therefore, it is imperative that producers make attempts at preventing hide depreciation.
Of the cattle surveyed, 22.7% had at least one brand visible on the hide (not in tabular form). This is an improvement of 0.9% points from 2007 (Nicholson, 2008). The percentage of brand occurrence on beef cattle hides (35.7%) was greater compared to dairy cattle (10.7%; not in tabular form). Therefore, branding and the loss of hide value is a greater concern in beef cattle. This is expected because traditional beef cattle management involves the branding of calves following the calving season, a management practice that is not utilized heavily in the dairy industry.
Figure 9 shows the percentage of cattle with no brand, one brand, or multiple brands. The overwhelming percentage of cattle had unbranded hides. Nine years ago, 90.1, 68.7, and 62.4% of dairy cows, beef cows, and beef bulls, respectively, had unbranded (native) hides (Nicholson, 2008). Interestingly, only 71.9% of dairy bulls in 2007 had native hides, which is numerically fewer than 2016 (Nicholson, 2008).
Figure 9.
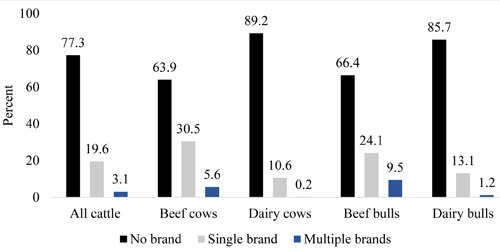
National Beef Quality Audit (NBQA): Percentage of cattle with no brands, single brands and multiple brands. Total number of observations were all cattle (n = 5,262), beef cows (n = 2,106), dairy cows (n = 2,618), beef bulls (n = 403), dairy bulls (n = 84).
Even though branding is still a traditional practice in maintaining the heritage of cattle ranching, preserving ownership, and is required in some states, producers can minimize value loss by branding cattle on the butt or shoulder rather than the side. On cattle surveyed, butt brands were present at a greater rate than either side or shoulder brands (Table 6). Dairy animals surveyed in 2016 had a lesser frequency of side brands when compared to those reported in the NMCBBQA–2007, whereas beef animals surveyed had a greater frequency of side brands than those reported by Nicholson (2008). The frequency of butt branding decreased in dairy bulls, yet increased in all other cattle types compared to 2007 (Nicholson, 2008). The only incidence of increased shoulder brand frequency from the findings of Nicholson (2008) to the current audit was observed on beef cows. Notably, 9 yr ago, shoulder brand frequency in dairy bulls was 5.2%, when none were observed in the present study for this cattle type (Nicholson, 2008). Brand location is most important to producers registering a new brand through their state or county brand law program. Existing brands already have specified locations, but new brands being registered should be placed either on the butt or shoulder to help mitigate the value loss to hides.
Table 6.
National Beef Quality Audit (NBQA): Percentage of cattle with a brand located on the butt, side, and shoulder
| Brand location | n | Percentage1, % |
|---|---|---|
| Butt brands | ||
| Beef cows | 2,106 | 25.5 |
| Dairy cows | 2,618 | 9.5 |
| Beef bulls | 42 | 27.4 |
| Dairy bulls | 84 | 14.3 |
| Side brands | ||
| Beef cows | 2,107 | 11.8 |
| Dairy cows | 2,619 | 0.9 |
| Beef bulls | 402 | 9.7 |
| Dairy bulls | 84 | 0.0 |
| Shoulder brands | ||
| Beef cows | 2,107 | 2.8 |
| Dairy cows | 2,619 | 0.4 |
| Beef bulls | 402 | 0.4 |
| Dairy bulls | 84 | 0.0 |
Percentages do not add to 100% because n also includes cattle that were unbranded.
Not only is location of a brand important for minimizing hide devaluation, but size of the brand also plays an important role. Large brands spanning a significant portion of the hide, especially over the midsection of an animal, lower hide value because of decreased usable surface area (Gugelmeyer, 2010). The greatest mean area occupied by a brand was observed on the sides of beef cows (Table 7). There was also a large variation in the size of side brands on beef cows.
Table 7.
National Beef Quality Audit (NBQA): Mean size (cm2) of brands located on the butt and side of all branded cattle surveyed
| Animal type | n 1 | Mean | Std. dev. | Min. | Max. |
|---|---|---|---|---|---|
| Beef cows | |||||
| Butt | 534 | 191.5 | 216.88 | 12.9 | 1548.4 |
| Side | 248 | 623.2 | 1048.45 | 19.4 | 8361.3 |
| Dairy cows | |||||
| Butt | 231 | 502.3 | 342.64 | 25.8 | 2090.3 |
| Side | 20 | 303.2 | 311.50 | 25.8 | 1451.6 |
| Beef bulls | |||||
| Butt | 110 | 201.8 | 203.96 | 25.8 | 1161.3 |
| Side | 39 | 435.1 | 403.97 | 19.4 | 1858.06 |
| Dairy bulls2 | |||||
| Butt | 12 | 324.2 | 194.97 | 64.5 | 645.2 |
Sample size is a reflection of branded cattle. Cattle with native hides were excluded.
Dairy bulls had no incidence of side brands.
Hide-off Carcass Evaluation
For all cow carcasses evaluated, 35.9% did not have a bruise (Table 8). This is similar to the frequency of cow carcasses (36.6%) which did not have a bruise in 2007 (Nicholson, 2008). Although over half of the cow carcasses surveyed in the current year were bruised, the majority (67.3%) possessed a bruise of minimal severity, meaning less than 0.45 kg of surface trim would be removed due to bruise damage. In addition, fewer carcasses had critical bruising compared to 2007 (Nicholson, 2008), indicating a lesser frequency of bruises resulting in 4.99 kg to 18.14 kg of surface trim. Table 9 indicates even further that all 4 classes of carcasses surveyed had the greatest incidence of minimal bruises and the lowest incidence of critical or extreme bruises. Multiple bruises were observed on 41.3% of dairy cow and 24.0% of beef cow carcasses, respectively (not in tabular form). In comparison, 25.2% of dairy bull and 13.5% of beef bull carcasses had multiple bruises (not in tabular form).
Table 8.
National Beef Quality Audit (NBQA): Carcass bruise severity over the past twenty-two years in cows and bulls surveyed1,2,3
| Bruise severity | 1994 | 1999 | 2007 | 2016 |
|---|---|---|---|---|
| Cows | ||||
| n | Unknown | 4,848 | 5,092 | 4,262 |
| No bruise | 20.3% | 11.8% | 36.6% | 35.9% |
| Minimal4 | 51.5% | 77.2% | 36.7% | 67.3% |
| Major4 | 53.9% | 41.7% | 30.9% | 45.1% |
| Critical4 | 30.7% | 21.6% | 12.4% | 4.9% |
| Extreme4 | nd5 | 2.4% | 5.4% | 1.4% |
| Bulls | ||||
| n | Unknown | 831 | 477 | 389 |
| No bruise | 63.8% | 47.1% | 46.8% | 57.1% |
| Minimal | 25.3% | 44.4% | 31.5% | 42.4% |
| Major | 19.5% | 16.7% | 20.1% | 21.9% |
| Critical | 7.4% | 6.9% | 11.5% | 1.5% |
| Extreme | nd5 | 1.0% | 7.6% | 0.3% |
National Non-Fed Beef Quality Audit–1994 (Smith et al., 1994); National Market Cow and Bull Beef Quality Audit–1999 (Roeber et al., 2000); National Market Cow and Bull Beef Quality Audit–2007 (Nicholson, 2008).
Total number of observations for cow carcass bruises were: unknown (NNFBQA–1994); 4,848 (NMCBBQA–1999); 5,092 (NMCBBQA–2007); 4,262 (NBQA–2016). Total number of observations for bull carcass bruises were: unknown (NNFBQA–1994); 831 (NMCBBQA–1999); 477 (NMCBBQA–2007); 389 (NBQA–2016).
Percentages do not add to 100% because some animals possessed multiple bruises, some of varying severity.
Minimal (< 0.45 kg carcass trim); major (0.45 kg to 4.54 kg carcass trim); critical (5.0 kg to 18.14 kg carcass trim); extreme (entire primal was trimmed).
nd = not determined.
Table 9.
National Beef Quality Audit (NBQA): Frequency (%) of bruise severity
| Severity1 | Beef cows | Dairy cows | Beef bulls | Dairy bulls |
|---|---|---|---|---|
| Minimal | 53.6 | 57.5 | 57.2 | 74.3 |
| Major | 39.7 | 37.6 | 38.8 | 24.8 |
| Critical | 5.6 | 3.7 | 3.9 | 0.0 |
| Extreme | 1.0 | 1.2 | 0.0 | 1.0 |
Minimal (< 0.45 kg carcass trim); major (0.45 kg to 4.54 kg carcass trim); critical (5.0 kg to 18.14 kg carcass trim); extreme (entire primal was trimmed).
Roeber et al. (2000) reported that carcass bruising was the 6th cause of whole carcass condemnation in 1999, and encouraged producers to employ handling practices to minimize bruising. Later in 2007, interviews with packers, producers, and retailers established improvements in carcass bruising had been made (National Cattlemen's Beef Association Beef Quality Assurance Program, 2007). Even so, carcass bruising was still included in the list of top quality challenges in 2007 (National Cattlemen's Beef Association Beef Quality Assurance Program, 2007). Based on the results of the 2016 audit, there is still opportunity to decrease the prevalence of carcass bruising.
Of the bruises reported in cow carcasses, the greatest percentage were located on the round and sirloin. Bull carcasses tended to have a greater frequency of bruises on the brisket, plate, and flank region when compared to cow carcasses. Bruises that occur within 24 h of harvest are often a direct result of handling practices and facility design. As outlined in previous audits, carcass bruising costs the industry each year (Smith et al., 1994; Roeber et al., 2000); according to the National Cattlemen's Beef Association (1994), $11.47 USD was lost per animal in 1994 due to the influence of carcass bruising. Likewise, Boleman et al. (1998) found that carcass bruising costs the steer and heifer beef industry $14,452,000 USD annually. In addition, it was reported that $2.24 USD of value was lost per animal due to bruising in 1999 (National Cattlemen's Beef Association, 2017). Thus, there needs to be a continued emphasis placed on proper cattle handling for the purpose of reducing bruising and associated value loss of beef carcasses.
Nearly all cattle surveyed (98.4%) in the current audit had no visible indication of an injection-site lesion on the carcass surface (data not shown in tabular form). Not only is this an improvement of nearly 5% points compared to 2007 (93.5%), but also only 1.7% of dairy cow carcasses showed signs of injection-site lesions compared to 11.2% reported in the previous audit (Nicholson, 2008).
Conclusions
Results from the NBQA–2016 show live cattle and carcass quality improvements in the market cow and bull beef sector compared to 2007. The most notable improvements include an increase in the percentage of cattle with normal mobility (particularly dairy cattle) a transition from thinner to more moderate body conditioned dairy cattle, and a decrease in the percentage of critical and extreme bruising on all carcasses. Producers, academics, industry professionals, and government agencies may use the findings from the NBQA–2016 to direct the future of the cow and bull industry. Emphasis for extension education, beef quality assurance programs, and future research should be focused toward appropriate management of cull cows and bulls to increase muscle before harvest, marketing animals before physical defects are too severe and cause animal welfare concerns or carcass condemnations, and ways to further improve carcass bruising on the farm, in transport, and at the packing facility.
Footnotes
This study was funded, in part, by the Beef Checkoff.
LITERATURE CITED
- Beef Quality Assurance Advisory Board. n.d Beef quality assurance national manual. Centennial, Colorado: http://www.bqa.org/Media/BQA/Docs/nationalmanual.pdf (accessed 28 February 2017). [Google Scholar]
- Boleman S. L., Boleman S. J., Morgan W. W., Hale D. S., Griffin D. B., Savell J. W., Ames R. P., Smith M. T., Tatum J. D., Field T. G., Smith G. C., Gardner B. A., Morgan J. B., Northcutt S. L., Dolezal H. G., Gill D. R., Ray F. K. 1998. National Beef Quality Audit-1995: Survey of producer-related defects and carcass quality and quantity attributes. J. Anim. Sci. 76:96–103. doi: 10.2527/1998.76196x [DOI] [PubMed] [Google Scholar]
- Cook N. B., Nordlund K. V. 2009. The influence of the environment on dairy cow behavior, claw health and herd lameness dynamics. Vet. J. 179:360–369. doi: 10.1016/j.tvjl.2007.09.016 [DOI] [PubMed] [Google Scholar]
- Elanco Animal Health 2009. The 5-point body condition scoring system. https://www.elanco.us/pdfs/ai10752-body-condition-score-insert.pdf (accessed 2 January 2017).
- Eversole D. E., Browne M. F., Hall J. B., Dietz R. E. 2009. Body condition scoring beef cows. https://www.pubs.ext.vt.edu/400/400-795/400-795.html (accessed 19 April 2017).
- Frisch J. E. 1982. The use of teat-size measurements or calf weaning weight as an aid to selection against teat defects in cattle. Anim. Prod. 35:127–133. doi: 10.1017/S0003356100000891 [DOI] [Google Scholar]
- Garbarino E., Hernandez J., Shearer J., Risco C., Thatcher W. 2004. Effect of lameness on ovarian activity in postpartum Holstein cows. J. Dairy Sci. 87:4123–4131. doi: 10.3168/jds.S0022-0302(04)73555-9 [DOI] [PubMed] [Google Scholar]
- Gelatt K. N. 2016. Ocular neoplasia in cattle. Merck Sharp & Dohme Corp., Kenilworth, New Jersey: http://www.merckvetmanual.com/eye-and-ear/neoplasia-of-the-eye-and-associated-structures/ocular-neoplasia-in-cattle (accessed 10 May 2017). [Google Scholar]
- Gilbert R. O. 2016. Retained fetal membranes in cows. Merck Sharp & Dohme Corp., Kenilworth, New Jersey: http://www.merckvetmanual.com/reproductive-system/retained-fetal-membranes-in-large-animals/retained-fetal-membranes-in-cows (accessed 10 May 2017). [Google Scholar]
- Grandin T. 1980. Bruises and carcass damage. Int. J. Study Anim. Probl. 1:121–137. [Google Scholar]
- Grandin T. 2013. Recommended animal handling guidelines & audit guide: A systematic approach to animal welfare. AMI Foundation, Washington, DC: http://animalhandling.org/ht/a/GetDocumentAction/i/93003 (accessed 20 December 2016). [Google Scholar]
- Green L. E., Hedges V. J., Schukken Y. H., Blowey R. W., Packington A. J. 2002. The impact of clinical lameness on the milk yield of dairy cows. J. Dairy Sci. 85:2250–2256. doi: 10.3168/jds.S0022-0302(02)74304-X [DOI] [PubMed] [Google Scholar]
- Gugelmeyer S. 2010. Brands can mean a major discount in the value of hides. http://www.hereford.org/static/files/1010_HidingValue.pdf (accessed 27 February 2017).
- Hernandez J., Garbarino E., Shearer J., Risco C., Thatcher W. 2005. Comparison of the calving-to-conception interval in dairy cows with different degrees of lameness during the prebreeding postpartum period. J. Am. Vet. Med. Assoc. 227:1284–1291. doi: 10.2460/javma.2005.227.1284 [DOI] [PubMed] [Google Scholar]
- Jarvis A. M., Selkirk L., Cockram M. S. 1995. The influence of source, sex class and pre-slaughter handling on the bruising of cattle at two slaughterhouses. Livest. Prod. Sci. 43:215–224. doi: 10.1016/0301-6226(95)00055-P [DOI] [Google Scholar]
- Lorenzen C. L., Hale D. S., Griffin D. B., Savell J. W., Belk K. E., Frederick T. L., Miller M. F., Montgomery T. H., Smith G. C. 1993. National Beef Quality Audit: Survey of producer-related defects and carcass quality and quantity attributes. J. Anim. Sci. 71:1495–1502. doi: 10.2527/1993.7161495x [DOI] [PubMed] [Google Scholar]
- Matulis R. J., McKeith F. K., Faulkner D. B., Berger L. L., George P. 1987. Growth and carcass characteristics of cull cows after different times-on-feed. J. Anim. Sci. 65:669–674. doi: 10.2527/jas1987.653669x [DOI] [PubMed] [Google Scholar]
- National Cattlemen's Beef Association 1994. The National Non-Fed Beef Quality Audit. National Cattlemen's Beef Association, Englewood, CO. [Google Scholar]
- National Cattlemen's Beef Association 2017. National Beef Quality Audit-2017: Market cows and bulls, Executive summary. National Cattlemen's Beef Association, Centennial, CO. [Google Scholar]
- National Cattlemen's Beef Association Beef Quality Assurance Program 2007. Executive summary of the 2007 National Market Cow and Bull Beef Quality Audit. National Cattlemen's Beef Association, Centennial, CO. [Google Scholar]
- National Milk Producer's Federation 2017. National Dairy Farmers Assuring Responsible Management (FARM) Program. Arlington, Virginia; http://www.nationaldairyfarm.com/about-farm#whatisfarm (accessed 29 August, 2017). [Google Scholar]
- Nicholson J. D. W. 2008. National Market Cow and Bull Beef Quality Audit-2007: A survey of producer-related defects. M.S. Thesis, Texas A&M University, College Station. [Google Scholar]
- Nicholson J. D. W., Nicholson K. L., Frenzel L. L., Maddock R. J., Delmore R. J., Jr, Lawrence T. E., Henning W. R., Pringle T. D., Johnson D. D., Paschal J. C., Gill R. J., Cleere J. J., Carpenter B. B., Machen B. V., Banta J. P., Hale D. S., Griffin D. B., Savell J. W. 2013. Survey of transportation procedures, management practices, and health assessment related to quality, quantity, and value for market beef and dairy cows and bulls. J. Anim. Sci. 91:5026–5036. doi: 10.2527/jas.2013-6283 [DOI] [PubMed] [Google Scholar]
- North American Meat Institute Animal Welfare Committee 2015. Mobility scoring for cattle. https://www.youtube.com/watch?v=QIslfHCvkpg (accessed 22 February 2017).
- Rasby R, n.d A guide to udder and teat scoring beef cows. University of Nebraska-Lincoln, Lincoln, NE: http://beef.unl.edu/learning/udder_score.shtml (accessed February 2, 2017). [Google Scholar]
- Roeber D. L., Belk K. E., Smith G. C., Tatum J. D., Field T. G., Scanga J. A., Smith C. D., Mies P. D., Foster H. A., Kennedy T. K., Moore B. R., Hodge S. G. 2000. Improving the consistency and competitiveness of market cow and bull beef; and, improving the value of market cows and bulls: The final report of the National Market Cow and Bull Beef Quality Audit-1999. Colorado State University, Fort Collins, CO. [Google Scholar]
- Roeber D. L., Cannell R. C., Wailes W. R., Belk K. E., Scanga J. A., Sofos J. N., Cowman G. L., Smith G. C. 2002. Frequencies of injection-site lesions in muscles from rounds of dairy and beef cow carcasses. J. Dairy Sci. 85:532–536. doi: 10.3168/jds.S0022-0302(02)74105-2 [DOI] [PubMed] [Google Scholar]
- Roeber D. L., Mies P. D., Smith C. D., Belk K. E., Field T. G., Tatum J. D., Scanga J. A., Smith G. C. 2001. National Market Cow and Bull Beef Quality Audit-1999: A survey of producer-related defects in market cows and bulls. J. Anim. Sci. 79:658–665. doi: 10.2527/2001.793658x [DOI] [PubMed] [Google Scholar]
- Savell J. W., Mueller S. L., Baird B. E. 2005. The chilling of carcasses. Meat Sci. 70:449–459. doi: 10.1016/j.meatsci.2004.06.027 [DOI] [PubMed] [Google Scholar]
- Schnell T. D., Belk K. E., Tatum J. D., Miller R. K., Smith G. C. 1997. Performance, carcass, and palatability traits for cull cows fed high-energy concentrate diets for 0, 14, 28, 42, or 56 days. J. Anim. Sci. 75:1195–1202. doi: 10.2527/1997.7551195x [DOI] [PubMed] [Google Scholar]
- Shaw F. D., Baxter R. I., Ramsay W. R. 1976. The contribution of horned cattle to carcase bruising. Vet. Rec. 98:255–257. doi: 10.1136/vr.98.13.255 [DOI] [PubMed] [Google Scholar]
- Smith G. C., Morgan J. B., Tatum J. D., Kukay C. C., Smith M. T., Schnell T. D., Hilton G. G. 1994. Improving the consistency and competitiveness of non-fed beef; and, improving the salvage value of cull cows and bulls; The final report of the National Non-Fed Beef Quality Audit-1994. Colorado State University, Fort Collins, CO. [Google Scholar]
- Smith G. W. 2016. Overview of actinomycosis. Merck Sharp & Dohme Corp., http://www.merckvetmanual.com/generalized-conditions/actinomycosis/overview-of-actinomycosis (accessed 22 June 2016). [Google Scholar]
- Stamp J. 2013. Decoding the range: The secret language of cattle branding. http://www.smithsonianmag.com/arts-culture/decoding-the-range-the-secret-language-of-cattle-branding-45246620/ (accessed 22 February 2017).
- Strappini A. C., Metz J. H. M., Gallo C. B., Kemp B. 2009. Origin and assessment of bruises in beef cattle at slaughter. Animal 3:728–736. doi: 10.1017/S1751731109004091 [DOI] [PubMed] [Google Scholar]
- USDA-AMS 2017. Weekly USDA by-product drop value (cow). United States Department of Agricultural Market News Des Moines, Iowa. https://www.ams.usda.gov/mnreports/nw_ls444.txt (accessed 27 February 2017).
- USDA-APHIS Veterinary Services National Animal Health Monitoring System 2016. Dairy 2014: Dairy cattle management practices in the United States, 2014. United States Department of Agriculture, Fort Collins, Colorado: https://www.aphis.usda.gov/animal_health/nahms/dairy/downloads/dairy14/Dairy14_dr_PartI.pdf (accessed 1 March 2017). [Google Scholar]
- Weeks C. A., McNally P. W., Warriss P. D. 2002. Influence of the design of facilities at auction markets and animal handling procedures on bruising in cattle. Vet. Rec. 150:743–748. doi: 10.1136/vr.150.24.743 [DOI] [PubMed] [Google Scholar]
- Yeh E., Anderson B., Jones P. N., Shaw F. D. 1978. Bruising in cattle transported over long distances. Vet. Rec. 103:117–119. doi: 10.1136/vr.103.6.117 [DOI] [PubMed] [Google Scholar]