

Abstract
The objective of this study was to characterize the milk yield (MY) and milk composition of relevant sheep and goat breeds raised around the world to be used with nutrition models for diet formulation and nutrient balancing. A 2-step approach was used. First, a database developed by the Food and Agriculture Organization was used to identify relevant breeds (i.e., frequently raised) by comparing the occurrence of transboundary breed names across countries. We selected transboundary breeds that occurred more than 3 times and other relevant breeds obtained from the specialized literature that had milk production information (e.g., MY, days in milk, and milk fat, protein, and lactose). The majority of sheep breeds were classified as nondairy (76%) because they lacked milk production information. Karakul and Merino accounted for up to 2.4% of sheep breeds raised around the world, whereas the other individual breeds accounted for less than 1%. In contrast, nondairy breeds of goats accounted for 46.3% and of the remaining 53.7%, Saanen, Boer, Anglo-Nubian, Toggenburg, and Alpine accounted for 6.5, 5, 4.4, 4, and 3%, respectively, of the transboundary breeds. Second, a database compiled from published studies for the selected sheep (n = 65) and goats (n = 78) breeds were analyzed using a random coefficients model (studies and treatments within studies as random effects). For sheep breeds, the average and SD were 1.1 ± 0.3 kg/d for MY, 6.9 ± 1% for milk fat, 5.4 ± 0.4% for milk protein, 5 ± 0.3% for milk lactose, 17.7 ± 1.4% for milk total solids, and 1,073 ± 91 kcal/kg of milk energy. Lacaune had the greatest MY compared to Comisana and Tsigai (1.65 versus 0.83 and 0.62 kg/d; respectively, P < 0.05), but milk components were not different among breeds. For goats breeds, the average and SD across breeds were 1.7 ± 0.6 kg/d for MY, 4.2 ± 0.9% for milk fat, 3.3 ± 0.4% for milk protein, 4.4 ± 0.4% for milk lactose, 12.7 ± 1.1% for milk total solids, and 750 ± 75 kcal/kg of milk energy. Alpine had similar MY to Saanen (2.66 versus 2.55 kg/d, respectively; P > 0.05), but greater (P < 0.05) than other breeds. The Boer breed had the greatest milk fat, protein, lactose, and total solids than several other breeds, leading to the greatest milk energy content (907 kcal/kg). Because there are many factors that can alter MY and milk composition, averages provided in this study serve as guidelines, and nutritionists must obtain observed values when using nutrition models.
Keywords: dairy, energy, fat, lactation length, lactose, protein
INTRODUCTION
Small ruminants [sheep (Ovis aries) and goats (Capra hircus)] accounts for about 56.9% of the global ruminant domestic population (cattle, buffalo, sheep, and goats) with 3,876 million heads in 2014, but their milk production constitutes a relatively small share of globally-produced ruminant milk, about 1.3% and 2.3%, respectively, when compared with dairy cattle (82.9%) and buffalo (13.4%); goats milk represent 63.5% whereas sheep milk accounts for only 36.5% of milk produced by small ruminants (Food and Agriculture Organization, FAO, 2017). Despite their small contribution to global milk output, sheep and goat farming plays a large socio-economic role in some specific economies, especially in developing countries (subsistence) or in Europe and Oceania (market trade).
The chemical composition of milk differs among animal species (Rezaei et al., 2016), but information such as milk yield (MY) and composition are fundamental to adequately meet the requirements for energy and nutrients of lactating animals when using nutrition models to formulate diets or supplements to achieve optimum production (Tedeschi et al., 2010). While actual or observed information is needed to use modern nutrition models, tabular values provide means to compare different breeds and to complete gaps when such information is not available. The National Research Council (NRC, 1996, 2000) and the most recent National Academies of Sciences, Engineering, and Medicine (2016) provided tabular values for critical inputs needed to characterize the lactation of relevant beef cattle breeds, but the NRC (2007) did not include such a table for small ruminants despite their requirement to properly formulate diets for lactating animals. Few publications have comparative values of milk composition for different breeds of sheep and goats. Therefore, the objective of this paper was to provide critical lactation information for selected most relevant domestic breeds of sheep and goats to be used in nutrition models.
MATERIALS AND METHODS
Identification of Relevant Breeds
The Domestic Animal Diversity Information System (DAD-IS; http://dad.fao.org/) developed by the FAO (2001) contains critical information about animal genetic resources around the world. The DAD-IS is a combination of 2 large databases: one that was originally developed by the European Federation for Animal Science Animal Genetic Data Bank program and one that was initially developed by the Animal Genetic Resources Group of FAO (Bittante, 2011). Unfortunately, some of the breeds listed in the DAD-IS are extinct and the DAD-IS database is not fully searchable and custom queries are not allowed at this time. The transboundary breed names from the DAD-IS database were used to identify relevant breeds. The transboundary breeds that were listed more than three times across countries and had milk production information were selected. Additionally, we included sheep and goat breeds listed by Haenlein (2007) that had the highest total milk yield and the breed descriptions of Porter et al. (2016) for high production importance based. Some breeds, however, have synonyms or different names within the same region. The selected relevant breeds of sheep and goats, including their synonyms and diffusion level, are listed in Table 1.
Table 1.
Most relevant breeds of sheep and goats based on the frequency of occurrence of transboundary names across countries
| Sheep breed | Synonyms | Diffusion level | Goat breed | Synonyms | Diffusion level |
|---|---|---|---|---|---|
| Awassi | Arab, Ivesi, Baladi, Deiri, Shami, Geizirieh | Cosmopolite | Alpine | Cosmopolite | |
| Fat Tailed | Norduz, Mehraban, Ghezel, Rahmani, Barki, Naeini | Local, Region | Anglo Nubian | Cosmopolite | |
| Chios | Country, Region | Boer | Cosmopolite | ||
| Comisana | Lentinese, Red Head, Testa Rossa, Faccia Rossa | Local | Canaria | Majorera, Palmera | Local |
| Dorset | Down, Horn | Cosmopolite | Chamoisée | Cosmopolite | |
| Lacaune | Cosmopolite | Damascus | Shami | Country, Region | |
| Karagouniki | Country, Region | La Mancha | Country, Region | ||
| Manchega | Alcarreña, Black Manchega, Montesina | Country | Malagueña | Málaga | Country |
| Finn-Sheep | Cosmopolite | Maltese | Malta | Cosmopolite | |
| East-Friesian | Cosmopolite | Murcia Granada | Murciano Granadina | Cosmopolite | |
| Merino | Cosmopolite | Nordic | Norwegian | Cosmopolite | |
| Sarda | Sardinian | Country | Saanen | Cosmopolite | |
| Tsigai | Tigai, Cigaja, Zigaja, Tzigaqa | Country, Region | Toggenburg | Cosmopolite |
Database Development
A literature review was conducted to gather lactation information and characteristics of the selected breeds of goats and sheep. The criteria for inclusion in the database were the existence of sample size, average, and SD for the following independent variables: lactation length (d), total milk yield throughout the lactation (kg), days in milk (DIM), MY (kg/d), milk fat (%), milk protein (%), milk lactose (%), and milk total solids (%). The milk energy content for sheep was computed as described by Cannas et al. (2004) and for goats as described by Tedeschi et al. (2010) using the equations proposed by Pulina et al. (1992).
Sheep breeds publications
A total of 65 publications (Appendix 1, Supplementary Material) were included in the database, as follows: Agriculture and Forestry (n = 1), Animal Production Science (n = 2), Animal Science (n = 1), Annales de Zootechnie (n = 1), Asian Journal of Animal and Veterinary Advances (n = 1), Australian Journal of Agricultural Research (n = 2), Canadian Journal of Animal Science (n = 1), Ciência Rural (n = 1), Czech Journal of Animal Science (n = 3), International Dairy Journal (n = 1), International Journal of Dairy Technology (n = 1), The Journal of Agricultural Science (n = 1), Journal of Applied Animal Research (n = 1), Journal Dairy Science (n = 14), Journal of Central European Agriculture (n = 1), Journal of Dairy Research (n = 4), Livestock Production Science (n = 2), MLjekarstvo (n = 2), New Zealand Journal of Agricultural Research (n = 4), Australian Society of Animal Production (n = 1), Small Ruminant Research (n = 17), Tropical Animal Health Production (n = 2), and Veterinaria (n = 1).
Goat breeds publications
A total of 78 publications (Appendix 1, Supplementary Material) were included in the database, as follows: Acta Scientiarum (n = 1), Agronomía Mesoamericana (n = 1), Animal production (n = 1), Animal (n = 2), Animal Feed Science and Technology (n = 2), Arquivos Brasileiro Medicina Veterinaria Zootecnia (n = 1), British Journal of Nutrition (n = 2), Ciência Agrotecnologia (n = 1), International Journal of ChemTech Research (n = 1), Italian Journal Animal Science (n = 1), Journal Animal Breeding and Genetics (n = 1), Journal Animal Physiology and Animal Nutrition (n = 1), Journal Dairy Science (n = 12), Journal of Agricultural and Food Chemistry (n = 1), Journal of Dairy Research (n = 4), Livestock Production Science (n = 2), Livestock Production Science (n = 2), Revista Brasileira de Saúde e Produção Animal (n = 1), Revista Brasileira de Zootecnia (n = 15), Revista Ciência Agronômica (n = 1), Revista de la Facultad de Ciencias Veterinarias (n = 1), South African Journal of Animal Science (n = 1), Small Ruminant Research (n = 19), Tropical Animal Health Production (n = 3), and Turk Journal Veterinary Animal Science (n = 2).
Statistical Analyses
All statistical analyses were conducted with SAS version 9.4 (SAS Inst. Inc., Cary, NC). A random coefficients model, using the PROC GLIMMIX, assumed the fixed effect of breeds and the random effect of studies and treatments within studies. The sample size divided by the SD (n/SD) of each independent variable served as a weight for all analyses. The DIM was used as a covariate, but preliminary analyses indicated that when n/SD was used as weight, DIM did not affect the independent variables significantly (P > 0.05); therefore, the covariate DIM was removed from the statistical models.
RESULTS AND DISCUSSION
Identification of Relevant Breeds
Based on the DAD-IS database, there are 1,096 breeds of goats (55% are local breeds) and 2,156 breeds of sheep (61% are local breeds). Local breeds occur only in one country. For local breeds, about 40% (n = 237) and 31% (n = 185) of the goat breeds are localized in Europe and Asia, respectively, while for sheep breeds about 58% (n = 757) and 20% (n = 268) are localized in Europe and Asia, respectively (FAO, 2001). Transboundary breeds, on the other hand, occur in more than one country, but they are the same breed with regionalized naming. Figure 1 has the occurrence proportion of transboundary breeds of sheep and goats.
Figure 1.
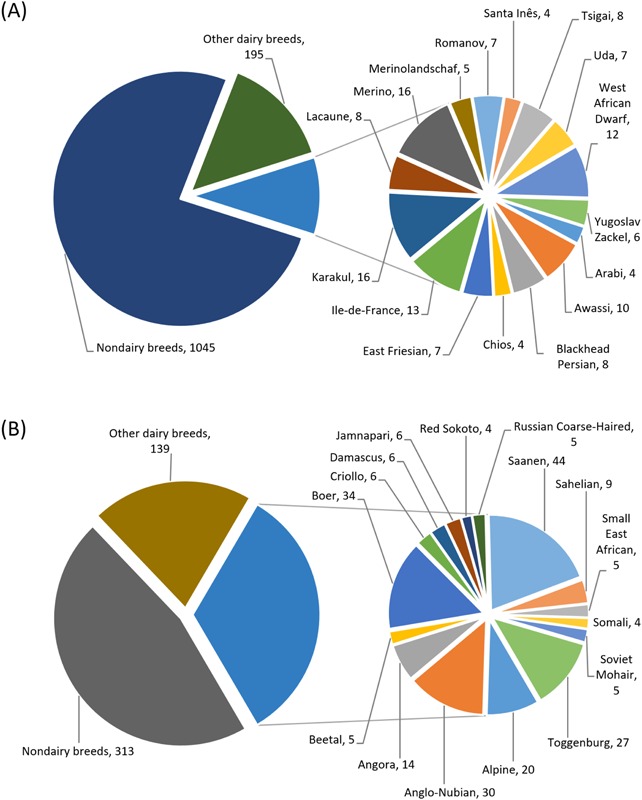
Frequency of occurrence of transboundary breeds of (A) sheep and (B) goats around the world based on the Domestic Animal Diversity Information System (DAD-IS) from the Food and Agriculture Organization (2001). Nondairy breeds are breeds that did not have milk production information; they do not necessarily represent meat, wool, or fiber breeds.
Sheep and goats adapt very easily to different production conditions, from arid to humid areas and from poor extensive production systems to intensive ones. In particular, in the Mediterranean region, the majority of sheep and all goats belong to dairy breeds, for which milk is the main product and meat is a secondary product (Gerber et al., 2013). Due to the high specialization of breeds and farming systems in Western Europe, small ruminants reach higher production levels and efficiency, and higher economic importance than in other temperate areas or in most developing countries (Opio et al., 2013). Among the Mediterranean countries that included the most part of the top 10 world sheep producers, Italy in particular plays an important role being one of the first world sheep milk producers and the top world sheep cheese exporter. In contrast, goat milk production in Italy is less important than in other European countries, such as Greece, Spain, and France, even though goat milk production is continuously growing and that of sheep is declining (FAO, 2017).
The Mason's World Encyclopedia of Breeds (Porter et al., 2016) lists 238 breeds (regional or native breeds) of goats of which 71 (30%) were classified as dairy breeds, 55 (23%) were allocated as meat breeds, 105 (44%) were assigned to dual-purpose breeds, and the remaining 7 (3%) were designated adequate for coat or cashmere production. Similarly, Porter et al. (2016) also registered 1,311 breeds of sheep of which 80 (6%) were classified as dairy breeds, 247 (19%) were allocated as meat breeds, 192 (15%) were ideal for dual-purposes, 223 (17%) were designated wool breeds, and the remaining 569 (43%) did not have a clear classification.
As shown in Figure 1, the majority of sheep breeds were classified as nondairy (76%) likely because the DAD-IS database lacked adequate MY information. Though this value is similar to the 21% of dairy and dual-purpose sheep breeds reported by Porter et al. (2016), our nondairy breeds do not necessarily represent meat and wool breeds. Figure 1 indicates that Karakul and Merino each accounted for up to 1.2% of sheep breeds raised around the world; the other breeds accounted for less than 1%, suggesting that transboundary sheep breeds are evenly distributed worldwide. In contrast, nondairy breeds of goats accounted for only 46.3% and of the remaining 53.7% (dairy and dual-purpose breeds), Saanen, Boer, Anglo-Nubian, Toggenburg, and Alpine accounted for 6.5, 5.0, 4.4, 4.0, and 3.0%, respectively, of the transboundary breeds. Porter et al. (2016), on the other hand, indicated that about 74% of goat breeds were classified either as dairy or dual-purpose breeds. Five sheep breeds and 6 goat breeds from Figure 1 were selected; the remaining selected breeds (Table 2 for sheep and Table 3 for goats) were based on Haenlein (2007).
Table 2.
Lactation length and milk yield and composition for selected breeds of sheep
| Breeds | n1 | Length, d | Total milk, kg | Milk yield, kg/d | Milk fat, % | Milk protein, % | Milk lactose, % | Milk total solid, % | Energy, Kcal/kg |
|---|---|---|---|---|---|---|---|---|---|
| Awassi | 43 | 120–3002 | 130–5502 | 1.11ab | 5.87a | 5.44a | 5.09a | 16.2a | 983 |
| Chios | 36 | 170–2502 | 135–3002 | 1.46ab | 6.40a | 5.55a | 4.81a | 15.7a | 1036 |
| Comisana | 23 | 1823 | 112b | 0.83b | 6.96a | 5.77a | 4.87a | – | 1094 |
| Dorset | 43 | – | 99b | 1.12ab | 8.41a | 5.16a | 4.85a | 19.4a | 1201 |
| East Friesian | 21 | 300–3652 | 500–9002 | 1.16ab | 5.95a | 5.22a | 4.75a | 16.9a | 983 |
| Fat Tailed | 11 | – | 161b | 0.84ab | 5.26a | 5.15a | 5.40a | 17.6a | 918 |
| Finn-Sheep | 5 | – | – | 1.36ab | 8.05a | 4.96a | 5.40a | 16.8a | 1161 |
| Karagouniki | 15 | 160–1752 | 147b | 0.96ab | 6.85a | 5.53a | 4.85a | 19.4a | 1075 |
| Lacaune | 28 | 160–1702 | 434a | 1.65a | 6.67a | 4.72a | 4.65a | – | 1028 |
| Manchega | 16 | 150–2702 | 80–2502 | 0.89ab | 7.05a | 5.81a | 4.86a | 17.5a | 1103 |
| Merino | 41 | – | – | 1.23ab | 8.21a | 5.59a | 5.37a | 19.7a | 1199 |
| Sarda | 27 | 1683 | 116b | 1.36ab | 6.11a | 5.22a | 4.79a | 17.9a | 997 |
| Tsigai | 31 | 1624 | – | 0.62b | 7.73a | 5.99a | 4.992 | 18.82 | 1171 |
a,bWithin a column, superscripts of different letters differ at P < 0.05.
1Number of animals.
2Adapted from Haenlein and Wendorff (2008). Ranges reflect the minimum and maximum across different countries.
3Adapted from Carta et al. (2009).
4Adapted from Selvaggi et al. (2016).
Table 3.
Lactation length and milk yield and composition for selected breeds of goats
| Breeds | n1 | Length, d | Total milk, kg | Milk yield, kg/d | Milk fat, % | Milk protein, % | Milk lactose, % | Milk totalsolid, % | Energy kcal/kg |
|---|---|---|---|---|---|---|---|---|---|
| Alpine | 68 | 248a | 601a | 2.66a | 3.33c | 3.10bc | 4.53ab | 11.05c | 679 |
| Anglo-Nubian | 18 | 270–3052 | 592ab | 0.90de | 3.71bc | 3.29bc | 4.23bc | 12.10bc | 716 |
| Boer | 8 | – | – | 1.72bcd | 5.88a | 4.02a | 4.95a | 14.73a | 907 |
| Canaria (Canary) | 47 | 251a | 183b | 0.79e | 3.96bc | 3.72ab | 4.66ab | 12.77bc | 754 |
| Damascus | 22 | 270a | 378ab | 1.88bc | 4.46b | 3.82ab | 3.60c | 12.94bc | 795 |
| La Mancha | 4 | 270–3052 | 720–8002 | 2.633 | 4.95ab | 3.34abc | – | 13.67ab | 807 |
| Malagueña | 20 | 240–2702 | 500–7002 | 1.47cd | 5.49a | 3.40ab | 4.53ab | 13.64abc | 848 |
| Maltese | 16 | 250a | 283b | 2.233 | 3.77bc | 3.14bc | 4.60ab | – | 713 |
| Murciana-Granadina | 20 | 231a | 368ab | 1.70cd | 4.59b | 3.48ab | 4.84a | 13.01bc | 788 |
| Nordic | 32 | 250–3002 | 600–7002 | 1.92bc | 4.28b | 2.87c | 4.29abc | 11.25c | 736 |
| Saanen | 62 | 250a | 615a | 2.55ab | 3.28c | 2.94bc | 4.28bc | 11.52c | 667 |
| Charmoisée | 2 | 265–2902 | 645a | 2.553 | 3.40bc | 2.84bc | – | – | 671 |
| Toggenburg | 10 | 245a | 424b | 1.82bcd | 3.37bc | 2.96bc | 4.26bc | 13.14abc | 675 |
a–eWithin a column, superscripts of different letters differ at P < 0.05.
1Number of animals.
2Adapted from Haenlein (2008). Ranges reflect the minimum and maximum across different countries.
3Calculated from Haenlein (2007) as the reported total milk yield divided by the reported lactation length.
Analysis of the Literature Data
Park et al. (2007) suggested that the composition and physicochemical characteristics of sheep and goats milk are essential for successful development of dairy industries as well as for the marketing of their products (e.g., fluid milk, cheese). There are distinct differences in the physicochemical characteristics of milk from goats, sheep and cows. Barłowska et al. (2011) performed a meta-analysis of milk composition of 5 species (n = 30 studies/species), and provided descriptive statistics for milk CP, fat, and lactose, as follows: cattle (3.42% CP, 4.09% fat, and 4.82% lactose), water buffalo (4.38% CP, 7.73% fat, and 4.79% lactose), sheep (5.73% CP, 6.99% fat, and 4.75% lactose), goat (3.26% CP, 4.07% fat, and 4.51% lactose), and camel (3.26% CP, 3.8% fat, and 4.3% lactose). These authors also indicated that sheep's milk had the greatest energy content (1,417 kcal/kg), followed by cattle (891 kcal/kg), water buffalo (825 kcal/kg), and goat (721 kcal/kg). Major differences in the AA profile of the milk protein, the FA of the milk fat, and the minerals and vitamins exist (Barłowska et al., 2011; Haenlein and Anke, 2010). Furthermore, the composition of cow's milk is expected to have minimal changes throughout the year, whereas changes in the composition of sheep and goats milk occur naturally by seasons because toward the end of the lactation, the contents of milk fat, protein, solids, and minerals increase while milk lactose content decreases.
The variation in MY and milk composition among different breeds of sheep and goats has been observed by several authors. Such factors include genetics (Clark and Sherbon, 2000; Greyling et al., 2004; Koutsouli et al., 2017; Lôbo et al., 2017; Montaldo et al., 2010; Salvador et al., 2016); nutrition (Baldin et al., 2014; Bernard et al., 2009; Bernard et al., 2012; Carnicella et al., 2008; Catunda et al., 2016); parity and number of lambs born (Ahuya et al., 2009; Carnicella et al., 2008; Salvador et al., 2016); days after parturition (Koutsouli et al., 2017); milking frequency (Koutsouli et al., 2017; Kremer and Rosés, 2016; Torres et al., 2014); environmental conditions (Arias et al., 2012; Peana et al., 2017); and other physiological status (Caroprese et al., 2010).
There is a tremendous genetic diversity within breeds of sheep and goats, but few publications have documented their production aptitude and expected productivity. While genetic differentiation of breeds has been conducted for many Asian countries (Periasamy et al., 2017), basic production characterization is rare or incomplete for the most important breeds of sheep and goats that are used in different regions of the world. In agreement, Raynal-Ljutovac et al. (2008) indicated that milk composition varies according to animal breed, feed and feeding conditions, and environment. They reported the average composition of total solids of sheep milk varies between 14.4 to 20.7% with mean of 18.1%, milk fat content varies from 3.60 to 9.97% with mean of 6.82%, milk protein content varies from 4.75 to 7.20% with mean of 5.59%, and milk lactose varies from 4.11 to 5.51% with mean 4.88%.
Sheep Breeds
Table 2 has the average of lactation length, total milk yield, MY, milk composition, and milk energy of selected breeds of sheep. The average and SD across breeds were 1.1 ± 0.3 kg/d for MY, 6.9 ± 1% for milk fat, 5.4 ± 0.4% for milk protein, 5 ± 0.3% for milk lactose, 17.7 ± 1.4% for milk total solids, and 1,073 ± 91 kcal/kg of milk energy. Lacaune had the greatest MY compared to Comisana and Tsigai (1.65 versus 0.83 and 0.62 kg/d; respectively, P < 0.05), but milk components were not different among breeds. Dorset had the greatest milk energy content (1,201 kcal/kg) and Fat Tailed had the least one (918 kcal/kg). There was a moderate correlation of milk fat (r = 0.55) but low correlations of milk protein (r = 0.24) and milk lactose (r = 0.17) with the values reported by Haenlein and Wendorff (2008). Studies had incomplete data, leading to some breeds with missing values; thus, the missing values were populated with those reported by Haenlein and Wendorff (2008).
Nudda et al. (2002) evaluated 3 breeds and reported differences in MY: the Sarda breed had greater MY (0.58 kg/d) than Awassi (0.36 kg/d) and Merino (0.16 kg/d), and their MY is less than the MY presented in Table 2 for the same breeds: the average MY for Sarda ewes was 1.36 kg/d followed by Awassi (1.11 kg/d) and Merino (1.23 kg/d). However, in agreement with Table 2, their Sarda ewes had lower milk fat (6.56%) and protein (5.75%) contents compared to their Merino ewes (7.99 and 5.99%, respectively). In contrast, Tsiplakou et al. (2006) compared 4 sheep breeds (Awassi, Lacaune, Friesland, and Chios) and indicated that the average daily MY, milk composition (protein, lactose) and yield of protein and fat were not different among them (1.6 kg/d; 5.72 and 4.92%; and 90.5 and 119 g/d, respectively). Nonetheless, the milk fat content was greater for Awassi ewes and the total solids content was less for Chios ewes when compared to the other breeds. Selvaggi et al. (2016) studied three sheep breeds (Comisana, Leccese, and Sarda) and reported differences in MY and lactation length in which Leccese ewes produced less total MY per lactation (84.9 kg) compared to Comisana (112 kg) and Sarda (116 kg), and had shorter duration of lactation (156 d) versus Comisana (182 d) and Sarda (178 d), but Leccese ewes had greater milk fat (7.75%), protein (5.13%), and lactose (5.06%) contents than Comisana and Sarda (7.27%, 4.96%, and 4.89%, respectively).
Nowadays, dairy sheep farming systems vary from extensive (marked seasonal milk production, dual-purpose breeds, low feed supplementation, hand milking, absence of farm facilities, farm-made cheese) to intensive (seasonal or continuous milk production, improved local breeds or crosses, exploitation of forage crops, high feed supplementation, milking machine and housing facilities, industrial cheese) according to economic relevance of the production chain and the specific environmental and breed (Carta et al., 2009). In agreement, dairy sheep management varies greatly with breed, production system and country, where the most important dairy sheep in the European Mediterranean countries produce 65% of the total European sheep milk and raise most dairy sheep under extensive and semi-extensive systems (Sitzia et al., 2015).
Carta et al. (2009) indicated that another factor of variation between sheep breeds are breeding strategy to improve dairy traits that may involve either crossbreeding or purebreeding selection programs. Several comparisons between local and exotic breeds were made to determine whether local dairy breeds could be used successfully under the improved conditions or whether it would have been better to replace them with more productive genotypes.
Goat Breeds
Table 3 has the average of lactation length, total milk yield, MY, milk composition, and milk energy of selected breeds of goats. The average and SD across breeds were 1.7 ± 0.6 kg/d for MY, 4.2 ± 0.9% for milk fat, 3.3 ± 0.4% for milk protein, 4.4 ± 0.4% for milk lactose, 12.7 ± 1.1% for milk total solids, and 750 ± 75 kcal/kg of milk energy. Alpine had similar MY to Saanen (2.66 versus 2.55 kg/d, respectively; P > 0.05), but greater than the other breeds (P < 0.05). The Boer breed had the greatest milk fat, protein, lactose, and total solids than several other breeds, leading to the greatest milk energy content (907 kcal/kg). There was a moderate correlation of MY (r = 0.42) and milk fat (r = 0.66) with the values reported by Haenlein (2007). Studies had incomplete data, leading to some breeds with missing values; thus, the missing values were populated with those reported by Haenlein (2007) or Haenlein (2008).
Mestawet et al. (2012) reported differences between breeds of goats: Boer breed produced the highest average MY (1.41 kg/d) followed by Arsi-Bale (1.13 kg/d) and Toggenburg × Somali and Arsi-Bale × Somali crossbreds (0.89 kg/d). Their reported MY for Boer is identical to that reported in Table 2 (1.72 kg/d). Similarly, Lôbo et al. (2017) compared breeds of Alpine, Saanen, and Toggenburg raised in the Southeast of Brazil with breeds of Anglo-Nubian and Saanen raised in the Northeast of Brazil. They reported that genetics and environmental conditions (i.e., geolocations) could alter MY, lactation length, and milk composition. Thus, the values reported in Table 3 must be used with caution and adjustments when raising goats outside of the conditions used in the literature dataset studies might be necessary.
In respect to the values reported in Table 3, Soryal et al. (2005) observed higher values of milk fat (4.37%), total protein, (3.87%) and total solids (13.5%) contents for Nubian breed, and lower values of milk fat (2.7%), total protein (2.53%), and total solids (10.1%) contents for Alpine breed. Mestawet et al. (2012) also found differences between Boer, Arsi-Bale purebred and crossbreds, and Toggenburg crossbreds in which Boer had the greatest fat (4.92%) and total solids (15.9%) contents. A greater variation in milk composition was also reported by Lôbo et al. (2017) in which the Anglo-Nubian breed presented greater fat (4.25%), protein (3.4%), and total solids (12.5%) contents, followed by Saanen raised in Southeastern of Brazil and Alpine breeds with an average of 3.7% for fat, 2.95% for protein, and 11.8% for total solids contents. In their comparison, Saanen raised in the Northeastern of Brazil and Toggenburg had the least milk components: 3.3% for fat, 2.73% for protein, and 11.2% for total solids contents. Contrary to these findings, Mayer and Fiechter (2012) compared 6 goat dairy breeds (Colored, Pinzgau, Saanen, Strahlen, Toggenburg, and White) and reported similar chemical composition (3.67% for fat, 3.35% for protein, 12.2% for total solids, and 4.23% for lactose contents). Their results are in contrast to those listed in Table 3 in which Saanen breed had less fat, protein, and total solids contents than Toggenburg.
Table 2 and Table 3 provided average MY and milk composition for relevant breeds of sheep and goats, respectively. However, as indicated above, these values are will certainly vary depending on the plane of nutrition, animal management, and environmental conditions. Ideal environmental conditions may vary across different breeds, but as a rule of thumb, temperature humidity index (Tedeschi and Fox (2016)) below 68, wind speed below 4 m/s, and solar radiation below 24 MJ/m2 are usually ideal for dairy sheep in the Mediterranean region (Peana et al., 2017).
In conclusion, we identified 16 breeds of sheep and 16 breeds of goats that met our criterion of relevant breeds, e.g., those breeds that occur more than 3 times across countries. However, some breeds did not have enough published lactation data (e.g., milk yield and composition) that we could include in our analyses. Based on our literature search, we developed a table containing lactation information for 13 breeds of sheep and 13 breeds of goats, but because there are many factors that can alter MY and milk composition (e.g., stage of lactation, environment, and management), these averages should be used as guidelines by nutritionists when formulating and balancing diets with nutrition models.
Supplementary Material
LITERATURE CITED
- Ahuya C. O., Ojango J. M. K., Mosi R. O., Peacock C. P., Okeyo A. M. 2009. Performance of Toggenburg dairy goats in smallholder production systems of the eastern highlands of Kenya. Small Rumin. Res. 83:7–13. doi: 10.1016/j.smallrumres.2008.11.012 [DOI] [Google Scholar]
- Arias R., Oliete B., Ramón M., Arias C., Gallego R., Montoro V., Gonzalo C., Pérez-Guzmán M. D. 2012. Long-term study of environmental effects on test-day somatic cell count and milk yield in Manchega sheep. Small Rumin. Res. 106:92–97. doi: 10.1016/j.smallrumres.2012.03.019 [DOI] [Google Scholar]
- Baldin M., Dresch R., Souza J., Fernandes D., Gama M. S., Harvatine K. J., Oliveira D. E. 2014. CLA induced milk fat depression reduced dry matter intake and improved energy balance in dairy goats. Small Rumin. Res. 116:44–50. doi: 10.1016/j.smallrumres.2013.10.001 [DOI] [Google Scholar]
- Barłowska J., Szwajkowska M., Litwińczuk Z., Król J. 2011. Nutritional value and technological suitability of milk from various animal species used for dairy production. Compr. Rev. Food Sci. Food Saf. 10:291–302. doi: 10.1111/j.1541-4337.2011.00163.x [DOI] [Google Scholar]
- Bernard L., Leroux C., Faulconnier Y., Durand D., Shingfield K. J., Chilliard Y. 2009. Effect of sunflower-seed oil or linseed oil on milk fatty acid secretion and lipogenic gene expression in goats fed hay-based diets. J. Dairy Res. 76:241–248. doi: 10.1017/S0022029909003951 [DOI] [PubMed] [Google Scholar]
- Bernard L., Leroux C., Rouel J., Bonnet M., Chilliard Y. 2012. Effect of the level and type of starchy concentrate on tissue lipid metabolism, gene expression and milk fatty acid secretion in Alpine goats receiving a diet rich in sunflower-seed oil. Br. J. Nutr. 107:1147–1159. doi: 10.1017/S0007114511004181 [DOI] [PubMed] [Google Scholar]
- Bittante G. 2011. Italian animal genetic resources in the Domestic Animal Diversity Information System of FAO. Ital. J. Anim. Sci. 10:e29. doi: 10.4081/ijas.2011.e29 [DOI] [Google Scholar]
- Cannas A., Tedeschi L. O., Fox D. G., Pell A. N., Van Soest P. J. 2004. A mechanistic model for predicting the nutrient requirements and feed biological values for sheep. J. Anim. Sci. 82:149–169. doi: 10.2527/2004.821149x [DOI] [PubMed] [Google Scholar]
- Carnicella D., Dario M., Ayres M. C. C., Laudadio V., Dario C. 2008. The effect of diet, parity, year and number of kids on milk yield and milk composition in Maltese goat. Small Rumin. Res. 77:71–74. doi: 10.1016/j.smallrumres.2008.02.006 [DOI] [Google Scholar]
- Caroprese M., Albenzio M., Marzano A., Schena L., Annicchiarico G., Sevi A. 2010. Relationship between cortisol response to stress and behavior, immune profile, and production performance of dairy ewes. J. Dairy Sci. 93:2395–2403. doi: 10.3168/jds.2009-2604 [DOI] [PubMed] [Google Scholar]
- Carta A., Casu S., Salaris S. 2009. Invited review: Current state of genetic improvement in dairy sheep. J. Dairy Sci. 92:5814–5833. doi: 10.3168/jds.2009-2479 [DOI] [PubMed] [Google Scholar]
- Catunda K. L., De Aguiar E. M., De Goes Neto P. E., Da Silva J. G., Moreira J. A., Do Nascimento Rangel A. H., De Lima D. M., Junior 2016. Gross composition, fatty acid profile and sensory characteristics of Saanen goat milk fed with Cacti varieties. Trop. Anim. Health Prod. 48:1253–1259. doi: 10.1007/s11250-016-1085-7 [DOI] [PubMed] [Google Scholar]
- Clark S., Sherbon J. W. 2000. Alphas1-casein, milk composition and coagulation properties of goat milk. Small Rumin. Res. 38:123–134. doi: 10.1016/S0921-4488(00)00154-1 [DOI] [Google Scholar]
- Food and Agriculture Organization (FAO) 2001. Preparation of the First Report on the State of the World's Animal Genetic Resources; Guidelines for the Development of Country Reports. In: Galal S., Boyazoglu J. editors, Food and Agriculture Organization of the United Nations, Rome, Italy; Ftp://ftp.fao.org/docrep/fao/004/y1100m/y1100m00.pdf. (Accessed 21 May 2017.) [Google Scholar]
- Food and Agriculture Organization 2017. FAOSTAT Statistics Database. Http://www.fao.org/faostat/en/#data. (Accessed 15 August 2017.)
- Gerber P. J., Hristov A. N., Henderson B., Makkar H., Oh J., Lee C., Meinen R., Montes F., Ott T., Firkins J., Rotz A., Dell C., Adesogan A. T., Yang W. Z., Tricarico J. M., Kebreab E., Waghorn G., Dijkstra J., Oosting S. 2013. Technical options for the mitigation of direct methane and nitrous oxide emissions from livestock: A review. Animal 7:220–234. doi: 10.1017/S1751731113000876 [DOI] [PubMed] [Google Scholar]
- Greyling J. P. C., Mmbengwa V. M., Schwalbach L. M. J., Muller T. 2004. Comparative milk production potential of Indigenous and Boer goats under two feeding systems in South Africa. Small Rumin. Res. 55:97–105. doi: 10.1016/j.smallrumres.2003.11.014 [DOI] [Google Scholar]
- Haenlein G. F. W. 2007. About the evolution of goat and sheep milk production. Small Rumin. Res. 68:3–6. doi: 10.1016/j.smallrumres.2006.09.021 [DOI] [Google Scholar]
- Haenlein G. F. W. 2008. Goat milk. In: Park Y. W., Haenlein G. F. W. editors, Handbook of Milk of Non-Bovine Mammals. Blackwell Publishing Professional, Ames, Iowa; p. 11–33. [Google Scholar]
- Haenlein G. F. W., Anke M. 2010. Mineral and trace element research in goats: A review. Small Rumin. Res. 95:2–19. doi: 10.1016/j.smallrumres.2010.11.007 [DOI] [Google Scholar]
- Haenlein G. F. W., Wendorff W. L. 2008. Sheep milk. In: Park Y. W., Haenlein G. F. W. editors, Handbook of Milk of Non-Bovine Mammals. Blackwell Publishing Professional, Ames, Iowa; p. 137–194. [Google Scholar]
- Koutsouli P., Simitzis P., Theodorou G., Massouras T., Bizelis I., Politis I. 2017. The effect of milking frequency reduction from twice to once daily on mammary physiology and animal welfare of two dairy Greek sheep breeds. Small Rumin. Res. 147:18–24. doi: 10.1016/j.smallrumres.2016.12.005 [DOI] [Google Scholar]
- Kremer R., Rosés L. 2016. Producción y composición de leche de ovejas Frisona-Milchschaf ordeñadas 1 o 2 veces diarias. Veterinaria. (Montevideo). 204:22–28. [Google Scholar]
- Lôbo A. M. B. O., Lôbo R. N. B., Facó O., Souza V, Alves A. C., Costa A. C., Albuquerque M. M. 2017. Characterization of milk production and composition of four exotic goat breeds in Brazil. Small Rumin. Res. 153:9–16. doi: 10.1016/j.smallrumres.2017.05.005 [DOI] [Google Scholar]
- Mayer H. K., Fiechter G. 2012. Physicochemical characteristics of goat's milk in Austria-seasonal variations and differences between six breeds. Dairy Sci. Technol. 92:167–177. doi: 10.1007/s13594-011-0047-0 [DOI] [Google Scholar]
- Mestawet T. A., Girma A., Ådnøy T., Devold T. G., Narvhus J. A., Vegarud G. E. 2012. Milk production, composition and variation at different lactation stages of four goat breeds in Ethiopia. Small Rumin. Res. 105:176–181. doi: 10.1016/j.smallrumres.2011.11.014 [DOI] [Google Scholar]
- Montaldo H. H., Torres-Hernández G., Valencia-Posadas M. 2010. Goat breeding research in Mexico. Small Rumin. Res. 89:155–163. doi: 10.1016/j.smallrumres.2009.12.039 [DOI] [Google Scholar]
- National Academies of Sciences, Engineering, and Medicine 2016. Nutrient Requirements of Beef Cattle. (8th ed.). Nutrient requirements of domestic animals. National Academy Press, Washington, DC. [Google Scholar]
- National Research Council (NRC) 1996. Nutrient Requirements of Beef Cattle. (7th ed.). Nutrient requirements of domestic animals. National Academy Press, Washington, DC. [Google Scholar]
- National Research Council (NRC) 2000. Nutrient Requirements of Beef Cattle. (updated 7th ed.). Nutrient requirements of domestic animals. National Academy Press, Washington, DC. [Google Scholar]
- National Research Council (NRC) 2007. Nutrient Requirements of Small Ruminants: Sheep, Goats, Cervids, and New World Camelids. (6th ed.). Nutrient requirements of small ruminants. National Academy Press, Washington, DC. [Google Scholar]
- Nudda A., Bencini R., Mijatovic S., Pulina G. 2002. The yield and composition of milk in Sarda, Awassi, and Merino sheep milked unilaterally at different frequencies. J. Dairy Sci. 85:2879–2884. doi: 10.3168/jds.S0022-0302(02)74375-0 [DOI] [PubMed] [Google Scholar]
- Opio C., Gerber P., Mottet A., Falcucci A., Tempio G., Macleod M., Vellinga T., Henderson B. 2013. Greenhouse Gas Emissions from Ruminant Supply Chains; A global life cycle assessment. Food and Agriculture Organization of the United Nations (FAO), Rome, Italy; 191 p. Available at: Http://www.fao.org/docrep/018/i3461e/i3461e.pdf. (Accessed 27 May 2017.) [Google Scholar]
- Park Y. W., Juarez M., Ramos M., Haenlein G. F. W. 2007. Physico-chemical characteristics of goat and sheep milk. Small Rumin. Res. 68:88–113. doi: 10.1016/j.smallrumres.2006.09.013 [DOI] [Google Scholar]
- Peana I., Francesconi A. H. D., Dimauro C., Cannas A., Sitzia M. 2017. Effect of winter and spring meteorological conditions on milk production of grazing dairy sheep in the Mediterranean environment. Small Rumin. Res. 153:194–208. doi: 10.1016/j.smallrumres.2017.06.016 [DOI] [Google Scholar]
- Periasamy K., Vahidi S. M. F., Silva P., Faruque M. O., Naqvi A. N., Basar M., Cao J., Zhao S., Thuy L. T., Pichler R., Podesta M. G., Shamsuddin M., Boettcher P., Garcia J. F., Han J.-L., Marsan P. A., Diallo A., Viljoen G. J. 2017. Mapping molecular diversity of indigenous goat genetic resources of Asia. Small Rumin. Res. 148:2–10. doi: 10.1016/j.smallrumres.2016.12.035 [DOI] [Google Scholar]
- Porter V., Alderson L., Hall S. J. G., Sponenberg D. P. 2016. Mason's World Encyclopedia of Livestock Breeds and Breeding (volume 1 and 2). CABI Publishing, Wallingford, UK. [Google Scholar]
- Pulina G., Cannas A., Serra A., Vallebella R. 1992. Determinazione e stima del valore energetico di latte di capre di razza Sarda. Atti della Società Italiana di Scienze Veterinarie. 45:1779–1781. [Google Scholar]
- Raynal-Ljutovac K., Lagriffoul G., Paccard P., Guillet I., Chilliard Y. 2008. Composition of goat and sheep milk products: An update. Small Rumin. Res. 79:57–72. doi: 10.1016/j.smallrumres.2008.07.009 [DOI] [Google Scholar]
- Rezaei R., Wu Z., Hou Y., Bazer F. W., Wu G. 2016. Amino acids and mammary gland development: Nutritional implications for milk production and neonatal growth. J. Anim. Sci. Biotechnol. 7:20. doi: 10.1186/s40104-016-0078-8 [DOI] [PMC free article] [PubMed] [Google Scholar]
- Salvador A., Martínez G., Alvarado C., Hahn M., Pariacote F., Vazquez-Armijo J.F. 2016. Características Físico Químicas y Composición de la Leche de Cabras Mestizas Canarias en Condiciones Tropicales. Revista de la Facultad de Ciencias Veterinarias. 57:53–60. [Google Scholar]
- Selvaggi M., D'alessandro A. G., Dario C. 2016. Environmental and genetic factors affecting milk yield and quality in three Italian sheep breeds. J. Dairy Res. 84:1–5. [DOI] [PubMed] [Google Scholar]
- Sitzia M., Bonanno A., Todaro M., Cannas A., Atzori A. S., Francesconi A. H. D., Trabalza-Marinucci M. 2015. Feeding and management techniques to favour summer sheep milk and cheese production in the Mediterranean environment. Small Rumin. Res. 126:43–58. doi: 10.1016/j.smallrumres.2015.01.021 [DOI] [Google Scholar]
- Soryal K., Beyene F. A., Zeng S., Bah B., Tesfai K. 2005. Effect of goat breed and milk composition on yield, sensory quality, fatty acid concentration of soft cheese during lactation. Small Rumin. Res. 58:275–281. doi: 10.1016/j.smallrumres.2004.11.003 [DOI] [Google Scholar]
- Tedeschi L. O., Cannas A., Fox D. G. 2010. A nutrition mathematical model to account for dietary supply and requirements of energy and nutrients for domesticated small ruminants: The development and evaluation of the Small Ruminant Nutrition System. Small Rumin. Res. 89:174–184. doi: 10.1016/j.smallrumres.2009.12.041 [DOI] [Google Scholar]
- Tedeschi L. O., Fox D. G. 2016. The Ruminant Nutrition System: An Applied Model for Predicting Nutrient Requirements and Feed Utilization in Ruminants. XanEdu, Acton, MA. [Google Scholar]
- Torres A., Hernandez-Castellano L. E., Morales-Delanuez A., Sanchez-Macias D., Moreno-Indias I., Castro N., Capote J., Arguello A. 2014. Short-term effects of milking frequency on milk yield, milk composition, somatic cell count and milk protein profile in dairy goats. J. Dairy Res. 81:275–279. [DOI] [PubMed] [Google Scholar]
- Tsiplakou E., Mountzouris K. C., Zervas G. 2006. The effect of breed, stage of lactation and parity on sheep milk fat CLA content under the same feeding practices. Livest. Sci. 105:162–167. doi: 10.1016/j.livsci.2006.06.002 [DOI] [Google Scholar]
Associated Data
This section collects any data citations, data availability statements, or supplementary materials included in this article.