

Abstract
Background
Stigma is the deleterious, structural force that devalues members of groups that hold undesirable characteristics. Since stigma is created and reinforced by society—through in-person and online social interactions—referencing the novel coronavirus as the “Chinese virus” or “China virus” has the potential to create and perpetuate stigma.
Objective
The aim of this study was to assess if there was an increase in the prevalence and frequency of the phrases “Chinese virus” and “China virus” on Twitter after the March 16, 2020, US presidential reference of this term.
Methods
Using the Sysomos software (Sysomos, Inc), we extracted tweets from the United States using a list of keywords that were derivatives of “Chinese virus.” We compared tweets at the national and state levels posted between March 9 and March 15 (preperiod) with those posted between March 19 and March 25 (postperiod). We used Stata 16 (StataCorp) for quantitative analysis, and Python (Python Software Foundation) to plot a state-level heat map.
Results
A total of 16,535 “Chinese virus” or “China virus” tweets were identified in the preperiod, and 177,327 tweets were identified in the postperiod, illustrating a nearly ten-fold increase at the national level. All 50 states witnessed an increase in the number of tweets exclusively mentioning “Chinese virus” or “China virus” instead of coronavirus disease (COVID-19) or coronavirus. On average, 0.38 tweets referencing “Chinese virus” or “China virus” were posted per 10,000 people at the state level in the preperiod, and 4.08 of these stigmatizing tweets were posted in the postperiod, also indicating a ten-fold increase. The 5 states with the highest number of postperiod “Chinese virus” tweets were Pennsylvania (n=5249), New York (n=11,754), Florida (n=13,070), Texas (n=14,861), and California (n=19,442). Adjusting for population size, the 5 states with the highest prevalence of postperiod “Chinese virus” tweets were Arizona (5.85), New York (6.04), Florida (6.09), Nevada (7.72), and Wyoming (8.76). The 5 states with the largest increase in pre- to postperiod “Chinese virus” tweets were Kansas (n=697/58, 1202%), South Dakota (n=185/15, 1233%), Mississippi (n=749/54, 1387%), New Hampshire (n=582/41, 1420%), and Idaho (n=670/46, 1457%).
Conclusions
The rise in tweets referencing “Chinese virus” or “China virus,” along with the content of these tweets, indicate that knowledge translation may be occurring online and COVID-19 stigma is likely being perpetuated on Twitter.
Keywords: COVID-19, coronavirus, Twitter, stigma, social media, public health
Introduction
Stigma is the deleterious, structural force that devalues those who hold undesirable characteristics [1]. Stigma is a social process that occurs between groups; this process can occur in-person and online [2-6]. Regardless of setting, research has consistently found that stigma is associated with negative health outcomes [2,4,6-9]. For example, HIV-related stigma has pushed the HIV-epidemic underground, fueling ongoing transmission [10], and other disease-related stigmas are associated with negative health outcomes ranging from missed clinical visits to suicidal ideation [1,6,9]. There is evidence to show that stigma can become internalized, and internalized stigma can lead to distrust of health professionals, skepticism of public health systems, and an unwillingness to disclose behaviors related to transmission [2,8,9]. Because the coronavirus disease (COVID-19) is infectious, contact tracing is critically important to assessing community spread; thus, it is imperative that individuals trust their public health and health care systems so that they are willing to accept testing and, if diagnosed with COVD-19, report their whereabouts and activities. Therefore, creating and perpetuating stigma related to COVID-19 could be detrimental to public health efforts that require potentially stigmatized individuals to engage with their health systems.
On March 16, 2020, the president of the United States referred to the novel coronavirus as the “Chinese virus” on Twitter. He tweeted “The United States will be powerfully supporting those industries... that are particularly affected by the Chinese Virus...” After this presidential reference, a dialogue emerged examining if the phrase “Chinese virus” was xenophobic and stigmatizing, considering the availability of alternative scientific names such as coronavirus or COVID-19. Since stigma is created and perpetuated by society through social interaction and public commentary (eg, use of the term “Chinese virus” instead of scientific terms on Twitter), and stigma is reinforced by those in power (eg, use of the term “Chinese virus” by the US president), we hypothesized that there would be an increase in the frequency of the phrases “Chinese virus” and “China virus” on Twitter, comparing the prevalence of these phrases before and after the presidential reference.
Methods
Twitter is an online social media platform where users send and receive short posts (maximum 280 characters) called tweets. Twitter currently has 152 million daily users, who produce about 500 million daily tweets [11].
Data, Tweets
We downloaded tweets from all 50 US states, using the Sysomos software (Sysomos, Inc). We extracted tweets that mentioned “Chinese virus” or “China virus” but did not contain “COVID-19” or “coronavirus.” The list of keywords referencing the “Chinese virus” are “Chinesevirus,” “Chinese virus,” “Chinavirus,” “China virus,” “#ChineseVirus19,” “#Chinesevirus,” “#ChineseVirusCorona,” and “#Chinavirus.” We excluded tweets containing the keywords “coronavirus,” “corona virus,” “COVID-19,” “COVID19,” “#COVID2019,” and “#corona.” By excluding tweets that contained both “Chinese virus” and “coronavirus,” we collated a sample of tweets that represented the intent of using “Chinese virus” in place of a scientific alternative, likely indicating deliberate stigmatization. We imputed the location of tweets based on Twitter users’ self-reported state of residence. Tweets posted between March 9 and March 15, 2020 (preperiod), were compared with tweets posted between March 19 and March 25, 2020 (postperiod). Original tweets and quote tweets (adding comments to an existing tweet) were included but not retweets (reposting of an existing tweet). Our final sample (N=193,862) contained all tweets posted in the pre- and postperiods by US-based Twitter users that exclusively mentioned a derivative of “Chinese virus.” Data extraction was conducted on April 10, 2020. Ethical approval was provided by the University of Alabama at Birmingham Institutional Review Board (IRB-#300005071).
Analysis
We used Stata 16 (StataCorp) to analyze our Twitter data and Python software (Python Software Foundation) to plot our state-level gradient heat map.
Results
A total of 16,535 “Chinese virus” or “China virus” tweets were identified in the preperiod, and 177,327 tweets were identified in the postperiod, illustrating a 972.43% (n=160,792/16,535) increase. Comparatively, the number of tweets referencing COVID-19 in the preperiod and postperiod remained steady, at about 4.9 million tweets per period. A total of 13,569 (82.06%) of the preperiod and 145,521 (82.06%) of the postperiod tweets were associated with a Twitter user’s self-reported US state. Figure 1 is a heat map illustrating the state-by-state increases of tweets referencing “Chinese virus” or “China virus.” The darker the shade, the greater the increase. All 50 US states witnessed an increase in the number of tweets exclusively mentioning “Chinese virus” or “China virus” rather than COVID-19 or coronavirus. The 5 US states with the highest number of postperiod “Chinese virus” tweets were Pennsylvania, New York, Florida, Texas, and California. The 5 US states with the largest increase in pre- to postperiod “Chinese virus” tweets were Kansas, South Dakota, Mississippi, New Hampshire, and Idaho.
Figure 1.
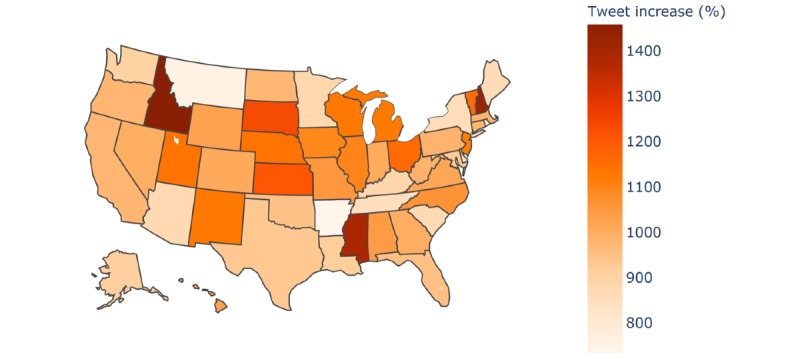
Heat map of increases in tweets referencing “Chinese virus” or “China virus” across the United States.
In Table 1, we present US state-level results of tweets referencing “Chinese virus” or “China virus.” On average, at the state level, 271 such tweets were found in the preperiod and 2910 in the postperiod, indicating a ten-fold increase, similar to what we found at the national level. We also calculated the percentage increase and the prevalence increase. The percentage increase measures the percentage of all COVID-19 related tweets that mentioned “China virus” or “Chinese virus” exclusively. To account for variations in population size, prevalence of “Chinese virus” tweets per 10,000 people for each US state was calculated using the following formula: 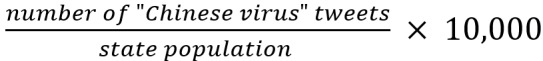 . State population sizes were taken from the 2019 US Census Bureau estimates [12]. On average, the state-level percentage increase was 997%, with a minimum of 661% and a maximum of 1447%. Similarly, the prevalence increase mean was 1015%, with a minimum of 734% and a maximum of 1456%. Large variations were found across US states, with the lowest postperiod prevalence of “Chinese virus” or “China virus” in South Dakota and the highest in Wyoming. The 5 US states with the highest prevalence of “Chinese virus” or “China virus” postperiod tweets were Arizona, New York, Florida, Nevada, and Wyoming.
Table 1.
Tweets referencing the novel coronavirus as “Chinese virus” or “China virus” by state.
| States | Preperiod | Postperiod | Change from pre- to postperiod | |||||||||
|
|
COVID-19 tweets, n | “Chinese virus” tweets, n | Percentage of tweetsa, (%) | Prevalence of tweetsb | COVID-19 tweets, n | “Chinese virus” tweets, n | Percentage of tweetsa, (%) | Prevalence of tweetsb | Percentage increasec (%) | Prevalence increased (%) | ||
| AL | 40,588 | 153 | 0.38 | 0.31 | 39,434 | 1749 | 4.44 | 3.57 | 1077 | 1043 | ||
| AK | 9251 | 40 | 0.43 | 0.55 | 9597 | 404 | 4.21 | 5.52 | 874 | 910 | ||
| AZ | 83,019 | 438 | 0.53 | 0.60 | 89,127 | 4256 | 4.78 | 5.85 | 805 | 872 | ||
| AR | 21,810 | 109 | 0.50 | 0.36 | 22,741 | 910 | 4.00 | 3.02 | 701 | 735 | ||
| CA | 696,645 | 1806 | 0.26 | 0.46 | 685,596 | 19,442 | 2.84 | 4.92 | 994 | 977 | ||
| CO | 84,092 | 291 | 0.35 | 0.51 | 85,014 | 3218 | 3.79 | 5.59 | 994 | 1006 | ||
| CT | 40,304 | 116 | 0.29 | 0.33 | 40,531 | 1253 | 3.09 | 3.51 | 974 | 980 | ||
| DE | 9789 | 31 | 0.32 | 0.32 | 10,095 | 304 | 3.01 | 3.12 | 851 | 881 | ||
| FL | 270,723 | 1243 | 0.46 | 0.58 | 294,652 | 13,070 | 4.44 | 6.09 | 866 | 951 | ||
| GA | 135,543 | 382 | 0.28 | 0.36 | 136,875 | 4192 | 3.06 | 3.95 | 987 | 997 | ||
| HI | 15,261 | 53 | 0.35 | 0.37 | 18,237 | 597 | 3.27 | 4.22 | 843 | 1026 | ||
| ID | 13,810 | 46 | 0.33 | 0.26 | 14,683 | 716 | 4.88 | 4.01 | 1364 | 1457 | ||
| IL | 176,425 | 410 | 0.23 | 0.32 | 169,849 | 4918 | 2.90 | 3.88 | 1146 | 1100 | ||
| IN | 58,767 | 192 | 0.33 | 0.29 | 57,218 | 2118 | 3.70 | 3.15 | 1033 | 1003 | ||
| IA | 27,552 | 71 | 0.26 | 0.23 | 27,917 | 847 | 3.03 | 2.68 | 1077 | 1093 | ||
| KS | 24,678 | 58 | 0.24 | 0.20 | 24,694 | 755 | 0.31 | 2.59 | 1201 | 1202 | ||
| KY | 45,648 | 179 | 0.39 | 0.40 | 45,841 | 1765 | 3.85 | 3.95 | 882 | 886 | ||
| LA | 51,734 | 151 | 0.29 | 0.32 | 48,623 | 1535 | 3.16 | 3.30 | 982 | 917 | ||
| ME | 16,948 | 54 | 0.32 | 0.40 | 17,762 | 520 | 2.93 | 3.87 | 819 | 863 | ||
| MD | 75,527 | 189 | 0.25 | 0.31 | 76,274 | 1932 | 2.53 | 3.20 | 912 | 922 | ||
| MA | 138,665 | 295 | 0.21 | 0.43 | 137,279 | 3201 | 2.33 | 4.64 | 996 | 985 | ||
| MI | 108,514 | 297 | 0.27 | 0.30 | 103,934 | 3623 | 3.49 | 3.63 | 1174 | 1120 | ||
| MN | 63,304 | 192 | 0.30 | 0.34 | 65,570 | 1882 | 2.87 | 3.34 | 846 | 880 | ||
| MS | 19,530 | 54 | 0.28 | 0.18 | 18,771 | 803 | 4.28 | 2.70 | 1447 | 1387 | ||
| MO | 68,869 | 201 | 0.29 | 0.33 | 71,951 | 2317 | 3.22 | 3.78 | 1003 | 1053 | ||
| MT | 9365 | 61 | 0.65 | 0.57 | 10,503 | 521 | 4.96 | 4.87 | 662 | 754 | ||
| NE | 19,791 | 54 | 0.27 | 0.28 | 18,840 | 670 | 3.56 | 3.46 | 1203 | 1141 | ||
| NV | 52,996 | 217 | 0.41 | 0.70 | 53,730 | 2377 | 4.42 | 7.72 | 980 | 995 | ||
| NH | 14,260 | 41 | 0.29 | 0.30 | 15,096 | 623 | 4.13 | 4.58 | 1335 | 1420 | ||
| NJ | 96,806 | 315 | 0.33 | 0.35 | 100,334 | 3823 | 3.81 | 4.30 | 1071 | 1114 | ||
| NM | 18,966 | 51 | 0.27 | 0.24 | 20,220 | 627 | 3.10 | 2.99 | 1053 | 1129 | ||
| NY | 487,901 | 1225 | 0.25 | 0.63 | 484,515 | 11,754 | 2.43 | 6.04 | 866 | 860 | ||
| NC | 110,832 | 327 | 0.30 | 0.31 | 115,394 | 3795 | 3.29 | 3.62 | 1015 | 1061 | ||
| ND | 5649 | 18 | 0.32 | 0.24 | 6148 | 193 | 3.14 | 2.53 | 885 | 972 | ||
| OH | 145,371 | 366 | 0.25 | 0.31 | 127,421 | 4613 | 3.62 | 3.95 | 1338 | 1160 | ||
| OK | 33,480 | 137 | 0.41 | 0.35 | 33,857 | 1436 | 4.24 | 3.63 | 937 | 948 | ||
| OR | 64,817 | 185 | 0.29 | 0.44 | 65,972 | 1985 | 3.01 | 4.71 | 954 | 973 | ||
| PA | 159,712 | 485 | 0.30 | 0.38 | 161,156 | 5249 | 3.26 | 4.10 | 973 | 982 | ||
| RI | 14,234 | 43 | 0.30 | 0.41 | 14,219 | 385 | 2.71 | 3.63 | 796 | 795 | ||
| SC | 43,104 | 222 | 0.52 | 0.43 | 46,251 | 2145 | 4.64 | 4.17 | 800 | 866 | ||
| SD | 6252 | 15 | 0.24 | 0.17 | 6573 | 200 | 3.04 | 2.26 | 1168 | 1233 | ||
| TN | 82,478 | 361 | 0.44 | 0.53 | 82,050 | 3431 | 4.18 | 5.02 | 855 | 850 | ||
| TX | 378,047 | 1442 | 0.38 | 0.50 | 369,006 | 14,861 | 4.03 | 5.13 | 956 | 931 | ||
| UT | 30,422 | 81 | 0.27 | 0.25 | 28,464 | 1004 | 3.53 | 3.13 | 1225 | 1140 | ||
| VT | 8625 | 18 | 0.21 | 0.29 | 9527 | 226 | 2.37 | 3.62 | 1037 | 1156 | ||
| VA | 97,602 | 301 | 0.31 | 0.35 | 104,176 | 3351 | 3.22 | 3.93 | 943 | 1013 | ||
| WA | 123,025 | 331 | 0.27 | 0.43 | 116,656 | 3316 | 2.84 | 4.35 | 957 | 902 | ||
| WV | 15,523 | 47 | 0.30 | 0.26 | 15,698 | 509 | 3.24 | 2.84 | 971 | 983 | ||
| WI | 51,670 | 130 | 0.25 | 0.22 | 52315 | 1593 | 3.05 | 2.74 | 1110 | 1125 | ||
| WY | 6185 | 45 | 0.73 | 0.78 | 6875 | 507 | 7.37 | 8.76 | 914 | 1027 | ||
| Mean | 87,482 | 271 | 0.33 | 0.38 | 87,545 | 2910 | 3.57 | 4.08 | 997 | 1015 | ||
aPercentage of all COVID-19 related tweets that mentioned “Chinese virus” or “China virus” exclusively.
bPrevalence of “Chinese virus” tweets per 10,000 people was calculated using the following formula: .
cPercentage of increase was calculated as:  .
.
dPrevalence increase was calculated as:  .
.
Discussion
Principal Result
We found notable increases in the use of the terms “Chinese virus” and “China virus” on Twitter at both the national and state levels by comparing these tweets (percentage and prevalence) both before and after the March 16, 2020, presidential reference. The following are examples of “Chinese virus” or “China virus” tweets:
Not parroting MSM's [main stream media’s] narrative. It's the #WuFlu #ChineseCoronaVirus #ChinaVirus”
“#ChinaVirus #ChinaLiesPeopleDie”
Limitations
The pandemic is currently underway, so Twitter data—both in quantity (quantitative) and content (qualitative)—are rapidly shifting. We were unable to screen for automatically generated tweets (bots) within this short report [13,14]. Geographic locations associated with Twitter accounts were self-reported; thus, it is possible that some Twitter users may have moved without updating their state location or may have reported a false state location.
Comparison With Prior Work
There is a growing body of academic literature that leverages Twitter data to assess trends in population health and public sentiment [15-17]. Chew and Eysenbach [18] conducted a seminal examination of knowledge translation using Twitter data during the H1N1 outbreak; they found the proportion of tweets using “H1N1” increased over time compared to the relative use of “swine flu,” suggesting that the media’s choice in terminology (shifting from using the term “swine flu” to “H1N1”) influenced public uptake. In addition, it is relevant that a recent publication by Logie and Turan [19] presented a narrative on how stigma can hurt the COVID-19 public health response. This short report was developed considering the findings from prior studies.
Future Research
Future research could evaluate and show that stigma mechanisms work online, validate if Twitter and social media data can be informative to epidemic surveillance and health communication, examine the extent that Twitter and social media data is reliable in informing public health efforts and social science research, and explore how Twitter users view COVID-19 and the COVID-19 public health response (eg, testing, linkage to care).
Additionally, although there is a growing body of research using tweets to examine aspects of the novel coronavirus [20-22], to our knowledge, no studies have included a comprehensive set of search terms, which may include phrases such as “ncov,” “covid,” “sars-cov,” and “rona,” in defining their samples. If data extraction is not comprehensive, we run the risk of missing emerging sentiments and terminology, such as referencing the novel coronavirus as the “China virus” or “Chinese virus,” and sociobehavioral outcomes related to these trends.
Conclusions
The rise in tweets citing “Chinese virus” or “China virus” instead of COVID-19 or the novel coronavirus after the presidential reference on Twitter, along with the content of these tweets, indicate that knowledge translation may be occurring online and COVID-19 stigma is likely being perpetuated on Twitter. Generally speaking, perpetuating COVID-19-related stigma by using the phrase “Chinese virus” could harm public health efforts related to addressing the pandemic, specifically inciting fear and increasing distrust of public health systems by Chinese and Asian Americans. If these stigmatizing terms persist as malicious synonyms for the novel coronavirus, reparative efforts may be required to restore trust by marginalized communities.
Acknowledgments
Research reported in this publication was supported by the University of Alabama at Birmingham School of Public Health Back of the Envelope (for RS) and the National Institute of Mental Health of the National Institutes of Health under Award Number 1K01MH116737 (for HB). The content is solely the responsibility of the authors and does not necessarily represent the official views of the National Institutes of Health.
Abbreviations
- COVID-19
coronavirus disease
Footnotes
Authors' Contributions: HB conceptualized this study, and RS conducted the data collection and analysis. Both authors contributed to manuscript development and writing.
Conflicts of Interest: None declared.
References
- 1.Goffman E. Stigma: Notes on the Management of Spoiled Identity. Upper Saddle River, NJ: Prentice Hall; 1963. [Google Scholar]
- 2.Budhwani H, De P. Perceived stigma in health care settings and the physical and mental health of people of color in the United States. Health Equity. 2019;3(1):73–80. doi: 10.1089/heq.2018.0079. http://europepmc.org/abstract/MED/30915422. [DOI] [PMC free article] [PubMed] [Google Scholar]
- 3.Ho CL, Pan W, Taylor LD. Stigma of HIV testing on online HIV forums: self-stigma and the unspoken. J Psychosoc Nurs Ment Health Serv. 2017 Dec 01;55(12):34–43. doi: 10.3928/02793695-20170905-01. [DOI] [PubMed] [Google Scholar]
- 4.Karamouzian M, Knight R, Davis WM, Gilbert M, Shoveller J. Stigma associated with sexually transmissible infection testing in an online testing environment: examining the perspectives of youth in Vancouver, Canada. Sex Health. 2018;15(1):46. doi: 10.1071/sh17089. [DOI] [PubMed] [Google Scholar]
- 5.Milin R, Kutcher S, Lewis SP, Walker S, Wei Y, Ferrill N, Armstrong MA. Impact of a mental health curriculum on knowledge and stigma among high school students: a randomized controlled trial. J Am Acad Child Adolesc Psychiatry. 2016 May;55(5):383–391.e1. doi: 10.1016/j.jaac.2016.02.018. [DOI] [PubMed] [Google Scholar]
- 6.Pachankis JE, Hatzenbuehler ML, Wang K, Burton CL, Crawford FW, Phelan JC, Link BG. The burden of stigma on health and well-being: a taxonomy of concealment, course, disruptiveness, aesthetics, origin, and peril across 93 stigmas. Pers Soc Psychol Bull. 2018 Apr;44(4):451–474. doi: 10.1177/0146167217741313. http://europepmc.org/abstract/MED/29290150. [DOI] [PMC free article] [PubMed] [Google Scholar]
- 7.Budenz A, Klassen A, Purtle J, Yom Tov E, Yudell M, Massey P. Mental illness and bipolar disorder on Twitter: implications for stigma and social support. J Ment Health. 2020 Apr;29(2):191–199. doi: 10.1080/09638237.2019.1677878. [DOI] [PubMed] [Google Scholar]
- 8.Budhwani H, Hearld KR, Milner AN, Charow R, McGlaughlin EM, Rodriguez-Lauzurique M, Rosario S, Paulino-Ramirez R. Transgender women's experiences with stigma, trauma, and attempted suicide in the Dominican Republic. Suicide Life Threat Behav. 2018 Dec;48(6):788–796. doi: 10.1111/sltb.12400. [DOI] [PubMed] [Google Scholar]
- 9.Turan B, Budhwani H, Fazeli PL, Browning WR, Raper JL, Mugavero MJ, Turan JM. How does stigma affect people living with HIV? The mediating roles of internalized and anticipated HIV stigma in the effects of perceived community stigma on health and psychosocial outcomes. AIDS Behav. 2017 Jan;21(1):283–291. doi: 10.1007/s10461-016-1451-5. http://europepmc.org/abstract/MED/27272742. [DOI] [PMC free article] [PubMed] [Google Scholar]
- 10.Pachankis JE, Hatzenbuehler ML, Hickson F, Weatherburn P, Berg RC, Marcus U, Schmidt AJ. Hidden from health. AIDS. 2015;29(10):1239–1246. doi: 10.1097/qad.0000000000000724. [DOI] [PMC free article] [PubMed] [Google Scholar]
- 11.Dai H, Deem MJ, Hao J. Geographic variations in electronic cigarette advertisements on Twitter in the United States. Int J Public Health. 2017 May;62(4):479–487. doi: 10.1007/s00038-016-0906-9. [DOI] [PubMed] [Google Scholar]
- 12.United States Census Bureau. 2019. Dec, [2020-04-22]. Table 1. Annual Estimates of the Resident Population for the United States, Regions, States, and Puerto Rico: April 1, 2010 to July 1, 2019 (NST-EST2019-01) https://www.census.gov/newsroom/press-kits/2019/national-state-estimates.html.
- 13.Allem J, Ferrara E. The importance of debiasing social media data to better understand e-cigarette-related attitudes and behaviors. J Med Internet Res. 2016 Aug 09;18(8):e219. doi: 10.2196/jmir.6185. [DOI] [PMC free article] [PubMed] [Google Scholar]
- 14.Allem J, Ferrara E, Uppu SP, Cruz TB, Unger JB. E-cigarette surveillance with social media data: social bots, emerging topics, and trends. JMIR Public Health Surveill. 2017 Dec 20;3(4):e98. doi: 10.2196/publichealth.8641. [DOI] [PMC free article] [PubMed] [Google Scholar]
- 15.Alessa A, Faezipour M. Flu outbreak prediction using Twitter posts classification and linear regression with historical Centers for Disease Control and Prevention reports: prediction framework study. JMIR Public Health Surveill. 2019 Jun 25;5(2):e12383. doi: 10.2196/12383. [DOI] [PMC free article] [PubMed] [Google Scholar]
- 16.Grajales FJ, Sheps S, Ho K, Novak-Lauscher H, Eysenbach G. Social media: a review and tutorial of applications in medicine and health care. J Med Internet Res. 2014 Feb 11;16(2):e13. doi: 10.2196/jmir.2912. [DOI] [PMC free article] [PubMed] [Google Scholar]
- 17.Ji X, Chun SA, Wei Z, Geller J. Twitter sentiment classification for measuring public health concerns. Soc Netw Anal Min. 2015;5(1):13. doi: 10.1007/s13278-015-0253-5. http://europepmc.org/abstract/MED/32226558. [DOI] [PMC free article] [PubMed] [Google Scholar]
- 18.Chew C, Eysenbach G. Pandemics in the age of Twitter: content analysis of Tweets during the 2009 H1N1 outbreak. PLoS One. 2010 Nov 29;5(11):e14118. doi: 10.1371/journal.pone.0014118. [DOI] [PMC free article] [PubMed] [Google Scholar]
- 19.Logie CH, Turan JM. How do we balance tensions between COVID-19 public health responses and stigma mitigation? learning from HIV research. AIDS Behav. 2020 Apr 07;:e. doi: 10.1007/s10461-020-02856-8. [DOI] [PMC free article] [PubMed] [Google Scholar]
- 20.Abd-Alrazaq A, Alhuwail D, Househ M, Hamdi M, Shah Z. Top concerns of Tweeters during the COVID-19 pandemic: infoveillance study. J Med Internet Res. 2020 Apr 21;22(4):e19016. doi: 10.2196/19016. [DOI] [PMC free article] [PubMed] [Google Scholar]
- 21.Kouzy R, Abi Jaoude J, Kraitem A, El Alam MB, Karam B, Adib E, Zarka J, Traboulsi C, Akl EW, Baddour K. Coronavirus goes viral: quantifying the COVID-19 misinformation epidemic on Twitter. Cureus. 2020 Mar 13;12(3):e7255. doi: 10.7759/cureus.7255. http://europepmc.org/abstract/MED/32292669. [DOI] [PMC free article] [PubMed] [Google Scholar]
- 22.Rosenberg H, Syed S, Rezaie S. The Twitter pandemic: the critical role of Twitter in the dissemination of medical information and misinformation during the COVID-19 pandemic. CJEM. 2020 Apr 06;:1–4. doi: 10.1017/cem.2020.361. http://europepmc.org/abstract/MED/32248871. [DOI] [PMC free article] [PubMed] [Google Scholar]