

Abstract
Introduction
Vision loss remains a debilitating complication of pituitary adenomas, although there is considerable variability in visual impairment before and after decompression surgery. Growing evidence suggests secondary damage to remote visual structures may contribute to vision loss in patients with chiasmatic compression. The present study leverages ultrahigh field 7T MRI to study the retinotopic organization of the primary visual cortex (V1), and correlates visual defects with cortical thinning in V1 to characterize consequences of pituitary adenomas on the posterior visual system.
Methods
Eight patients (4 males, mean age=44.3 years) with pituitary adenomas who exhibited chiasmatic compression and visual field defects, as well as eight matched healthy controls (4 males, mean=43.3 years), were scanned at 7T MRI for prospective study. Whole-brain cortical thickness was calculated using an automated algorithm. A previously published surface-based algorithm was applied to associate the eccentricity and polar angle with each position in V1. Cortical thickness was calculated at each point in the retinotopic organization, and cortical thickness ratio was generated against matched controls for each point in the visual fields. Adenoma patients additionally underwent neuroophthalmological examination including 24–2 Humphrey automated visual field perimetry. Pattern deviation (PD) of each point in the visual field, the deviation in point-detection compared with normals, was correlated with cortical thickness at corresponding polar and eccentricity angles in V1.
Results
Whole-brain cortical thickness was successfully derived for all patients and controls. The mean tumor volume was 19.4 cm3. The median global thickness of V1 did not differ between patients (mean±S.D.=2.21±0.12cm), compared with controls (2.06±0.13cm), p>0.05. Surface morphometry-based retinotopic maps revealed that all eight adenoma patients showed a significant positive correlation between PD and V1 thickness ratios (r values ranged from 0.31 to 0.46), p < 0.05. Mixed procedure analysis revealed that PD=−8.0719+5.5873*[Median V1 Thickness Ratio].
Conclusion
All eight patients showed significant positive correlations between V1 thickness and visual defect. These findings provide retinotopic of localized V1 cortical neurodegeneration spatially corresponding to impairments in the visual field. These results further characterize changes in the posterior visual pathway associated with chiasmatic compression, and may prove useful in the neuroophthalmological work-up for patients with pituitary macroadenoma.
Keywords: Chiasmatic compression, cortical thickness, retinotopy, 7 Tesla MRI, pituitary adenoma, primary visual cortex, neurosurgery
1. Introduction
Pituitary adenomas are benign intracranial tumors with estimated prevalence rates ranging from 10 to 22% of the general population.9,13 While these lesions are typically histologically indolent and are amenable to surgical resection, vision loss due to compression of the optic nerves and chiasm remains a debilitating consequence of macroadenomas. Furthermore, effects of these tumors on distant optic structures remain poorly understood.34,42
The human visual pathway is a complex system consisting of many critical white and gray matter structures. Prior investigations have primarily assessed the effects of pituitary adenomas on anterior optic structures such as the retinal nerve fiber layer (RNFL)19,24, optic nerves21,22,40, and optic chiasm21,40. More recent studies have established evidence of deterioration in the posterior visual system. For example, Lilja et al. reported reduced optic tract integrity on diffusion tensor imaging (DTI) that correlated with degree of visual dysfunction in macroadenomas patients27 and Phal et al. used DTI to demonstrate reduced microstructural integrity of optic radiations and altered functional activity of the striate cortex.30 More recent investigation at ultrahigh field 7T MRI has demonstrated reduced integrity of the optic tracts and radiations using high-resolution DTI, and that atrophy in the lateral geniculate nucleus correlates with degree of vision loss in patients with pituitary adenomas.35,36
While these studies have shown neuronal deterioration in various aspects of posterior visual structures related to chiasmatic compression by macroadenomas, associated changes within the primary visual cortex (V1) have been inadequately characterized. Imaging techniques such as fMRI have shown that adenoma patients do exhibit distinct changes in V1 including altered functional connectivity, providing evidence of neuronal alteration in the posterior visual system11,38. However, recent advancements in the field of visual neuroscience have made surface morphometry based retinotopic investigation possible.3,4 Evidence of V1 thinning in regions of V1 that correspond to visual field loss have been reported by Burge et al. in macular degeneration; however, similar investigation is needed to elucidate V1 changes in the context of chiasmatic compression.8 Examining structural alterations that result from chiasmatic compression, and their contributions to vision impairment in macroadenoma patients, may be important to further understand the structural substrates of vision loss in these patients.
The purpose of the present study was to leverage high-spatial resolution 7T MRI in patients with pituitary macroadenomas to evaluate cortical thickness of V1 in a retinotopic manner. Cortical thickness was correlated with Humphrey automated perimetry visual field measurements at corresponding points in the visual field to examine functional correlates of cortical restructuring. We hypothesized that cortical thickness would be positively correlated with visual function, and that cortical thickness will be reduced in patients with pituitary macroadenomas in regions of focal visual deficit when compared with healthy controls.
2. Methods
2.1. Participants
The IRB of the Icahn School of Medicine at Mount Sinai approved this study before participant recruitment. Eight patients with pituitary adenomas were recruited through their neurosurgeon (RS) at the Mount Sinai Medical Center between September 2014 and August 2018. Radiological evidence of optic chiasm compression as well as presence of visual field defects were inclusion criteria in this study. Patients were age- and sex-matched with eight neurologically healthy controls. All patients and controls participants provided written informed consent prior to the study.
2.2. Imaging Protocol
Participants were scanned using a 7T whole body scanner (Magnetom, Siemens Healthcare, Erlangen, Germany). A SC72CD gradient coil was used (Gmax = 70 mT/m, max slew rate = 200T/m/s), with a single channel transmit and 32-channel receive head coil (Nova Medical, Wilmington, MA, USA). The imaging protocol included a coronal oblique T1-weighted MP2RAGE28, a volumetric sequence providing 0.7mm3 isotropic voxels using the following parameters: TE = 1.95ms, TR = 3000ms, flip angle (FA) = 7°, field of view (FOV) = 520 × 640-mm2, slices = 224.
2.3. Image Analysis
The net center deflection and thickness of the optic chiasm were measured by an experienced neuroradiologist. The reference line of the chiasm was established by connecting the lateral-most aspects of the mid-chiasm as visualized in the coronal plane. Perpendicular calipers were drawn from the reference line to the superior and inferior margins of the optic chiasm at the point of maximal deflection. The average of these values represents the greatest deviation of the central chiasm. Tumor volume and maximum height were measured using Osirix version 9.0.2 (Pixmeo, Geneva, Switzerland) with T1-weighted images.
2.4. Cortical Reconstruction and Retinotopy Analysis
FreeSurfer version 6.0 (http://surfer.nmr.mgh.harvard.edu) was used to derive whole brain cortical thickness measurements by calculating the distance between pia and the grey/white matter junction.17 Published data by Benson et al. were used as references for polar angle and eccentricity maps of V1.4 These maps were overlaid on the cortical thickness segmentations from FreeSurfer, enabling extraction of the thickness corresponding with polar angle/eccentricity coordinate pairs. In order to map the higher resolution cortical representation of V1 to the lower resolution of the Humphrey Perimetry, each V1 cortical thickness measurement was assigned to relatively larger zones of ±3 eccentricity degrees and ±4 polar angle degrees. This enabled calculation of median thickness of the cortex corresponding with each coordinate on the PD map. Cortical thickness, polar angle, and eccentricity calculations are shown in Figure 2. In addition, the bottom 10th percentile of V1 thickness was calculated for patients and controls.
Figure 2.
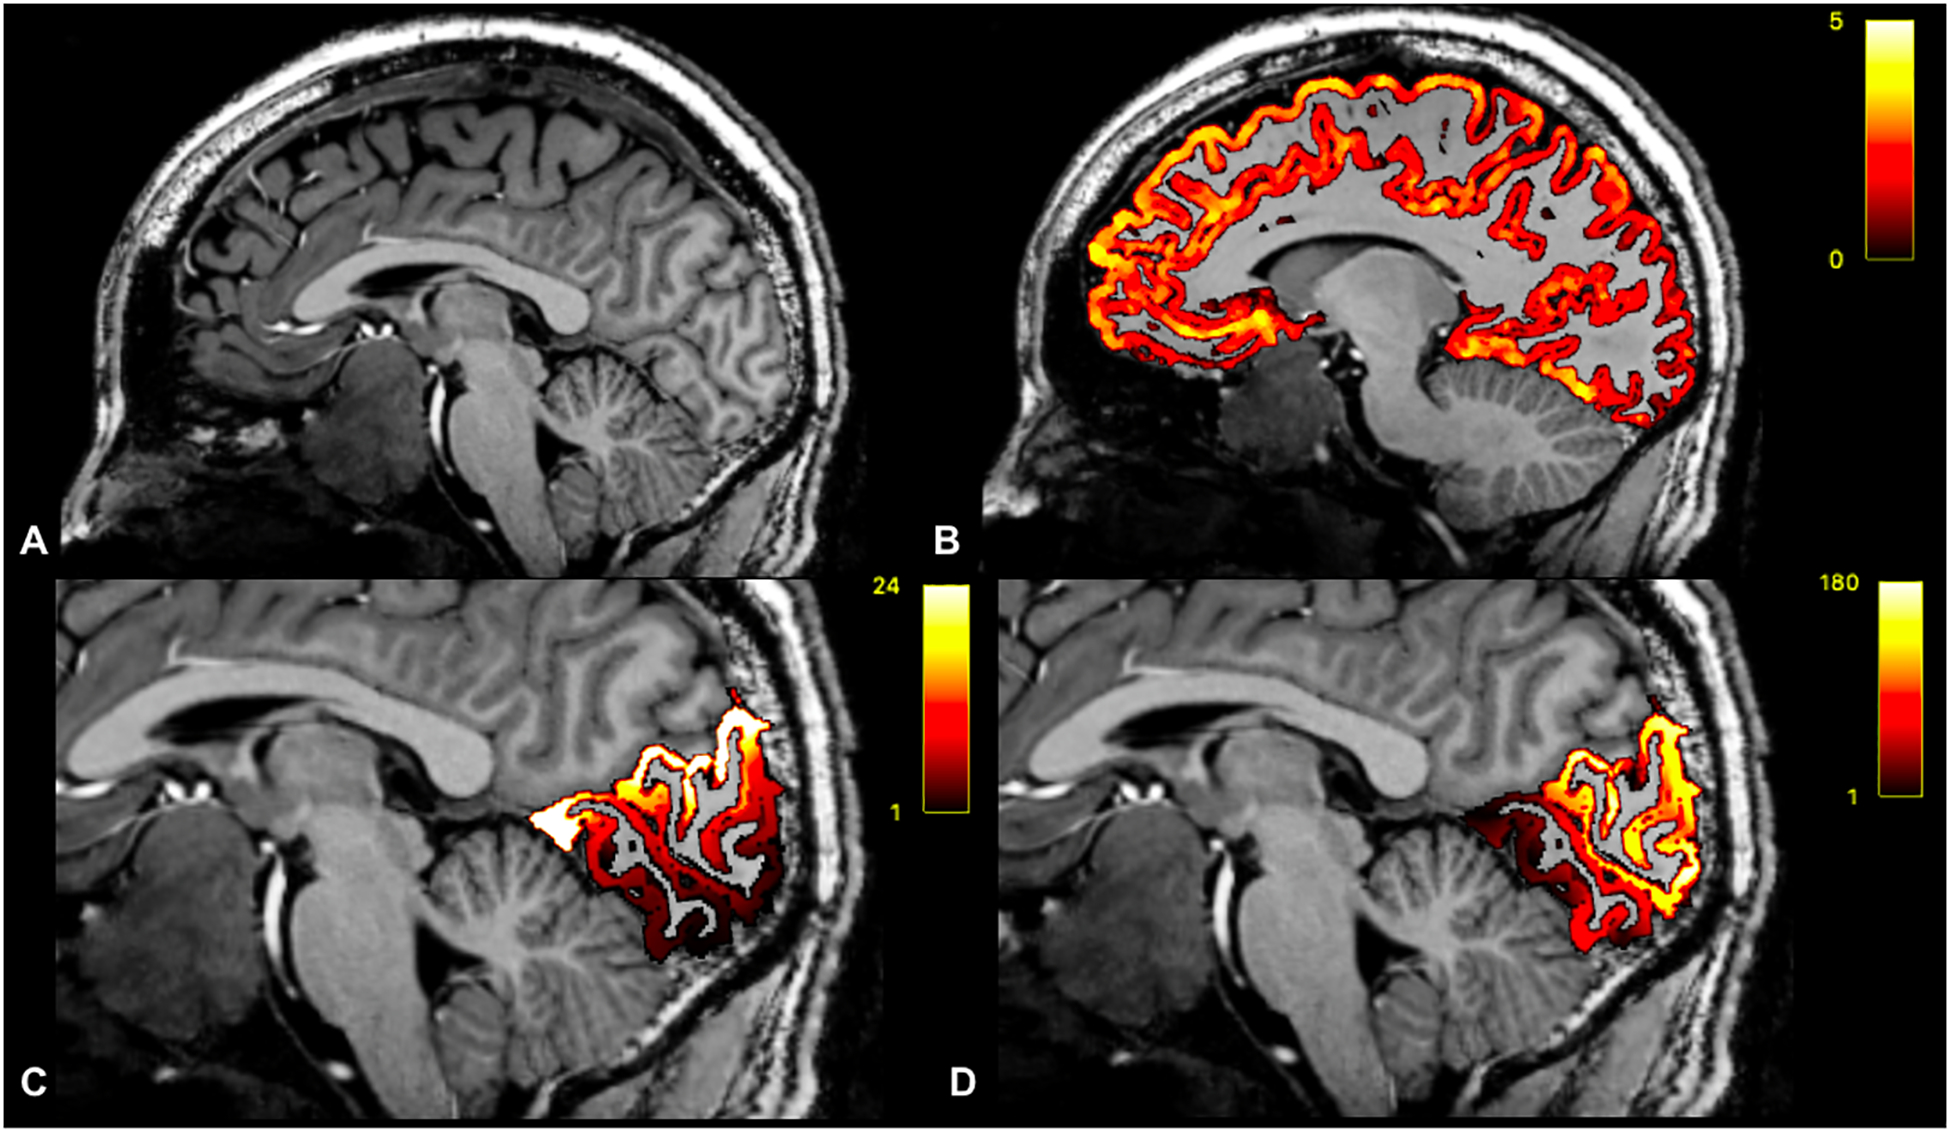
Sagittal T1-weighted image of a patient with pituitary macroadenoma (A). Whole-brain cortical thickness overlaid on T1-weighted imaging (B). Eccentricity coordinates overlaid on T1-weighted imaging (C). Polar Angle coordinates overlaid on T1-wighted imaging (D).
2.5. Neuroophthalmology
All eight patients in this study received preoperative neuroophthalmological evaluation, including measurement of the visual field by a Humphrey Visual Field Analyzer (Figure 1). Humphrey perimetry 24–2 visual field testing was used to determine the presence of visual field defects and to calculate the pattern standard deviations (PD), which reflect differences in the visual field pattern from the normal hill of vision; increasingly negative PD values indicate greater impairment. The polar angle and eccentricity coordinates were calculated for each point in the visual field using the following trigonometry equations (Figure 1):
The reliability criteria used were fixation losses less than 30%, as well as false positive and false negative errors less than 30%. Ocular examination included slit-lamp and dilated fundus examination.
Figure 1.
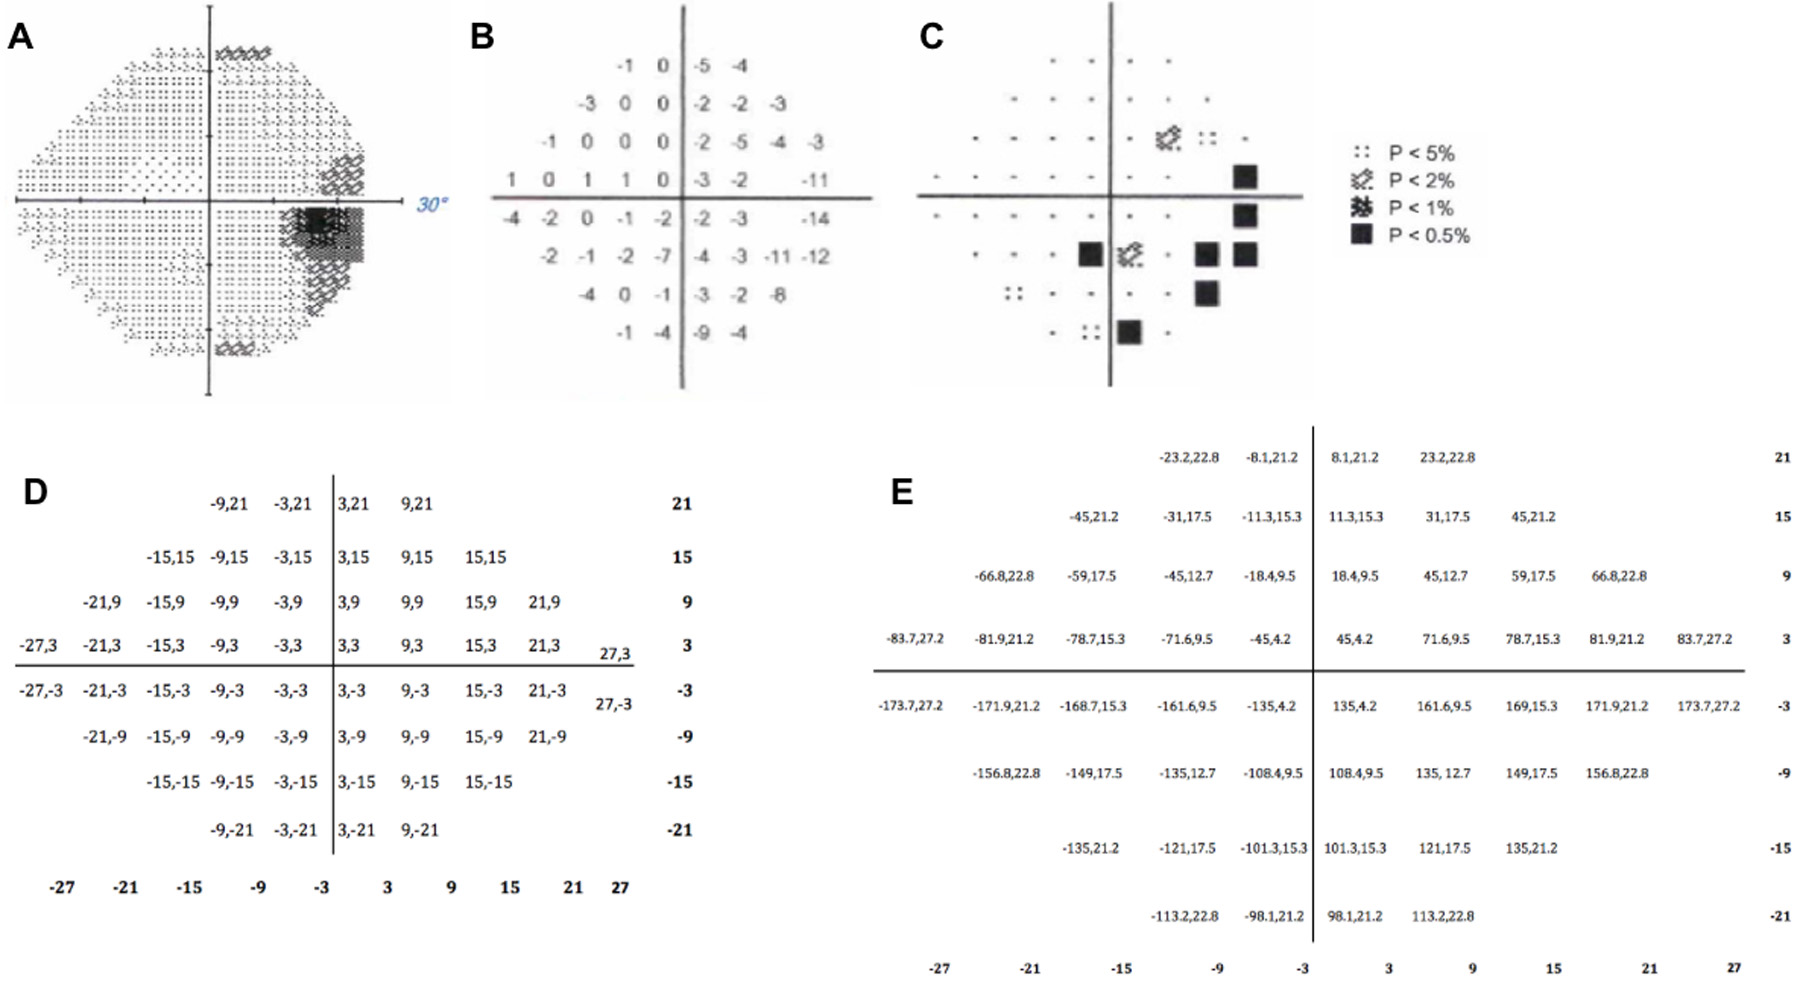
Results of the 24–2 Humphrey Perimetry (OD) for a patient with pituitary adenoma with an inferior nasal field defect (A). Pattern deviation results, with regions of vision loss denoted by increasing negative values (B) and shading (C). The conversion of locations on the 24–2 field to polar angle/eccentricity coordinates (D).
2.6. Statistical Analysis
All statistical analyses were done using SAS v9.4 (SAS Institute Inc, Cary, NC). Similar to previous studies7,8, neuroophthalmological data was averaged across OS and OD because each coordinate in V1 receives electrical input from bilateral retinas. Median V1 thickness values were by divided by median V1 thickness of the matched controls for each location in V1 to give a ratio of median cortical thickness at each region in V1. Pearson correlation coefficients were calculated to determine the association between median V1 thickness ratio and PD values at each point in the visual field, and associated p-values were calculated. The mixed procedure was performed by fitting a general linear model with fixed and random effects to make statistical inferences about the data. Significance was defined as p < 0.05.
3. Results
3.1. Participants
Eight patients (4 male, 4 female, mean age = 44.3 years) with pituitary macroadenomas and eight matched controls (4 males, 4 females, mean age = 43.3 years) were scanned at 7T. There were no significant differences between age or sex in patients compared with controls (p > 0.05 for both). The average pituitary adenoma volume was 19.4 cm3 and the average symptom duration prior to scanning was 53.6 months. Six patients (75%) demonstrated significant improvement and recovery of visual fields following surgery, while 2 (25%) did not exhibit appreciable change in postoperative vision. Demographic information of patients and controls as well as disease features of patients are shown in Table 1.
Table 1.
Demographic data and disease features of pituitary adenoma and healthy control participants.
| Pituitary Adenoma (N = 8) | Control (N = 8) | |
|---|---|---|
| Demographics | ||
| Male, N (%) | 4 (50) | 4 (50) |
| Age (years), Mean (SD) | 44.3 (10.6) | 43.3 (11.3) |
| Disease features | ||
| Tumor volume (cm3), Mean (SD) | 19.4 (20.3) | -- |
| Secreting, N (%) | 2 (25) | -- |
| Chiasm compression, N (%) | 8 (100) | -- |
| Disease duration (months), Mean (SD) | 53.6 (59.1) | -- |
| OS Pattern Deviation (dB), Mean (SD) | −3.5 (3.8) | -- |
| OD Pattern Deviation (dB), Mean (SD) | −2.8 (2.5) | -- |
| Postoperative visual improvement, N (%) | 6 (75) | -- |
3.2. Global V1 Thickness
The median global V1 thickness did not differ between patients (2.06 mm ± 0.2 mm), and controls (2.12 mm ± 0.12 mm), p > 0.05. The median optic chiasm deflection was 2.65 mm ± 2.28 mm. The median maximum tumor height was 1.94 cm ± 1.08 cm. Median global V1 thickness of patients did not correlate with optic chiasm net center deflection (r = −0.58, p > 0.05) or maximum tumor height (r = 0.08, p > 0.05).
The median bottom 10th percentile of cortical thickness was significantly lower in patients (1.22 mm ± 0.05 mm) compared with controls (1.56 mm ± 0.04 mm), p = 0.047. Median bottom 10th percentile of V1 thickness was negatively correlated with center chiasm deflection (r = −0.76, p = 0.03), but was not significantly correlated with tumor height (r = 0.33, p > 0.05).
There was no significant relationship between disease duration and the patient-to-control ratio of median V1 thickness (r = −0.53, p > 0.05). There was a significant negative correlation between disease duration and the patient-to-control ratio of bottom 10th percentile of V1 thickness (r = −0.79, p = 0.02).
3.3. Retinotopic Analysis of V1 Thickness
Polar angle, eccentricity, and cortical thickness were calculated at each point in V1 for patients and controls (Figure 3). Correlations between median ratio of V1 cortical thickness and PD for each of the 8 patients in this study are shown in Figure 4. All eight patients showed significant positive correlations between V1 cortical thickness and PD, with an mean Pearson correlation coefficient of 0.39 (SD: 0.08) (Table 2). These results suggest that regions of the visual field with more negative PD, indicative of greater defect, show greater cortical thinning in corresponding regions of V1 than in less affected areas. The results of the mixed procedure yielded the following equation:
For example, if the median V1 thickness ratio is 1, then the calculated Pattern Deviation = −8.0719 + 5.5873 * [1] = −2.4846dB. Heat maps of median V1 thickness ratio and PD values are shown in Figure 5.
Figure 3.
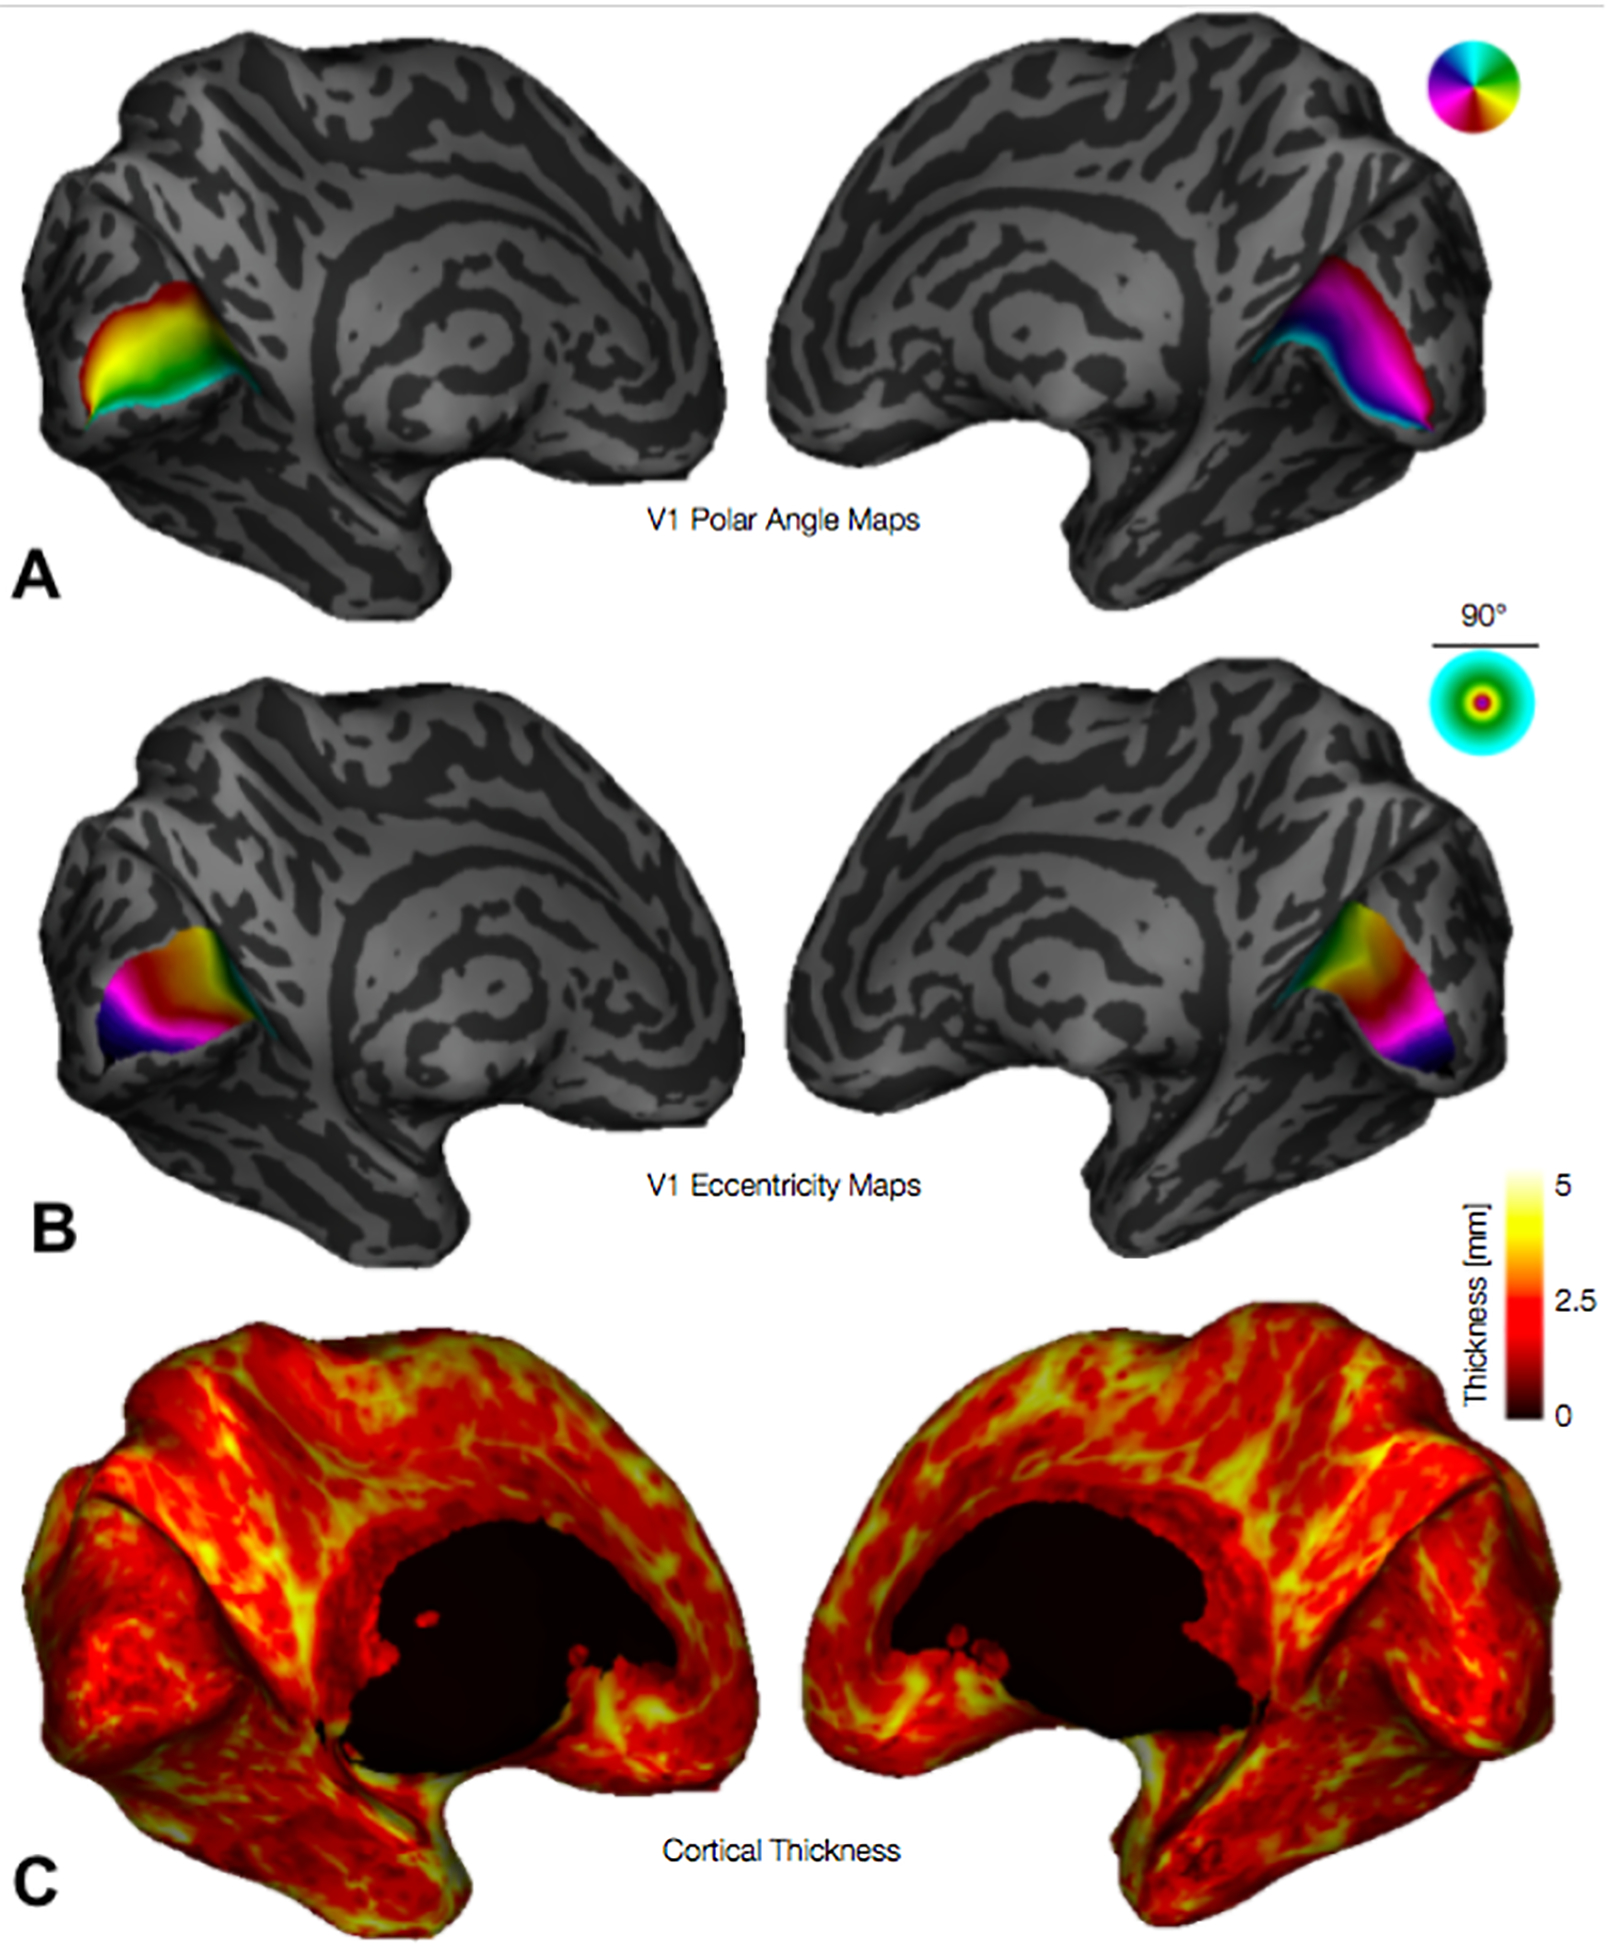
Inflated 3D cortical surfaces showing (A) polar angles, (B) eccentricities, and (C) cortical thickness. Legends for polar angle and eccentricity (upper right corner of panels A and B) plot the visual field, up to 45° of eccentricity, centered at the fovea; colors plotted on cortex indicate the position in the visual field of the cortical population receptive field center; for example, in panel A (polar angle maps) the lower vertical meridian / dorsal lip of V1 is colored red while the upper vertical meridian / ventral lip of V1 is cyan.
Figure 4.
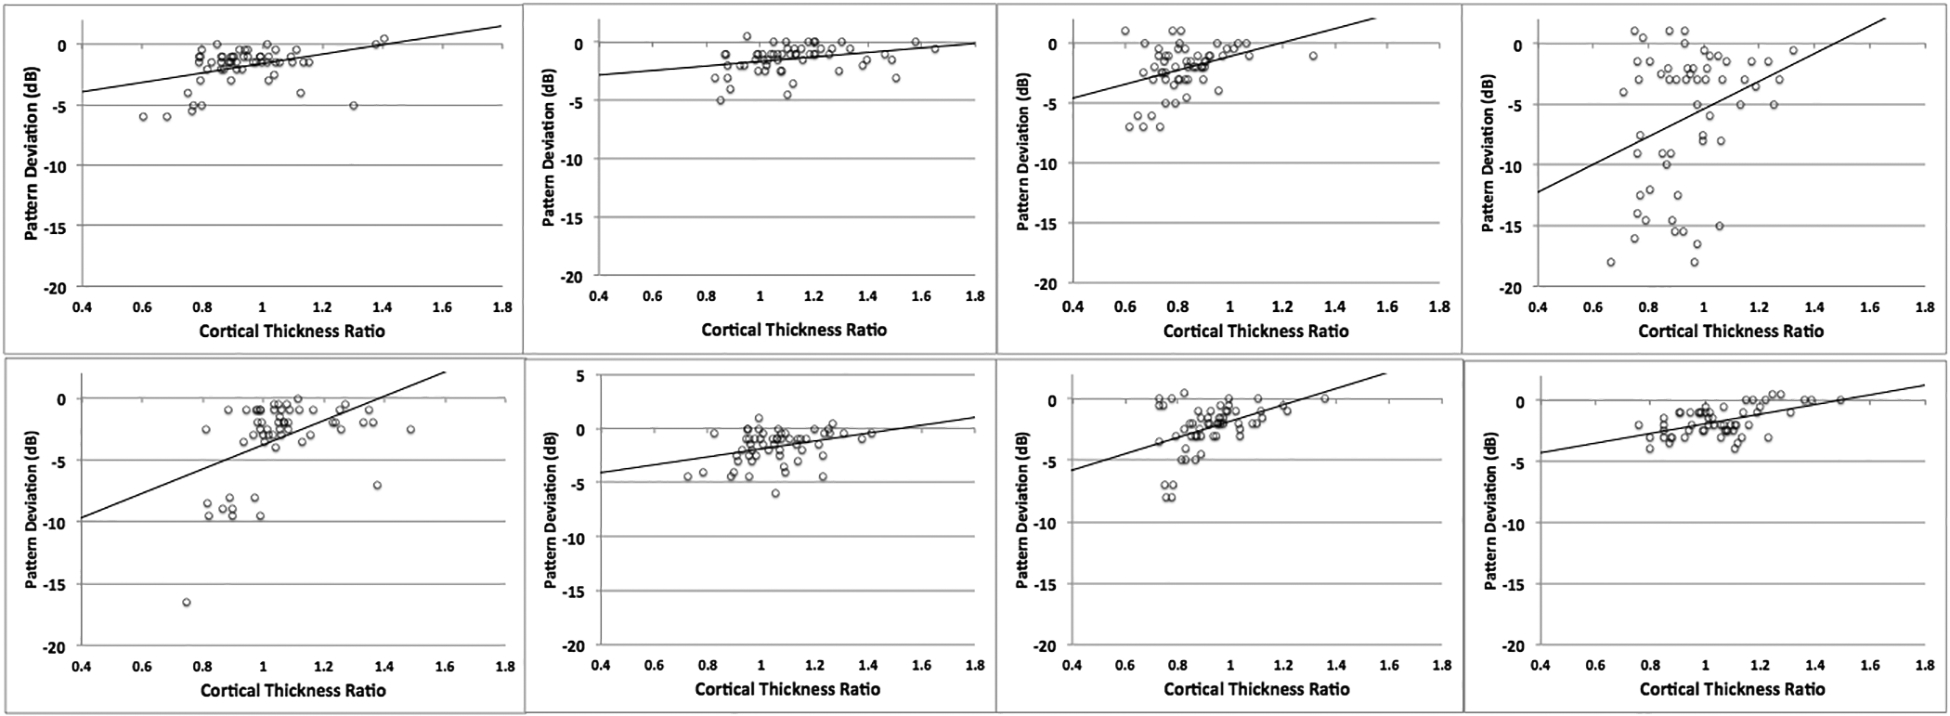
Pearson correlations showing the relationship between median V1 thickness ratio and pattern deviation in the eight patients with pituitary adenoma.
Table 2.
Pearson correlation coefficients and corresponding p-values between primary visual cortical thickness ratios and pattern deviation values in the eight patients with pituitary adenoma.
| Subject No. | Pearson Coefficient | p-value |
|---|---|---|
| 1 | 0.39 | 0.003 |
| 2 | 0.311 | 0.02 |
| 3 | 0.366 | 0.006 |
| 4 | 0.306 | 0.022 |
| 5 | 0.462 | < 0.001 |
| 6 | 0.34 | 0.001 |
| 7 | 0.445 | < 0.001 |
| 8 | 0.53 | < 0.001 |
Figure 5.
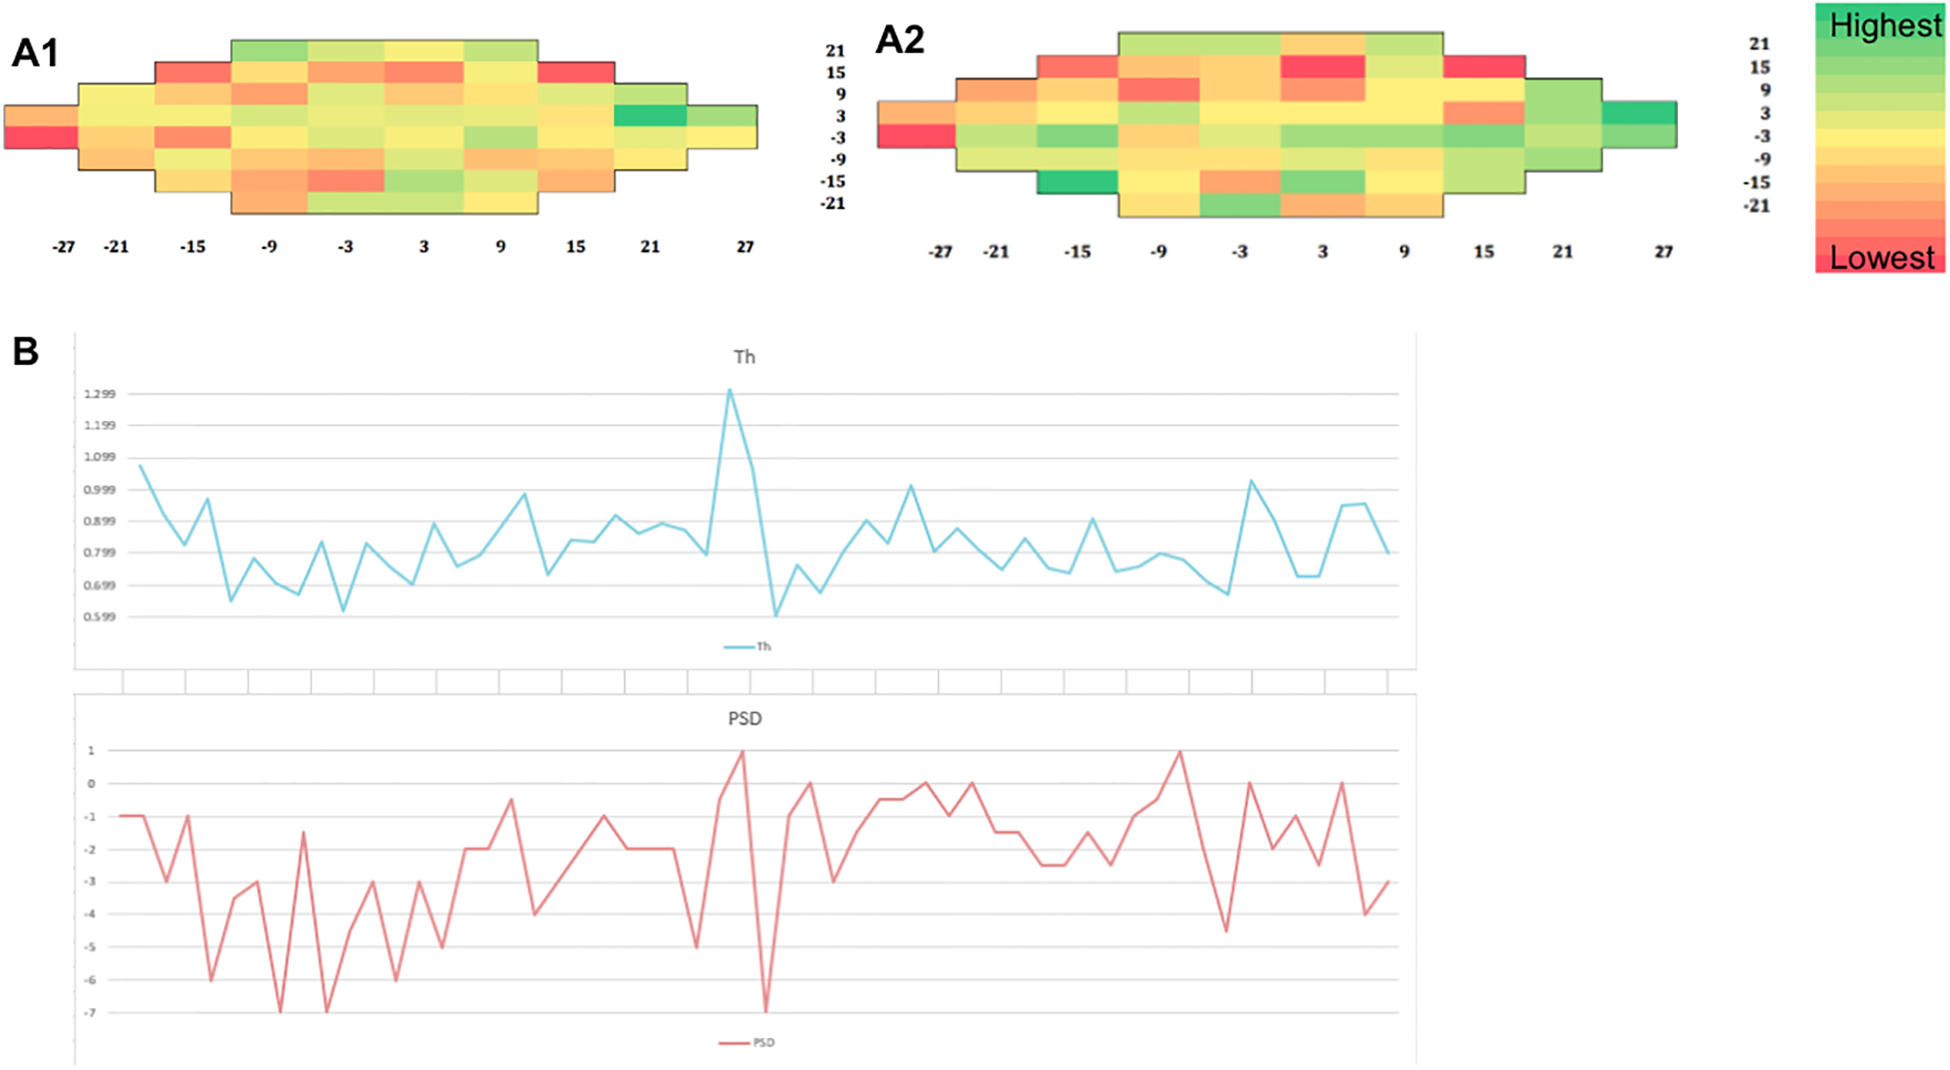
Heat maps for a pituitary macroadenoma patient showing the association between median V1 thickness ratio (A1) and pattern deviation values (A2). Plot showing the relationship between PSD and cortical thickness (B).
4. Discussion
The pathology of pituitary adenoma has been extensively studied in the anterior visual system, and several factors have been examined to characterize vision loss from pituitary adenoma. Prior studies have shown inconsistent results in the ability of existing metrics to predict extent of impairment and recovery. These factors include tumor volume12,32, preoperative visual function12, and length of visual symptoms26. Evidence suggest that RNFL thickness is sensitive to vision loss and can be useful in predicting vision recovery following decompression surgery;15 however, there is considerable variation in both presenting visual symptoms and postoperative vision recovery that cannot be explained with current clinical models.20,25,29 The present study couples high-resolution 7T MRI with a precise algebraic template of the visual cortex to correlate visual field defect with V1 thickness by exploiting the known retinotopic organization of the human visual cortex.4 We demonstrate the relationship between visual field defect quantified by Humphrey Perimetry and the surface-based morphometry of V1 in order to assess distant effects of anterior optic apparatus injury that may contribute to vision loss from chiasmatic compression by pituitary adenomas (Figure 6).
Figure 6.
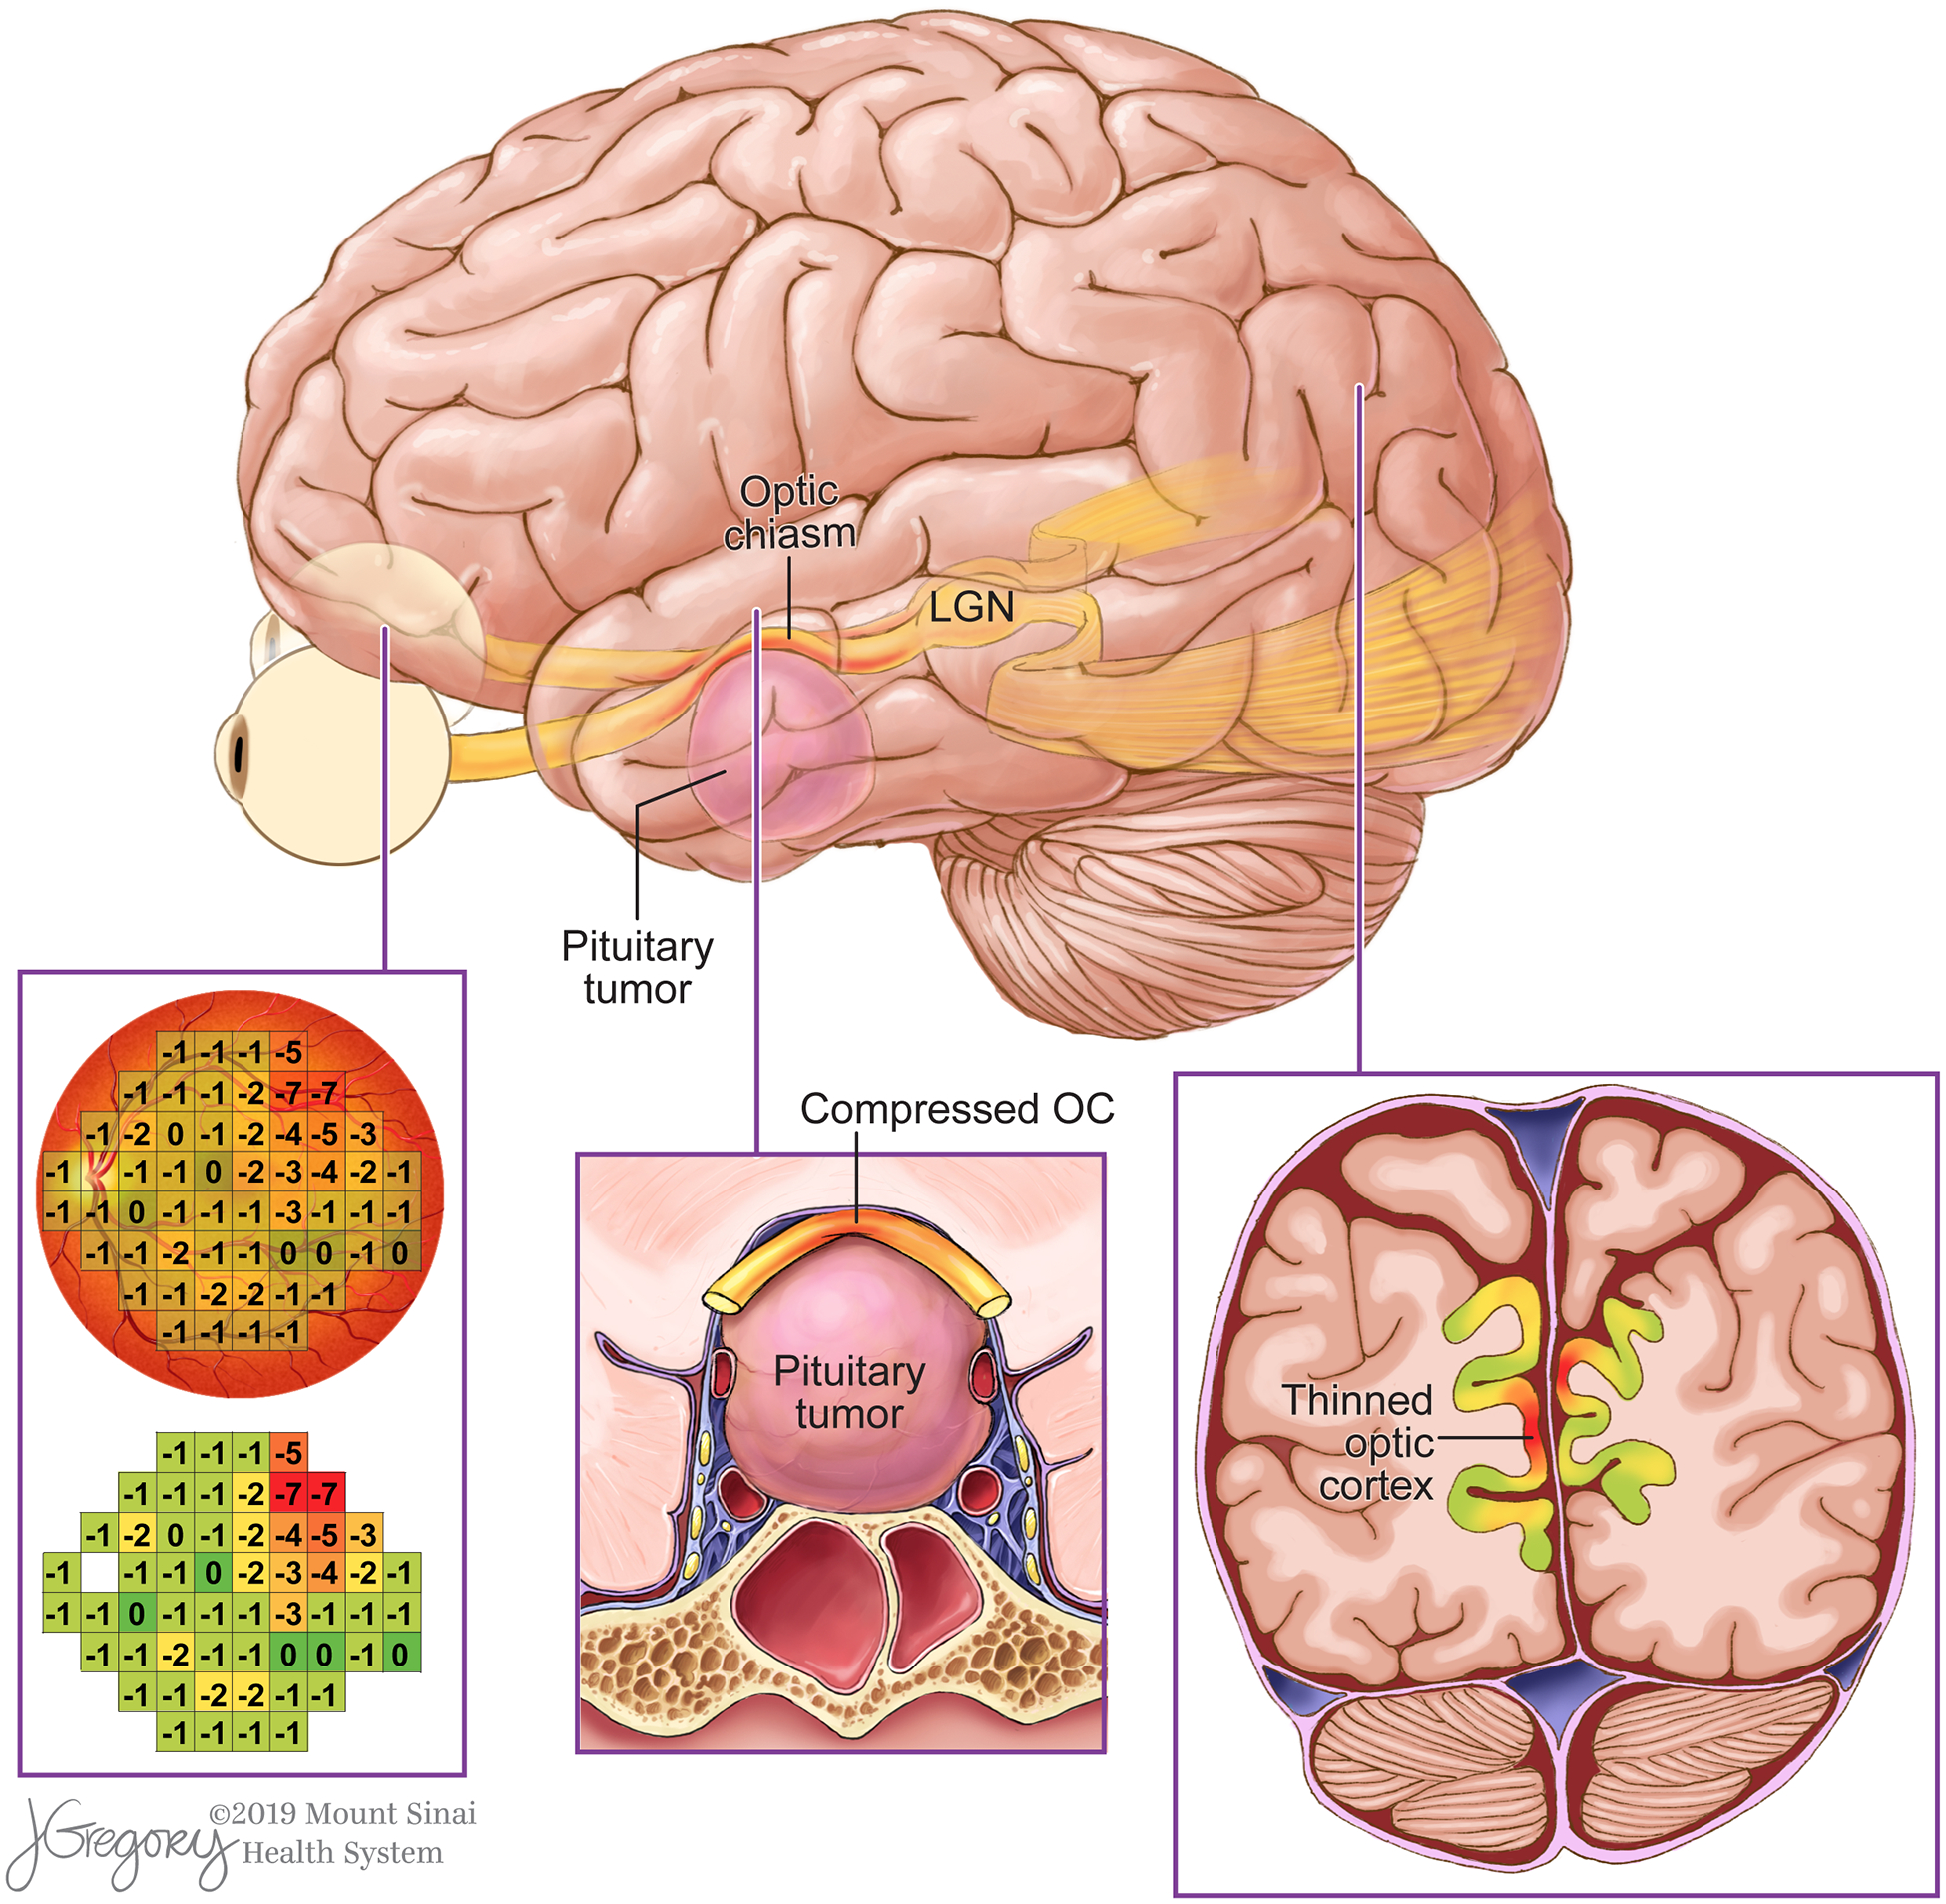
Rendering of a pituitary adenoma causes optic chiasm compression and retinotopic thinning in V1. Areas of visual field defect and corresponding regions of V1 thinning are shown in red.
Tatsuji Inouye and Gordon Holmes were the first to provide evidence of the retinotopic organization of V1, the phenomenon by which stimuli in the visual field are transmitted to corresponding functional nodes in V1 that are defined by polar angle/eccentricity coordinates.1,23,37 Eccentricity describes how the representation of the visual field changes from the center to the periphery when moving posterior to anterior in V1. Polar angle refers to how the representation of the visual field changes from the upper vertical meridian through the horizontal meridian to the lower vertical when moving from the lower lip to the upper lip of the calcarine.39 The fovea is represented on the posterior aspect of V1, and the peripheral regions of the retina are mapped more anteriorly. The superior visual field is represented below the calcarine sulcus and the inferior visual field is represented above it.39
The ability of fMRI to measure changes associated with cerebral blood flow (CBF) has made it the dominant modality used to study neuronal organization of V1.37 However, recent studies have made it possible to study V1 retinotopy using other sequences.3,4 Benson et al. demonstrated that the retinotopic organization of striate cortex can be predicted with an anatomical image alone using gyral and sulcal curvature angles with an accuracy equivalent to a 10–25 min fMRI scan.4 In addition to decreased resting CBF, a reduction in gray matter volume in the region of V1 has been shown concordant with the location of the peripheral field defects in patients with primary open angle glaucoma.5,6,45 Similarly, Yu et al. studied visual cortex thickness using 3T MRI in patients with primary open-angle glaucoma and found reported cortical thinning in certain regions of the visual cortex that correlated with RNFL.44
Few studies have examined the retinotopic organization of V1 in patients with chiasmatic compression. Chouinard et al. performed a retinotopic analysis on one patient with pituitary adenoma using fMRI and correlated V1 activation with Humphrey perimetry.11 They found that after surgical decompression of the optic apparatus, fMRI showed increased activation of V1 in a distribution that corresponded with improvements in visual field perimetry.11 Phal et al. found that patients who did not recover vision after pituitary adenoma surgery showed significantly reduced preoperative V1 activation compared with patients who successfully recovered vision.30
To our knowledge, ours is the first study to evaluate the retinotopic organization of V1 thickness in patients with chiasmatic compression by pituitary adenomas. We report diminished thickness which appears to represent localized cortical neurodegeneration in regions that correspond with functional loss in the visual field. Furthermore, this is the first study to leverage the increased resolution at 7T to measure retinotopic features of V1 in vivo. We chose to use pattern deviation as our measure of visual function instead of total deviation because the total deviation summarizes the difference between the values observed on age-specific normal threshold values at each point in the visual field.2 Pattern deviation calculates the difference between each observed threshold and the average threshold across the entire visual field and shows the differences between these values and age-specific normal threshold differences at each location in the visual field.2 We believe that this gave a more sensitive representation of vision loss in patients with pituitary adenoma.
Interestingly, we did not observe a significant difference in global median V1 thickness between patients and controls. While this may be partially attributable to the small sample size in this study, our data suggest that this negative finding could also indicate that cortical thinning is not a global process but is instead restricted to cortical nodes that correspond with regions in the visual field with functional loss. This scenario is corroborated by our finding of significantly reduced global thickness of the thinnest aspects (bottom 10th percentile) of V1. We also report a significant association between disease chronicity and bottom 10th percentile of V1, such that patients with greater visual symptom duration had reduced cortical thickness. While median V1 thickness also showed a negative relationship with symptom duration, this effect was not significant. These findings suggest that assessing the average thickness of the entire V1 may dilute concentrated areas of significant atrophy, so analyzing the visual system in a retinotopic manner is necessary to characterize these effects. We found a significant positive correlation between V1 cortical thickness and PD values. This finding is important, as it provides structural evidence of retinotopy and could be used to measure extent of damage to the posterior visual pathway. Furthermore, it may ultimately prove useful in identifying patients that are at-risk for vision loss due to pituitary adenomas.
While the precise mechanism by which V1 thins as a consequence of pituitary adenomas remains unclear, our data suggest one of two possible mechanisms. Firstly, reduced cortical thickness may reflect anterograde transsynaptic degeneration (aTSD). Secondary damage to neurons resulting from injury to connected distant structures has been reported in numerous human neural pathways, including the visual system.18,41 Degeneration due to mechanical injury to the optic nerves and chiasm by an enlarging tumor may therefore be relayed to the lateral geniculate nucleus via the optic tracts and to cell bodies in V1 via the optic radiations, resulting in cell death and cortical thinning. Similarly, diminished cortical volume resulting from chronic hypoperfusion due to diminished cortical demand. Chronic attenuation of regional CBF has been shown to cause cortical thinning of the cerebral cortex due to apoptosis or cell involution.10,16 Chen et al. showed that cortical thinning and reduced CBF were directly associated in patients with Huntingdon’s disease.10 Prior reports of reduced functional activity of V1 in patients with pituitary adenoma may indicate diminished regional CBF and metabolic demand, making certain regions in V1 susceptible to neuronal fallout and volume loss.11,33 Performing arterial spinal labeling in V1 of patients with pituitary adenoma may clarify the role of hypoperfusion in its role in cortical thinning as well as vision loss in patients with pituitary adenoma. These hypothesis is supported by prior reports of reduced microstructural integrity of the optic tracts27,35 and radiations30,35, as well as atrophy of the lateral geniculate nucleus36 in patients with pituitary macroadenomas.
Another possible mechanism for cortical thinning may entail changes from compensatory plastic restructuring of V1 as a result of decreased stimulation to retinotopic regions that receive input areas of the visual field defects. Previous studies have shown decreased gray matter volume and cortical thinning in patients with central vision loss.6,31 Burge et al. found that patients with vision loss from macular degeneration showed cortical thinning in areas of V1 that corresponded with defects. These findings suggest that attenuated input and reduced activation of regions of V1 that are associated with visual field defects may result in localized gray matter atrophy and cortical thinning. If this second mechanism does form the basis for cortical thinning, patients with profound vision loss from pituitary adenomas or other compressive skull base pathologies may benefit from retinal prosthesis devices.14,45 These devices provide stimulation to the retina and posterior structures, including the lateral geniculate nucleus and V1, to increase neuronal transmission, thereby preventing neurodegeneration in critical processing nodes.14,45 While retinal prosthesis has not been used in patients with pituitary adenomas, emerging research does corroborate the role of posterior optic structure contributors in vision loss, and novel technologies such as retinal stimulation may play a role in preserving or recovering vision in patients with pituitary adenomas. Continued investigation of 7T retinotopic mapping is necessary to establish this modality as a method for guiding interventions in patients with pituitary adenoma.
Interestingly, in their work Burge et al. also reported areas of cortical thickening in macular degeneration patients in V1 those regions corresponding with spared fields of vision, suggesting possible compensatory recruitment of neurons with preserved input.8 This process may also help to explain why our data show cortical thickening in V1 compared with matched controls, even with areas of thinning included in the overall mean. This is evidenced by the median thickness ratios that are greater than 1 in Figure 3, and by the green cells in Figure 4. V1 thickness ratios greater than 1 tended to correspond to regions of the visual field without demonstrable visual defect, as PD values fell within normal limits. This suggests that retinotopic nodes that are not associated with functional impairment may be recruited and exhibit cortical thickening as compensation for neurodegeneration in regions that are affected by visual defects. The cellular mechanism by which cortical thickening occurs in the presence of vision loss due to chiasmal compression is an important line of inquiry, and future work should confirm this phenomenon in a larger sample and examine the consequences of cortical thickening in pituitary adenoma patients.
Limitations and Future Directions
There are several limitations of the present study that should be addressed. First, a relatively small number of patients were included in this study, which reduced statistical power and precluded some meaningful statistical analyses and reduced detectability of findings. For example, unlike the bottom 10th percentile of cortical thickness we found that the median V1 thickness neither differed between patients and controls nor correlated with disease duration. While this may be because only certain V1 locations that correspond to visual field loss exhibit degeneration while the remainder of the cortex is unaffected, this negative finding may also reflect our small sample size. While 7T MRI confers increased signal-to-noise-ratio and higher spatial resolution over conventional field-strength systems, ultrahigh field imaging has more contraindications, making patient inclusion criteria more stringent and more selective. In addition, to standardize neuroophthalmological measurements, only patients that received Humphrey perimetry 24–2 visual field testing were included in this study, further limiting the sample size. Because the retinotopic analyses relied on the points in the perimetric visual field, of which each patient had many, these correlations were sufficiently powered to detect effects. However, the small sample size in the present study precluded statistical comparison of V1 thickness between patients that experiences postoperative visual field improvement and those that did not. Future 7T surface morphometry-based retinotopy studies with greater numbers of patients with pituitary adenomas are warranted to further examine the association between preoperative V1 thickness and postoperative vision recovery. Additionally, because the neuroophthalmological data was collected retrospectively, the present study did not include neuroophthalmological examination for the control participants and we acknowledge that a similar phenomenon may exist in controls. However, given the low expected visual field heterogeneities, it is unlikely that these correlations would be as apparent in controls, and future studies are required to determine whether a similar retinotopic association between pattern deviation and V1 thickness exists in healthy individuals.
Like other sensory systems that are topographically organized, such as the primary somatosensory cortex, the size of V1 cortex attributed to each point on the retina is not uniform. Higher density of sensory neuronal input to an area of the retina corresponds a broader segment of devoted V1 surface area.43 Therefore, retinal regions like the macula correspond with a disproportionately larger swath of V1 than more peripheral retinal regions with less axonal supply.43 This property was not taken into account in the present study, and may have accounted for some noise in the data. Future work in this area should focus on adjusting V1 surface area sizes to reflect degree of sensory input from regions of the retina.
Lastly, postoperative imaging and optical coherence tomography (OCT) are important extensions of this work that were not included in the current study’s protocol, which is a noteworthy limitation of this study. While OCT testing was not routinely performed on the patients in this study, examining retinal nerve fiber layer thickness and V1 thickness in a retinotopic manner is an important area of investigation and an area of future work in our group. Chouinard et al. reported retinotopic changes in functional connectivity in one pituitary adenoma patient following surgical decompression, suggesting that there is postoperative reorganization in V1 that may contribute to vision recovery.11 Investigation of changes in V1 cortical thickness following surgery will be important for characterizing neuroplastic changes as well as for determining structural factors that contribute to vision recovery in patients with pituitary macroadenomas. Future studies are required to determine whether there is structural recovery of V1 following decompression of the optic chiasm and to elucidate the timecourse and function correlates of these changes.
5. Conclusion
Despite neurosurgical advances that have permitted high rates of gross total resection for pituitary adenomas, relatively little is known about contributions of posterior optic structures to vision loss in patients with chiasmatic compression. The present study augments a growing body of evidence of changes posterior to the chiasm that can be found as a result of anterior optic apparatus compression. Previously, studies have reported neuronal damage in the lateral geniculate nucleus, optic tracts, and optic radiations among pituitary adenoma patients.27,30,35,36 Here we use ultrahigh field MRI and sub-millimeter structural imaging to report evidence of reduced V1 thickness in pituitary adenoma patients in a pattern and severity that parallels defects on visual field testing. Changes in the posterior visual pathway may contribute to visual dysfunction, and examining their role in vision recovery following decompression surgery in the future holds potential to predict postoperative visual field prognosis in pituitary macroadenoma patients.
Disclosure of funding
NIH R01 CA202911
Icahn School of Medicine Capital Campaign, Translational and Molecular Imaging Institute and Department of Radiology, Icahn School of Medicine at Mount Sinai
Abbreviations:
- DTI
diffusion tensor imaging
- RNFL
retinal nerve fiber layer
- T
Tesla
- V1
primary visual cortex
Footnotes
Disclosures
Dr. Priti Balchandani (the Principal Investigator in this study) is a named inventor on patents relating to magnetic resonance imaging (MRI) and RF pulse design. The patents have been licensed to GE Healthcare, Siemens AG, and Philips international. Dr. Balchandani receives royalty payments relating to these patents.
Dr. Balchandani is a named inventor on patents relating to Slice-selective adiabatic magnetization T2-preparation (SAMPA) for efficient T2-weighted imaging at ultrahigh field strengths, Methods for Producing a Semi-Adiabatic Spectral-Spatial Spectroscopic Imaging Sequence and Devices There of, and Semi-Adiabatic Spectral-spatial Spectroscopic Imaging.
Dr. Joshua Bederson (a Significant Contributor in this study and Chair of the Department of Neurosurgery) owns equity in Surgical Theater, LLC. (manufacturer of the Surgical Navigation Advanced Platform (SNAP) system that may be used for intraoperative image guidance in the study).
The remaining authors report no conflict of interest concerning the materials or methods used in this study or the findings specified in this paper.
References
- 1.Arcaro MJ, McMains SA, Singer BD, Kastner S: Retinotopic organization of human ventral visual cortex. J Neurosci 29:10638–10652, 2009 [DOI] [PMC free article] [PubMed] [Google Scholar]
- 2.Asman P, Wild JM, Heijl A: Appearance of the pattern deviation map as a function of change in area of localized field loss. Invest Ophthalmol Vis Sci 45:3099–3106, 2004 [DOI] [PubMed] [Google Scholar]
- 3.Benson NC, Butt OH, Brainard DH, Aguirre GK: Correction of distortion in flattened representations of the cortical surface allows prediction of V1–V3 functional organization from anatomy. PLoS Comput Biol 10:e1003538, 2014 [DOI] [PMC free article] [PubMed] [Google Scholar]
- 4.Benson NC, Butt OH, Datta R, Radoeva PD, Brainard DH, Aguirre GK: The retinotopic organization of striate cortex is well predicted by surface topology. Curr Biol 22:2081–2085, 2012 [DOI] [PMC free article] [PubMed] [Google Scholar]
- 5.Bogorodzki P, Piatkowska-Janko E, Szaflik J, Szaflik JP, Gacek M, Grieb P: Mapping cortical thickness of the patients with unilateral end-stage open angle glaucoma on planar cerebral cortex maps. PLoS One 9:e93682, 2014 [DOI] [PMC free article] [PubMed] [Google Scholar]
- 6.Boucard CC, Hernowo AT, Maguire RP, Jansonius NM, Roerdink JB, Hooymans JM, et al. : Changes in cortical grey matter density associated with long-standing retinal visual field defects. Brain 132:1898–1906, 2009 [DOI] [PMC free article] [PubMed] [Google Scholar]
- 7.Brown HD, Woodall RL, Kitching RE, Baseler HA, Morland AB: Using magnetic resonance imaging to assess visual deficits: a review. Ophthalmic Physiol Opt 36:240–265, 2016 [DOI] [PMC free article] [PubMed] [Google Scholar]
- 8.Burge WK, Griffis JC, Nenert R, Elkhetali A, DeCarlo DK, ver Hoef LW, et al. : Cortical thickness in human V1 associated with central vision loss. Sci Rep 6:23268, 2016 [DOI] [PMC free article] [PubMed] [Google Scholar]
- 9.Buurman H, Saeger W: Subclinical adenomas in postmortem pituitaries: classification and correlations to clinical data. Eur J Endocrinol 154:753–758, 2006 [DOI] [PubMed] [Google Scholar]
- 10.Chen JJ, Salat DH, Rosas HD: Complex relationships between cerebral blood flow and brain atrophy in early Huntington’s disease. NeuroImage 59:1043–1051, 2012 [DOI] [PMC free article] [PubMed] [Google Scholar]
- 11.Chouinard PA, Striemer CL, Ryu WHA, Sperandio I, Goodale MA, Nicolle DA, et al. : Retinotopic organization of the visual cortex before and after decompression of the optic chiasm in a patient with pituitary macroadenoma. 117:218, 2012 [DOI] [PubMed] [Google Scholar]
- 12.Cohen AR, Cooper PR, Kupersmith MJ, Flamm ES, Ransohoff J: Visual recovery after transsphenoidal removal of pituitary adenomas. Neurosurgery 17:446–452, 1985 [DOI] [PubMed] [Google Scholar]
- 13.Costello RT: Subclinical Adenoma of the Pituitary Gland. Am J Pathol 12:205–216.201, 1936 [PMC free article] [PubMed] [Google Scholar]
- 14.da Cruz L, Coley BF, Dorn J, Merlini F, Filley E, Christopher P, et al. : The Argus II epiretinal prosthesis system allows letter and word reading and long-term function in patients with profound vision loss. Br J Ophthalmol 97:632–636, 2013 [DOI] [PMC free article] [PubMed] [Google Scholar]
- 15.Danesh-Meyer HV, Papchenko T, Savino PJ, Law A, Evans J, Gamble GD: In vivo retinal nerve fiber layer thickness measured by optical coherence tomography predicts visual recovery after surgery for parachiasmal tumors. Invest Ophthalmol Vis Sci 49:1879–1885, 2008 [DOI] [PubMed] [Google Scholar]
- 16.Fierstra J, Poublanc J, Han JS, Silver F, Tymianski M, Crawley AP, et al. : Steal physiology is spatially associated with cortical thinning. J Neurol Neurosurg Psychiatry 81:290–293, 2010 [DOI] [PubMed] [Google Scholar]
- 17.Fischl B: FreeSurfer. Neuroimage 62:774–781, 2012 [DOI] [PMC free article] [PubMed] [Google Scholar]
- 18.Gabilondo I, Martínez-Lapiscina EH, Martínez-Heras E, Fraga-Pumar E, Llufriu S, Ortiz S, et al. : Trans-synaptic axonal degeneration in the visual pathway in multiple sclerosis. 75:98–107, 2014 [DOI] [PubMed] [Google Scholar]
- 19.Glebauskiene B, Liutkeviciene R, Zlatkute E, Kriauciuniene L, Zaliuniene D: Association of retinal nerve fibre layer thickness with quantitative magnetic resonance imaging data of the optic chiasm in pituitary adenoma patients. J Clin Neurosci 50:1–6, 2018 [DOI] [PubMed] [Google Scholar]
- 20.Gnanalingham KK, Bhattacharjee S, Pennington R, Ng J, Mendoza N: The time course of visual field recovery following transphenoidal surgery for pituitary adenomas: predictive factors for a good outcome. J Neurol Neurosurg Psychiatry 76:415–419, 2005 [DOI] [PMC free article] [PubMed] [Google Scholar]
- 21.Hajiabadi M, Samii M, Fahlbusch R: A preliminary study of the clinical application of optic pathway diffusion tensor tractography in suprasellar tumor surgery: preoperative, intraoperative, and postoperative assessment. 125:759, 2016 [DOI] [PubMed] [Google Scholar]
- 22.Hisanaga S, Kakeda S, Yamamoto J, Watanabe K, Moriya J, Nagata T, et al. : Pituitary Macroadenoma and Visual Impairment: Postoperative Outcome Prediction with Contrast-Enhanced FIESTA. AJNR Am J Neuroradiol 38:2067–2072, 2017 [DOI] [PMC free article] [PubMed] [Google Scholar]
- 23.Holmes G: DISTURBANCES OF VISION BY CEREBRAL LESIONS. Br J Ophthalmol 2:353–384, 1918 [DOI] [PMC free article] [PubMed] [Google Scholar]
- 24.Johansson C, Lindblom B: The role of optical coherence tomography in the detection of pituitary adenoma. Acta Ophthalmol 87:776–779, 2009 [DOI] [PubMed] [Google Scholar]
- 25.Kerrison JB, Lynn MJ, Baer CA, Newman SA, Biousse V, Newman NJ: Stages of improvement in visual fields after pituitary tumor resection. Am J Ophthalmol 130:813–820, 2000 [DOI] [PubMed] [Google Scholar]
- 26.Lennerstrand G: Visual recovery after treatment for pituitary adenoma. Acta Ophthalmol (Copenh) 61:1104–1117, 1983 [DOI] [PubMed] [Google Scholar]
- 27.Lilja Y, Gustafsson O, Ljungberg M, Starck G, Lindblom B, Skoglund T, et al. : Visual pathway impairment by pituitary adenomas: quantitative diagnostics by diffusion tensor imaging. 127:569, 2016 [DOI] [PubMed] [Google Scholar]
- 28.Marques JP, Kober T, Krueger G, van der Zwaag W, Van de Moortele PF, Gruetter R: MP2RAGE, a self bias-field corrected sequence for improved segmentation and T1-mapping at high field. Neuroimage 49:1271–1281, 2010 [DOI] [PubMed] [Google Scholar]
- 29.Okamoto Y, Okamoto F, Yamada S, Honda M, Hiraoka T, Oshika T: Vision-related quality of life after transsphenoidal surgery for pituitary adenoma. Invest Ophthalmol Vis Sci 51:3405–3410, 2010 [DOI] [PubMed] [Google Scholar]
- 30.Phal PM, Steward C, Nichols AD, Kokkinos C, Desmond PM, Danesh-Meyer H, et al. : Assessment of Optic Pathway Structure and Function in Patients With Compression of the Optic Chiasm: A Correlation With Optical Coherence TomographyMRI Assessment of Optic Chiasm Compression. Investigative Ophthalmology & Visual Science 57:3884–3890, 2016 [DOI] [PubMed] [Google Scholar]
- 31.Plank T, Frolo J, Brandl-Ruhle S, Renner AB, Hufendiek K, Helbig H, et al. : Gray matter alterations in visual cortex of patients with loss of central vision due to hereditary retinal dystrophies. Neuroimage 56:1556–1565, 2011 [DOI] [PubMed] [Google Scholar]
- 32.Powell M: Recovery of vision following transsphenoidal surgery for pituitary adenomas. Br J Neurosurg 9:367–373, 1995 [DOI] [PubMed] [Google Scholar]
- 33.Qian H, Wang X, Wang Z, Wang Z, Liu P: Altered Vision-Related Resting-State Activity in Pituitary Adenoma Patients with Visual Damage. PLoS One 11:e0160119, 2016 [DOI] [PMC free article] [PubMed] [Google Scholar]
- 34.Rush SC, Kupersmith MJ, Lerch I, Cooper P, Ransohoff J, Newall J: Neuro-ophthalmological assessment of vision before and after radiation therapy alone for pituitary macroadenomas. 72:594, 1990 [DOI] [PubMed] [Google Scholar]
- 35.Rutland JW, Padormo F, Yim CK, Yao A, Arrighi-Allisan A, Huang KH, et al. : Quantitative assessment of secondary white matter injury in the visual pathway by pituitary adenomas: a multimodal study at 7-Tesla MRI. J Neurosurg:1–10, 2019 [DOI] [PMC free article] [PubMed] [Google Scholar]
- 36.Rutland JW, Schefflein J, Arrighi-Allisan AE, Ranti D, Ladner TR, Pai A, et al. : Measuring degeneration of the lateral geniculate nuclei from pituitary adenoma compression detected by 7T ultra-high field MRI: a method for predicting vision recovery following surgical decompression of the optic chiasm. J Neurosurg:1–10, 2019 [DOI] [PMC free article] [PubMed] [Google Scholar]
- 37.Schneider KA, Richter MC, Kastner S: Retinotopic organization and functional subdivisions of the human lateral geniculate nucleus: a high-resolution functional magnetic resonance imaging study. J Neurosci 24:8975–8985, 2004 [DOI] [PMC free article] [PubMed] [Google Scholar]
- 38.Song G, Qiu J, Li C, Li J, Gui S, Zhu H, et al. : Alterations of regional homogeneity and functional connectivity in pituitary adenoma patients with visual impairment. Scientific Reports 7:13074, 2017 [DOI] [PMC free article] [PubMed] [Google Scholar]
- 39.Sperandio I, Chouinard PA, Goodale MA: Retinotopic activity in V1 reflects the perceived and not the retinal size of an afterimage. Nature Neuroscience 15:540, 2012 [DOI] [PubMed] [Google Scholar]
- 40.Tokumaru AM, Sakata I, Terada H, Kosuda S, Nawashiro H, Yoshii M: Optic nerve hyperintensity on T2-weighted images among patients with pituitary macroadenoma: correlation with visual impairment. AJNR Am J Neuroradiol 27:250–254, 2006 [PMC free article] [PubMed] [Google Scholar]
- 41.Tur C, Goodkin O, Altmann DR, Jenkins TM, Miszkiel K, Mirigliani A, et al. : Longitudinal evidence for anterograde trans-synaptic degeneration after optic neuritis. Brain 139:816–828, 2016 [DOI] [PMC free article] [PubMed] [Google Scholar]
- 42.Wolf A, Coros A, Bierer J, Goncalves S, Cooper P, Uum SV, et al. : Quantitative evaluation of vision-related and health-related quality of life after endoscopic transsphenoidal surgery for pituitary adenoma. 127:409, 2017 [DOI] [PubMed] [Google Scholar]
- 43.Wu J, Yan T, Zhang Z, Jin F, Guo Q: Retinotopic mapping of the peripheral visual field to human visual cortex by functional magnetic resonance imaging. Hum Brain Mapp 33:1727–1740, 2012 [DOI] [PMC free article] [PubMed] [Google Scholar]
- 44.Yu L, Xie L, Dai C, Xie B, Liang M, Zhao L, et al. : Progressive thinning of visual cortex in primary open-angle glaucoma of varying severity. PLoS One 10:e0121960, 2015 [DOI] [PMC free article] [PubMed] [Google Scholar]
- 45.Zhang S, Wang B, Xie Y, Zhu S, Thomas R, Qing G, et al. : Retinotopic Changes in the Gray Matter Volume and Cerebral Blood Flow in the Primary Visual Cortex of Patients With Primary Open-Angle Glaucoma. Invest Ophthalmol Vis Sci 56:6171–6178, 2015 [DOI] [PubMed] [Google Scholar]