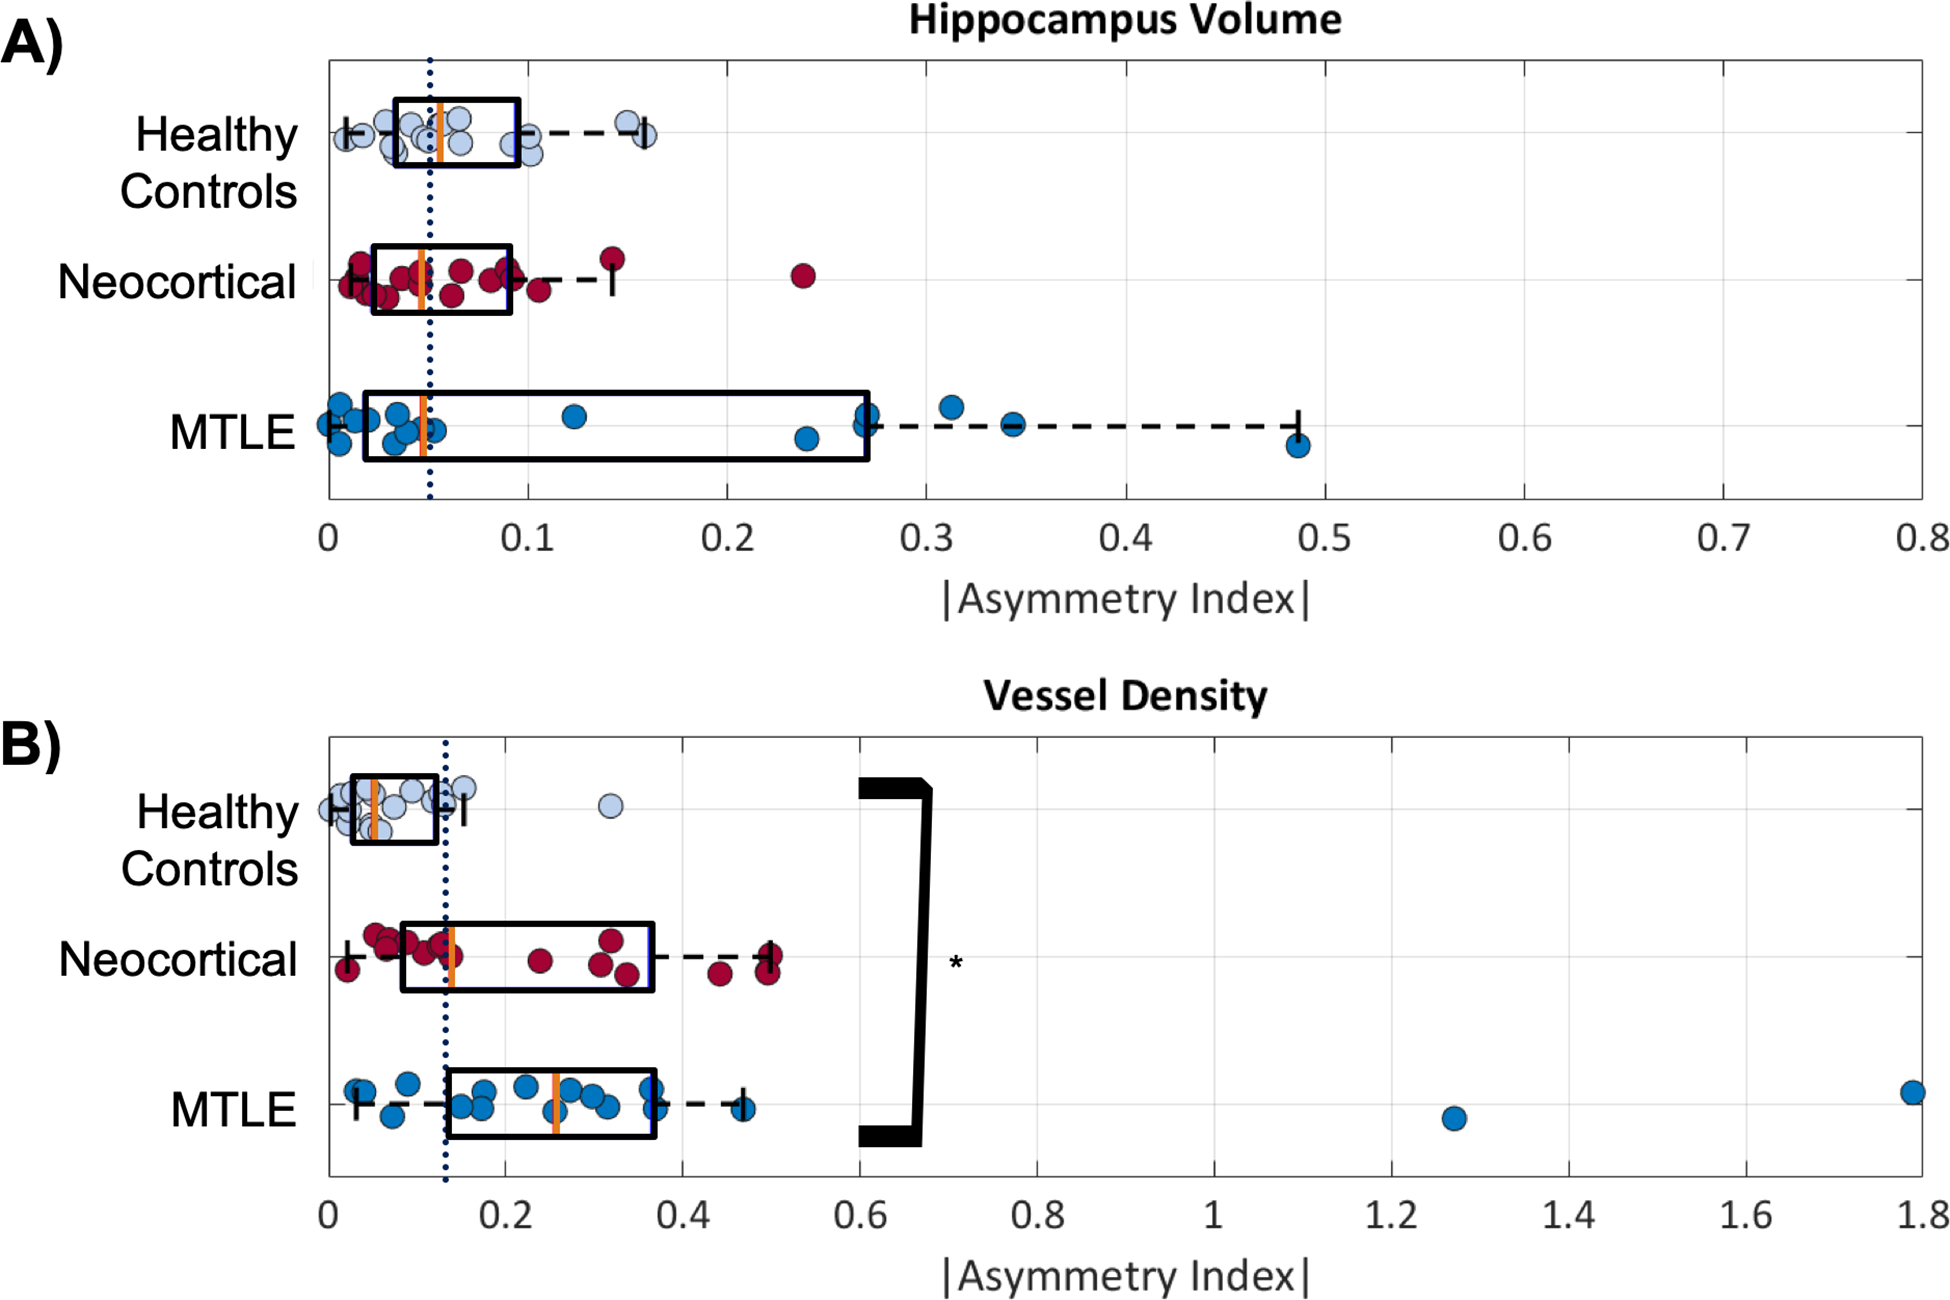
Figure 4:

Asymmetry of hippocampal volume and vessel density. The purple line in each figure represents the median value for all groups. A) The mean asymmetry of hippocampus volume is not significantly different between MTLE and neocortical patients and controls, although there is more variability in the epilepsy patients. B) The asymmetry in vessel density is significantly higher and MTLE than in controls (*) at p < 0.04. Median for each group is indicated with an orange bar.
