Abstract
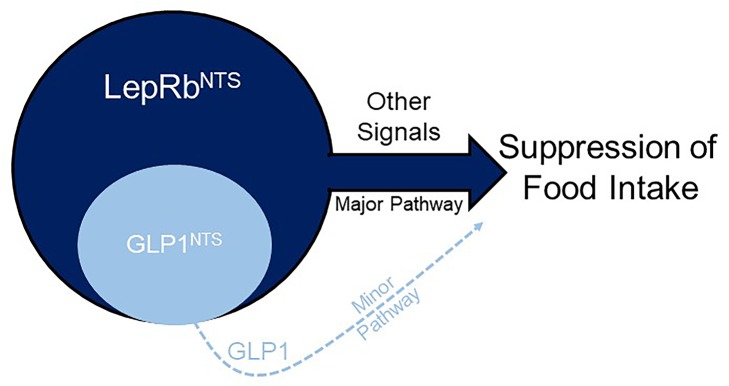
Leptin receptor–expressing (LepRb-expressing) neurons of the nucleus tractus solitarius (NTS; LepRbNTS neurons) receive gut signals that synergize with leptin action to suppress food intake. NTS neurons that express preproglucagon (Ppg) (and that produce the food intake–suppressing PPG cleavage product glucagon-like peptide-1 [GLP1]) represent a subpopulation of mouse LepRbNTS cells. Using Leprcre, Ppgcre, and Ppgfl mouse lines, along with Designer Receptors Exclusively Activated by Designer Drugs (DREADDs), we examined roles for Ppg in GLP1NTS and LepRbNTS cells for the control of food intake and energy balance. We found that the cre-dependent ablation of NTS Ppgfl early in development or in adult mice failed to alter energy balance, suggesting the importance of pathways independent of NTS GLP1 for the long-term control of food intake. Consistently, while activating GLP1NTS cells decreased food intake, LepRbNTS cells elicited larger and more durable effects. Furthermore, while the ablation of NTS Ppgfl blunted the ability of GLP1NTS neurons to suppress food intake during activation, it did not impact the suppression of food intake by LepRbNTS cells. While Ppg/GLP1-mediated neurotransmission plays a central role in the modest appetite-suppressing effects of GLP1NTS cells, additional pathways engaged by LepRbNTS cells dominate for the suppression of food intake.
Keywords: Endocrinology, Metabolism
Keywords: Leptin, Obesity, Peptides
While preproglucagon/GLP1-mediated neurotransmission plays a central role in modest appetite suppression, additional pathways engaged by leptin receptor-expressing neurons dominate the suppression of food intake.
Introduction
The nucleus tractus solitarius (NTS) of the caudal brainstem receives and integrates information from the gut and elsewhere in the periphery to inhibit food intake (1–3). Given the function of the adipose-derived signal of energy repletion, or leptin, in the control of energy balance and suggestions of important roles for leptin action in the NTS (1, 2, 4, 5), leptin receptor–expressing (LepRb-expressing) neurons of the NTS (LepRbNTS neurons) are of particular interest. Leptin augments the suppression of food intake by the vagal and/or hindbrain action of gut peptides (4, 6–8), and ablation of LepRb in the NTS of mice or rats increases meal size and tends to increase body weight, especially in animals fed a high-calorie diet (HCD) (9, 10). The mechanisms of action by which LepRbNTS neurons modulate feeding remain unclear, however.
Agonists for the glucagon-like peptide-1 receptor (GLP1R) act via the CNS to suppress food intake (11–13). The expression of preproglucagon (Ppg), which encodes the precursor peptide for GLP1 (as well as glucagon and GLP2), is restricted to the α cells in the pancreatic islets, L cells in the gut, and a small set of neurons in the hindbrain, primarily in the NTS (14). Because GLP1R agonists represent promising medical therapies to reduce food intake and treat obesity, a great deal of research has focused on defining the potential therapeutic utility of GLP1NTS cells and their downstream targets (15–17).
The early developmental ablation of Glp1r or Ppg in mice minimally alters energy balance or food intake (18–20), suggesting that the pharmacologic activation of the CNS GLP1R system likely suppresses food intake more effectively than does physiologic GLP1. Indeed, while exogenous GLP1R agonists strongly suppress food intake and body weight, inhibiting dipeptidyl peptidase-4 (DPP4) to block GLP1 degradation and raise endogenous GLP1 concentrations fails to decrease food intake (21, 22). Similarly, although the infusion of GLP1R agonists into several regions of the brain can decrease feeding, interference with endogenous GLP1 activity at sites within the CNS minimally alters food intake under normal conditions (11, 23–28). Several food intake–suppressing stressors (including large volume loads in the stomach and chronic variable stress) activate GLP1NTS cells, however, and interference with CNS GLP1 action or GLP1NTS cells attenuates the acute anorexic response to these stressors (17, 26). Thus, GLP1NTS cells may modulate food intake mainly in response to particularly strong or stressful stimuli.
While interfering with endogenous GLP1/GLP1R action minimally impacts food intake, the activation of GLP1NTS cells decreases feeding (16, 17), suggesting that the activation of these cells could provide a useful treatment for obesity. GLP1 could also contribute to the function of GLP1NTS and/or LepRbNTS cells. Here, we have investigated the suppression of food intake by GLP1NTS and LepRbNTS cells and determined the roles for GLP1 signaling in the suppression of food intake by these neuronal populations. We found that the activation of LepRbNTS neurons mediates the robust and durable suppression of food intake independently of GLP1 signaling. These findings reveal the dominance of GLP1-independent signals for the suppression of food intake by the NTS.
Results
Ablation of Ppg in the NTS fails to alter energy balance.
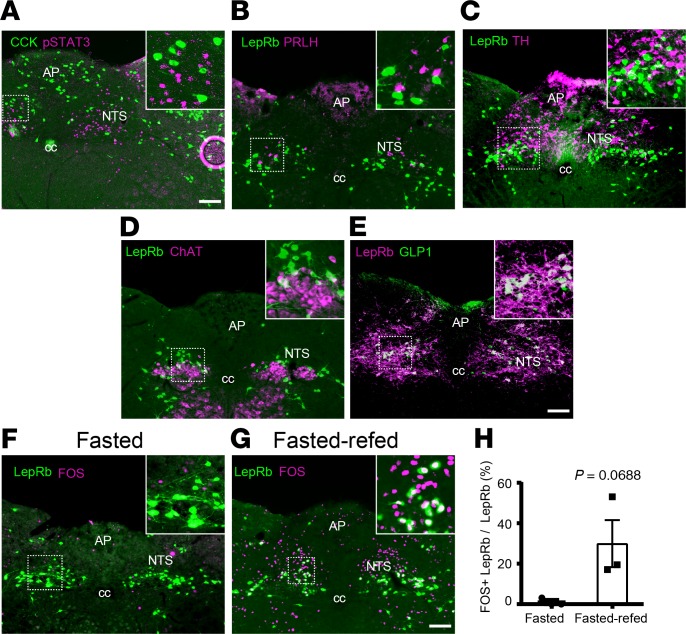
While LepRbNTS cells are distinct from NTS cells that express cholecystokinin (CCK), prolactin-releasing hormone (PRLH), tyrosine hydroxylase (TH) (Figure 1, A–C), and calcitonin receptor (29) and do not colocalize with cholinergic neurons of the adjacent dorsal motor nucleus of the vagus (DMV) (Figure 1D); GLP1NTS cells represent a subset of LepRbNTS cells (Figure 1E) (4, 6, 10). Because LepRbNTS cells tend to be activated by feeding (Figure 1, F–H) and are thought to synergize with gut signals that participate in the control of food intake (1, 2, 4, 5, 8) — and because GLP1R agonists act in the brain to suppress food intake (13) — we sought to understand the potential role for NTS GLP1 in the control of energy homeostasis by LepRbNTS and GLP1NTS cells.
Figure 1. Colocalization of neuronal markers with LepRbNTS neurons.
(A–D) Representative images showing LepRbNTS neurons (using leptin-induced pSTAT3-IR [A, purple] or GFP-IR in LepRbeGFP mice [B–D, green]) and CCK (GFP-IR in CCKeGFP mice; A, green), PRLH (B, purple), TH (C, purple), and choline acetyltransferase (ChAT, D, purple). (E) Representative image showing colocalization of NTS GLP1-IR (purple) with LepRb (mCherry-IR in AAVFlex-mCherry transduced Leprcre mice, green). All panels are representative of n ≥ 3 similar images. (F–H) LepRbeGFP mice were fasted overnight (F) or fasted overnight and then re-fed for 2 hours (G) before perfusion for the detection of LepRb (GFP, green) and FOS (purple). F and G show representative images (from n = 3 cases). (H) Colocalization of LepRb and FOS is shown. Data are shown as mean ± SEM; P value by unpaired 2-tailed t test is shown. AP, area postrema; cc, central canal. Scale bars: 150 μm.
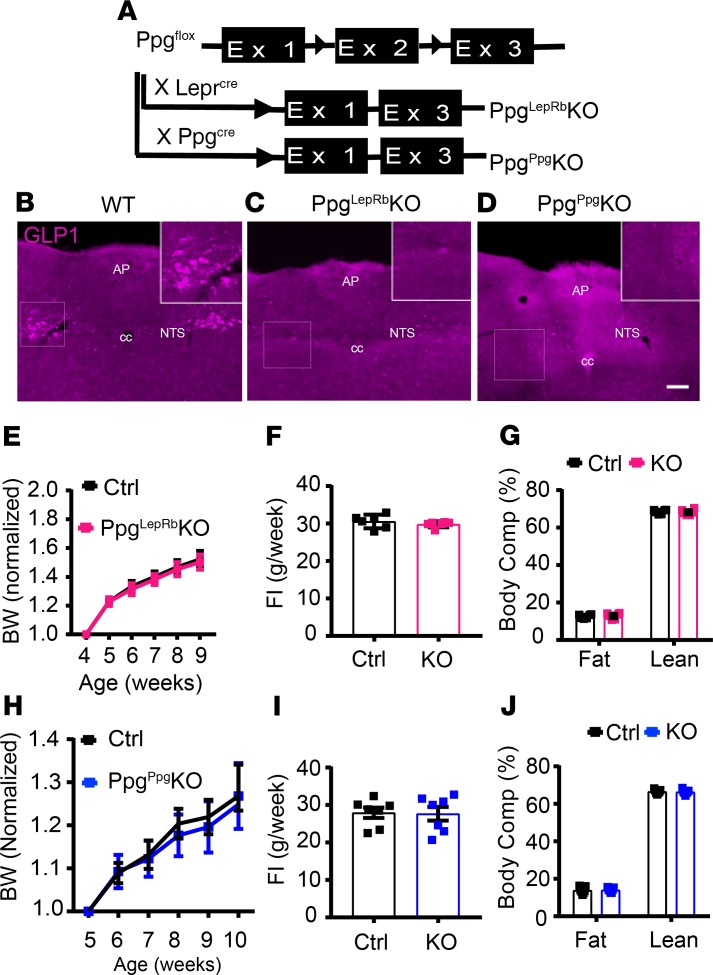
We ablated Ppg in the NTS by crossing Ppgfl onto the Leprcre or Ppgcre (a BAC transgenic mouse with an integration site remote from the endogenous Ppg locus and that demonstrates NTS-specific cre expression; ref. 16) backgrounds (Figure 2A). Leprcre/cre;Ppgfl/fl (PpgLepRbKO) mice demonstrated undetectable GLP1-immunoreactivity (GLP1-IR) in the NTS, as expected, since GLP1-containing NTS neurons in the mouse contain LepRb (Figure 1E and Figure 2, B and C) (6). Similarly, Ppgcre;Ppgfl/fl (PpgGLP1-NTSKO) animals exhibited no GLP1-IR in the NTS (Figure 2D). Note that, while most of our studies are not powered to detect sex differences, we have provided data broken down by sex in Supplemental Figures 1 and 2 (supplemental material available online with this article; https://doi.org/10.1172/jci.insight.134359DS1). Neither of these lines demonstrated altered body weight, food intake, or body composition compared with control animals at baseline, however (Figure 2, E–J, and Supplemental Figure 1, A–H), consistent with the lack of body weight changes in the Glp1-null mouse (20).
Figure 2. Ablation of Ppg in LepRbNTS and GLP1NTS neurons.
(A) Schematic diagram showing the cross of Ppgfl with Leprcre and Ppgcre mice to generate PpgLepRbKO and PpgGLP1-NTSKO (PpgppgKO) mice. (B–D) Representative images showing GLP1-IR (purple) in WT (B), PpgLepRbKO (C), and PpgppgKO mice (D). All panels are representative of n ≥ 3 similar images. (E–J) Body weight (measurements for each animal are normalized to its own baseline weight) (E and H), food intake (FI) from the 12th week of age (F and I), and body composition at approximately 16 weeks of age (G and J) are shown for PpgLepRbKO and PpgppgKO mice (data are from both sexes; data for each sex separately are shown in Supplemental Figure 1, A–H). Data are shown as mean ± SEM; n = 11–19 (E), n = 6 (G and F), n = 7 (H–J). All comparisons not significant using 2-way ANOVA with Sidak’s multiple comparisons test (E and H) or unpaired 2-tailed t test (F, G, I, and J). AP, area postrema; cc, central canal. Scale bars: 150 μm.
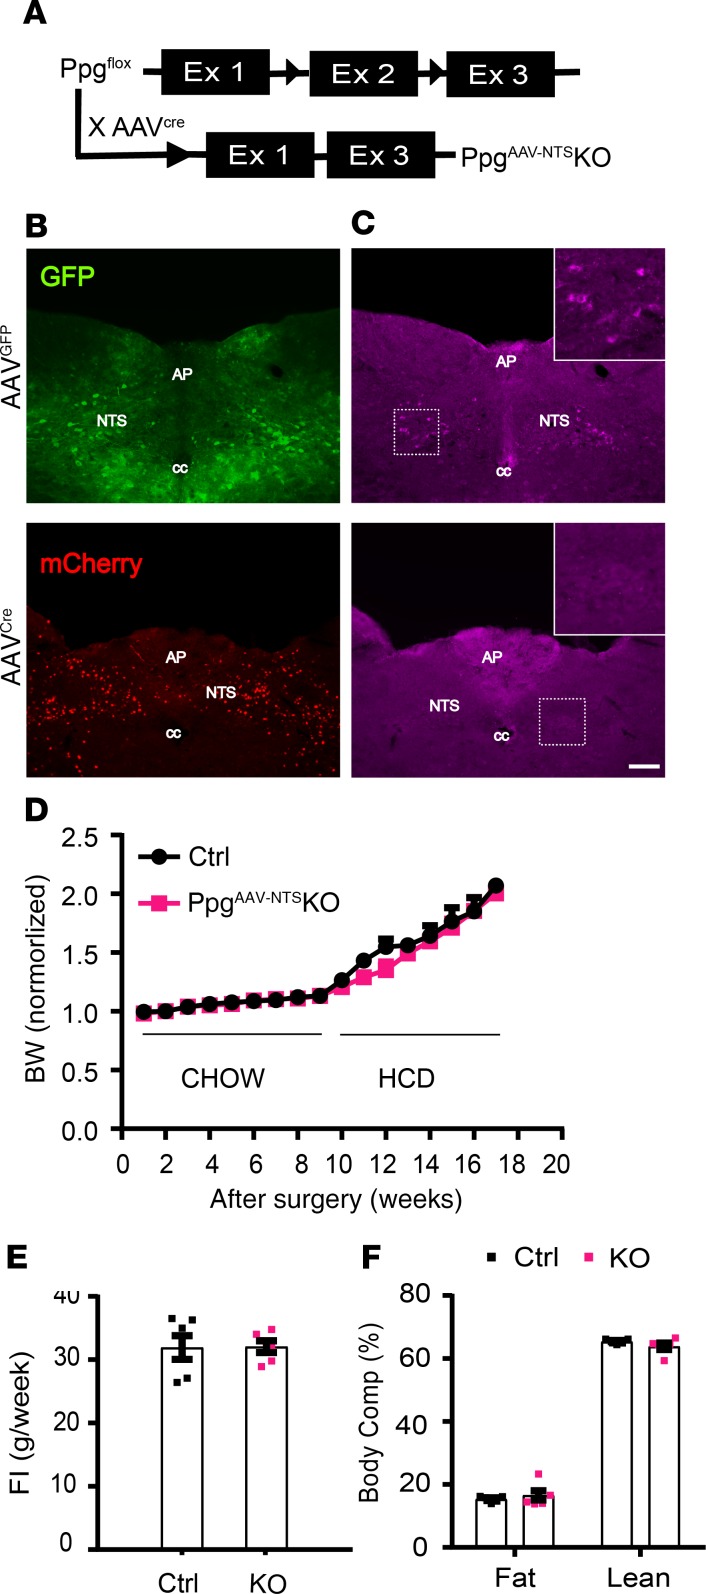
Adult ablation of NTS Ppg in rats can alter food intake and energy balance (30), suggesting that early developmental ablation of Ppg or Glp1r might provoke developmental compensation that could mask a potential phenotype due to the loss of Ppg in the NTS. Thus, we also ablated Ppg in adult (8–12 weeks of age) mice by the bilateral injection of an mCherry-tagged AAVcre into the NTS of Ppgfl/fl mice (PpgAAV-NTSKO mice) (Figure 3A). As a control, we injected AAVGFP bilaterally into the NTS of littermate mice. As expected, the injection of AAVcre, but not AAVGFP, into the NTS ablated GLP1-IR in PpgAAV-NTSKO mice (Figure 3, B and C). Although we studied these mice for 9 weeks on chow diet and an additional 8 weeks on HCD, PpgAAV-NTSKO mice displayed no alterations in body weight, food intake, or body composition compared with their controls (Figure 3, D–F, and Supplemental Figure 1I). Thus, the ablation of GLP1 from the NTS in adult mice, as during development, does not detectably alter energy balance.
Figure 3. Viral-mediated Ppg KO in the NTS.
(A) Schematic diagram showing deletion of NTS Ppg by delivering mCherry-tagged AAVcre (AAVcre-mCherry) into the NTS of Ppgfl mice. (B and C) Representative images of GFP-IR in mice injected with AAVGFP (top panel, green) or mCherry-IR in AAVcre-mCherry (bottom panel, red) (B); GLP1-IR (purple) for similar mice is shown in C. All panels are representative of n ≥ 10 similar images. (D) Weekly body weight change on chow and HFD (measurements for each animal were normalized to its baseline weight). (E and F) Food intake is shown for the 8th week after surgery (E), and body composition is shown for 2 months after surgery (F). Data are from male animals; female body weight data are shown in Supplemental Figure 1I. Data are shown as mean ± SEM; D (n = 11–13), E (n = 6) and F (n = 5). All comparisons, P > 0.05 using repeated measures 2-way ANOVA with Sidak’s multiple comparisons test (D) and 2-tailed unpaired t test (E and F). AP, area postrema; cc, central canal. Scale bar: 150 μm.
LepRbNTS neurons suppress food intake more effectively than GLP1NTS neurons.
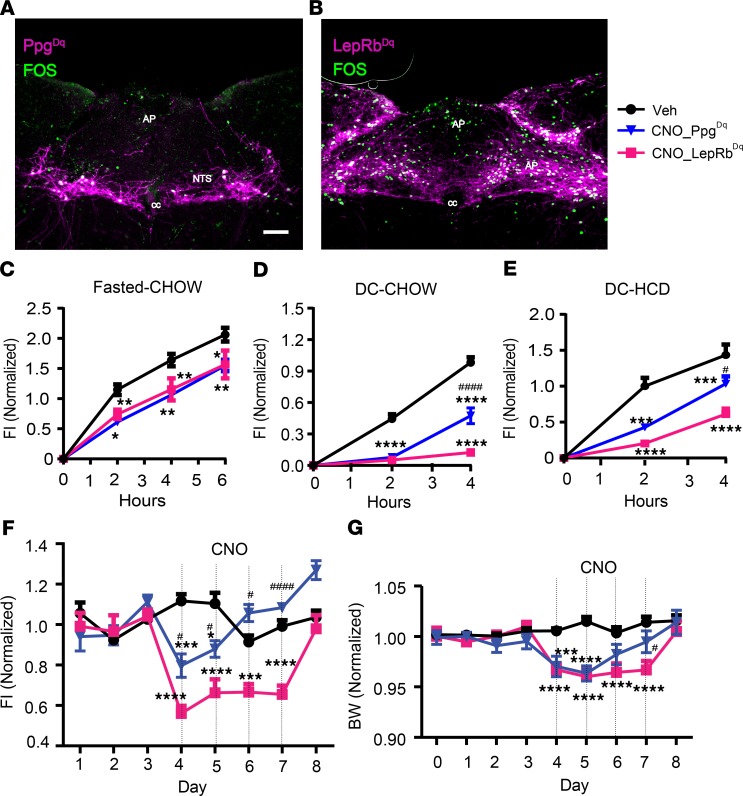
To compare the food intake–suppressing potential of GLP1NTS and LepRbNTS neurons, we bilaterally injected AAVFlex-Dq into the NTS of Ppgcre or Leprcre mice to cre-dependently express the Gq-coupled (activating, hM3Dq) Designer Receptors Exclusively Activated by Designer Drugs (DREADD) in GLP1NTS and LepRbNTS cells (LepRbNTS-Dq and GLP1NTS-Dq mice, respectively). DREADD-hM3Dq expression in neurons permits their activation by the injection of clozapine N-oxide (CNO) (which is metabolized to produce the DREADD ligand) (31, 32). We used the post hoc detection of mCherry (which is fused to hM3Dq in AAVFlex-hM3Dq) and FOS-IR to ensure that we analyzed only mice with robust bilateral NTS hM3Dq expression. As expected, CNO promoted FOS accumulation in mCherry-expressing cells of the NTS in both lines (Figure 4, A and B).
Figure 4. Activation of LepRbNTS or GLP1NTS neurons suppressed food intake and body weight.
(A and B) Representative images of DREADD-hM3Dq-mCherry (purple) and FOS-IR (green) in CNO-treated (1 mg/kg i.p., 2 hours) Ppgcre (A) and Leprcre (B) mice subjected to the injection of AAVhM3Dq into the GLP1NTS-Dq (PpgDq) and LepRbNTS-Dq (LepRbDq) mice, respectively. All panels are representative of n ≥ 3 similar images. AP, area postrema; cc, central canal. Scale bar: 150 μm. (C–E) Food intake following vehicle (Veh) or CNO (1 mg/kg i.p.) treatment of PpgDq and LepRbDq mice during refeeding following a fast (C; n = 5 and 8 in PpgDq and LepRbDq groups, respectively) or at the onset of the dark cycle (DC) on normal chow (D, n = 13 and 20 in PpgDq and LepRbDq groups, respectively) or HFD (E, n = 6 and 5 PpgDq and LepRbDq groups, respectively). (F and G) Daily food intake (F) and body weight relative to baseline (G) (n = 5–6 [F], 11–13 [G] in PpgDq and LepRbDq groups, respectively) during multiday treatment with CNO (1 mg/kg, i.p., bid). Data are from both sexes; for data separated by sex, see Supplemental Figure 1, J–N. Data are shown as mean ± SEM. Two-way ANOVA with Tukey’s multiple comparisons test was performed for each time point in each panel; *P < 0.05, **P < 0.01, ***P < 0.001, ****P < 0.0001 for CNO groups compared with vehicle. #P < 0.05, ####P < 0.0001 for comparisons between CNO groups. Scale bar: 150 μm.
We examined the ability of CNO injection to acutely suppress food intake following an overnight fast and at the onset of the dark cycle with exposure to normal chow or HCD (Figure 4, C–E, and Supplemental Figure 1, J–L). We found that the activation of GLP1NTS or LepRbNTS cells similarly reduced food intake over the first 6 hours following an overnight fast. While the activation of GLP1NTS or LepRbNTS cells both almost entirely abrogated food intake for the first 2 hours at the onset of the dark cycle, by 4 hours, the food intake–suppressing effect of GLP1NTS neuron activation attenuated substantially compared with LepRbNTS cells. For animals provided with HCD at the onset of the dark cycle, the activation of LepRbNTS cells suppressed food intake more effectively than did the activation of GLP1NTS neurons at all time points. Thus, the acute activation of LepRbNTS cells suppresses food intake more effectively and more durably than does the activation of GLP1NTS cells.
We also examined the long-term suppression of food intake and body weight in LepRbNTS-Dq and GLP1NTS-Dq mice subjected to twice-daily injections of CNO over 4 days (Figure 4, F and G, and Supplemental Figure 1, M and N). For LepRbNTS-Dq mice, this resulted in a sustained, approximately 50% decrease in food intake for all 4 days of the treatment, resulting in the maintenance of an approximately 5% weight loss for the duration of the treatment. In contrast, this prolonged CNO treatment of GLP1NTS-Dq mice detectably decreased food intake (by ~25%) only for the first day of treatment — after which, food intake and body weight reverted to baseline, despite ongoing CNO administration. Thus, LepRbNTS cells provoke a stronger and longer-lasting anorectic response compared with GLP1NTS cells, consistent with the larger number of LepRbNTS cells compared with GLP1NTS neurons.
Ppg ablation attenuates the suppression of food intake by GLP1NTS neurons.
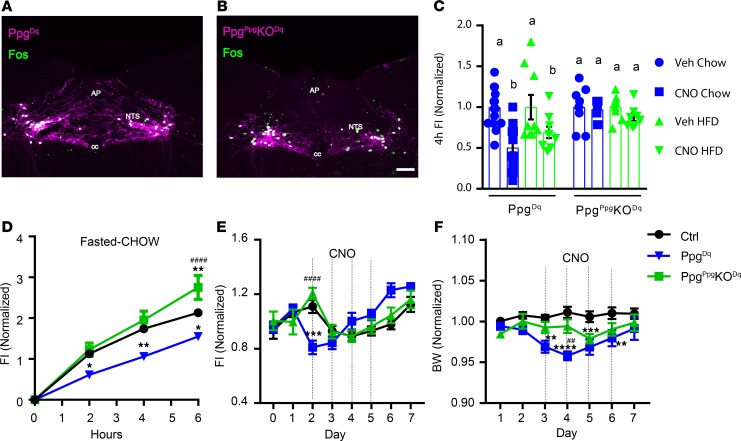
To determine the potential role for GLP1 in the suppression of food intake by GLP1NTS neurons, we bilaterally injected the cre-inducible AAVFlex-Dq into either Ppgcre or PpgGLP1-NTSKO (PpgGLP1-NTSKO–Dq) mice and examined their response to CNO (Figure 5). While CNO promoted the accumulation of FOS in the NTS of both GLP1NTS-Dq and PpgGLP1-NTSKO–Dq mice (Figure 5, A and B), CNO failed to decrease food intake in PpgGLP1-NTSKO–Dq mice following an overnight fast or at the onset of the dark cycle in mice fed chow or HCD (Figure 5, C and D, and Supplemental Figure 2, A and B). Similarly, CNO failed to decrease body weight in PpgGLP1-NTSKO–Dq mice (Figure 5, E and F, and Supplemental Figure 2, C and D). Thus, in the absence of GLP1, other neurotransmitters that are expressed in GLP1NTS cells are insufficient to mediate the suppression of food intake; GLP1 is required for the suppression of food intake by GLP1NTS neurons.
Figure 5. GLP1NTS neurons require Ppg to mediate the suppression of food intake.
Representative images of DREADD-hM3Dq-mCherry (purple) and FOS-IR (green) in CNO-treated (1 mg/kg i.p., 2 hours) Ppgcre (A) and PpgGLP1-NTSKO (PpgPpgKO) (B) mice subjected to the injection of AAVhM3Dq into the NTS (Ppg-Dq and PpgPpgKO-Dq mice, respectively). All panels are representative of n ≥ 3 similar images. AP, area postrema; cc, central canal. Scale bars: 150 μm. (C) Food intake in Ppg-Dq and PpgPpgKO-Dq mice during the first 4 hours of the dark cycle with chow or HFD, as indicated; n = 19 (chow) or 9 (HFD) in Ppg-Dq and n = 8 (both chow and HFD) in PpgPpgKO-Dq groups. (D) Food intake in vehicle-treated (Veh-treated) or CNO-treated (1 mg/kg i.p.) Ppg-Dq and PpgPpgKO-Dq mice following an overnight fast; n = 13, 5, and 8 in Veh, Ppg-Dq, and PpgPpgKO-Dq groups, respectively. (E and F) Daily food intake (E) and body weight (F) relative to baseline during multiday treatment with CNO (1 mg/kg, i.p., bid); n = 10, 8, and 8 in Veh, Ppg-Dq, and PpgPpgKO-Dq groups, respectively. Data are from both sexes; for data separated by sex, see Supplemental Figure 2, A–D. Data are shown as mean ± SEM. Two-way ANOVA with Sidak’s multiple comparisons test was performed for chow and HCD conditions (separately) in C. Two-way ANOVA with Tukey’s multiple comparisons test was performed for D–F. Different letters indicate difference (P < 0.05) in C. (D–F) *P < 0.05, **P < 0.01, ***P < 0.001, ****P < 0.0001 versus Veh. ##P < 0.01, ####P < 0.0001 for Ppg-Dq versus PpgPpgKO-Dq.
Ppg expression contributes minimally to the suppression of food intake by LepRbNTS neurons.
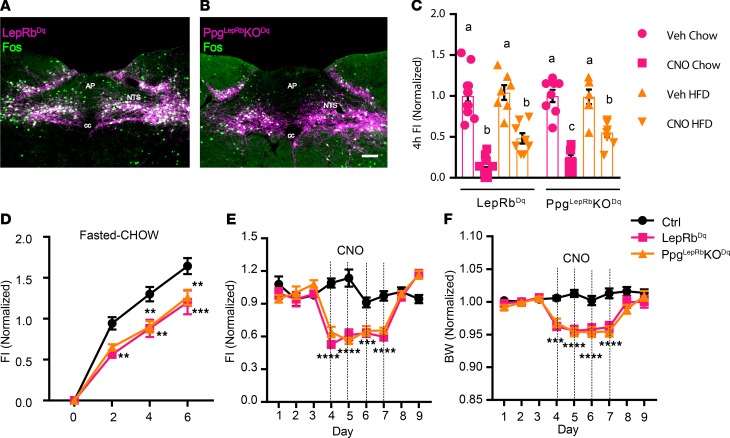
To understand the potential contribution of GLP1 signaling to food intake suppression by LepRbNTS cells, we bilaterally injected the cre-inducible AAVFlex-Dq into either Leprcre or PpgLepRbKO (PpgLepRbKO-Dq) mice and examined their response to CNO treatment (Figure 6). As expected, CNO stimulated FOS-IR in the NTS of both LepRbNTS-Dq and PpgLepRbKO-Dq mice (Figure 6, A and B). Unlike the absent food intake suppression observed in PpgGLP1-NTSKO–Dq mice, however, CNO stimulated similar suppression of food intake in PpgLepRbKO-Dq and LepRbNTS-Dq mice (Figure 6, C–F, and Supplemental Figure 2, E–H). There was no difference in food intake suppression between LepRbNTS-Dq and PpgLepRbKO-Dq following an overnight fast or in HCD feeding at the onset of the dark cycle (although there was a small attenuation of food intake suppression in chow-fed PpgLepRbKO-Dq mice at the onset of the dark cycle). Furthermore, there was no difference between LepRbNTS-Dq and PpgLepRbKO-Dq mice in the ability of CNO to decrease food intake and body weight during 4 days of twice-daily CNO treatment. Thus, while GLP1 is required for the suppression of food intake by GLP1NTS cells, and GLP1NTS cells represent a subset of LepRbNTS cells, GLP1 is not required for the suppression of food intake by LepRbNTS cells. Thus, GLP1-independent pathways dominate over GLP1 for the suppression of food intake by the NTS.
Figure 6. NTS Ppg is not required for the suppression of food intake by LepRbNTS neurons.
Representative images of DREADD-hM3Dq-mCherry (purple) and FOS-IR (green) in CNO-treated (1 mg/kg i.p., 2 hours) Leprcre (A) and PpgLepRbKO (B) mice subjected to the injection of AAVhM3Dq into the NTS (LepRbNTS-Dq and PpgLepRbKO-Dq mice, respectively). All panels are representative of n ≥ 3 similar images. AP, area postrema; cc, central canal. Scale bars: 150 μm. (C) Food intake in LepRbNTS-Dq and PpgLepRbKO-Dq mice during the first 4 hours of the dark cycle with Chow or HFD, as indicated; n = 14 (chow) or 8 (HFD) in Ppg-Dq groups, n = 8 (both chow and HFD) in PpgLepRbKO-Dq groups. (D) Food intake in vehicle-treated (Veh-treated) or CNO-treated (1 mg/kg i.p.) LepRbNTS-Dq and PpgLepRbKO-Dq mice following an overnight fast; n = 7, 11, and 8 in Veh, LepRbNTS-Dq, and PpgLepRbKO-Dq groups, respectively. (E and F) Daily food intake (E) and body weight relative to baseline (F) during multiday treatment with CNO (1 mg/kg, i.p., bid); n = 12, 13, and 9 in Veh, LepRbNTS-Dq, and PpgLepRbKO-Dq groups, respectively. Data are from both sexes; for data separated by sex, see Supplemental Figure 2, E–H. Data are shown as mean ± SEM. Two-way ANOVA with Sidak’s multiple comparisons was performed for chow and HCD conditions (separately) in C. Two-way ANOVA analysis with Tukey’s multiple comparisons test was performed for D–F. Different letters indicate difference (P < 0.05) in C. (D–F) **P < 0.01, ***P < 0.001, ****P < 0.0001 versus Veh.
Discussion
Our data reveal that, despite the lack of effect of NTS Ppg ablation on energy balance in mice, Ppg is required for the suppression of food intake mediated by the activation of mouse GLP1NTS cells. However, GLP1NTS cells represent a subset of mouse LepRbNTS cells. Furthermore, LepRbNTS cells more strongly and durably inhibit food intake than GLP1NTS cells, while Ppg does not meaningfully contribute to the suppression of food intake by LepRbNTS cells. Thus, non–Ppg-derived neurotransmitters in the non-GLP1NTS subpopulation of LepRbNTS cells dominate over GLP1-derived signals for the suppression of feeding.
The DREADD-mediated activation of NTS neuronal populations, which we have employed here, provides a robust assay for the function of these cell types and the mechanisms by which they alter feeding behavior. LepRbNTS cells are acætivated by acute refeeding, suggesting that they receive inputs from the gut (e.g., via the vagus and/or gut peptides) as previously proposed (8) and that the activation of these cells mimics the postprandial function of them. While these represent pharmacologic manipulations designed to test the functional output of maximally activating a cell type/circuit, our findings that LepRbNTS and non-GLP1 signals play a more prominent role in food intake suppression than GLP1 and GLP1NTS neurons are consistent with findings that interfering with endogenous GLP1/GLP1R action (18–20) minimally alters food intake and energy balance, while interfering with leptin action via LepRbNTS cells increases food intake and body weight (10, 33).
Because endogenous GLP1 contributes relatively little to the control of food intake and body weight while pharmacologic GLP1R agonists effectively suppress food intake and body weight, it is possible that pharmacologic GLP1R agonists may act via different mechanisms than endogenous NTS GLP1. For instance, peripherally administered GLP1R agonists may act via brain structures that are more accessible to the circulation. Indeed, the finding that glutamatergic Glp1r neurons distinct from several hypothalamic populations of Glp1r neurons mediate the anorectic effect of liraglutide suggests that Glp1r neurons in the area postrema (AP) may mediate this effect of GLP1R agonists (12, 13, 28). In contrast, the minimal AP FOS-IR following DREADD-mediated activation of GLP1NTS neurons suggests that these cells contribute little (if at all) to the activation of AP GLP1R cells. Thus, the neural targets for peripherally applied pharmacologic GLP1R agonism likely differ from those engaged by NTS-derived GLP1.
Importantly, however, our data do not rule out the possibility of changes in meal size or frequency resulting from the ablation of Ppg in the NTS. While we have not examined a potential role for NTS Ppg or GLP1NTS cells in glucose homeostasis, the DREADD-mediated inhibition of LepRbNTS cells failed to alter glucose tolerance (Supplemental Figure 3). In the future, it will be interesting to examine the long-term effects of inhibiting these cells.
Interestingly, the NTS Ppg system in rats may differ in important ways from that of the mouse. For instance, interfering (postnatally) with endogenous CNS GLP1/GLP1R signaling in the rat increases food intake and body weight (30). While GLP1NTS cells represent a subset of LepRbNTS cells in the mouse, GLP1- and LepRb-containing cells are distinct in the rat NTS. Thus, because interfering with leptin action on rat LepRbNTS neurons also increases food intake and body weight, non-GLP1 NTS neurotransmitters in rat LepRbNTS cells participate in the control of food intake and energy balance, as in the mouse. The fact that non-GLP1 neurotransmitters must mediate substantial components of the NTS-mediated control of food intake and energy balance suggests the importance of understanding roles for NTS neurotransmitters other than GLP1 for the control of food intake. In the future, it will be important to identify the non-GLP1 neurotransmitters by which LepRbNTS cells contribute to the control of food intake and body weight, and to compare these across species.
Methods
Animals.
Mice were bred in our colony in the Unit for Laboratory Animal Medicine at the University of Michigan. Mice were bred at the University of Michigan and provided with food (standard chow diet [Purina Lab Diet, 5001] or HCD [Research Diets, D12492, 60% from fat]) and water ad libitum (except as noted below) in temperature-controlled rooms on a 12-hour light-dark cycle.
We purchased male and female C57BL/6 mice for use in experiments and breeding from the Jackson Laboratory. Leprcre, Ppgcre, and Ppgfl mice have been described (16, 20, 34, 35) and were propagated by intercrossing homozygous mice of the same genotype. Cckcre mice were purchased from the Jackson Laboratory (stock no. 012706). Leprcre and Cckcre were bred to the Rosa26eGFP-L10a background (36) to generate LepRbeGFP and CckeGFP reporter lines, respectively.
Ppgfl mice were crossed twice onto the Leprcre or Ppgcre background to generate Leprcre/cre;Ppgfl/+ or Ppgcre;Ppgfl/+ animals, which were intercrossed to generate PpgLepRbKO and PpgPpg-NTSKO, respectively, and littermate control mice. For all studies, animals were processed in the order of their ear tag number, which was randomly assigned at the time of tailing (before genotyping).
Viral reagents and stereotaxic injections.
AAVFlex-hM3Dq (31), AAVGFP, and AAVcre-mCherry (37) were generated as previously described and were prepared by the University of North Carolina Vector Core (Chapel Hill, North Carolina, USA) and the University of Michigan Vector Core.
For injections, following the induction of isoflurane anesthesia and placement in a stereotaxic frame, the skulls of adult Leprcre/cre, PpgLepRbKO, Ppgcre/cre, PpgPpg-NTSKO, or Ppgfl/fl mice were exposed. The obex was set as reference point for injection. After the reference was determined, a guide cannula with a pipette injector was lowered into the approximate NTS coordinates, which was anterior/posterior, –0.2; medial/lateral, ±0.2; dorsal/ventral, –0.2 from the obex, and 100 nL of virus was injected by using a picospritzer at a rate of 5–30 nL/minutes with pulses. Five minutes following injection, to allow for adequate dispersal and absorption of the virus, the injector was removed from the animal; the incision site was closed and glued. The mice received prophylactic analgesics before and after surgery. The mice injected with AAVFlex-hM3Dq and their control were allowed at least 3 weeks to recover from surgery before experimentation.
For the viral KO, we performed post hoc IHC to examine the expression of the viral reporter and GLP1-IR. Animals with robust bilateral reporter expression (and lack of GLP1-IR for the KOs) were deemed hits; other animals were excluded from analysis. For the DREADD studies, we examined reporter expression and FOS-IR following CNO administration and perfusion at the time of euthanasia. Animals with robust bilateral reporter expression and FOS-IR were considered hits; other animals were excluded from analysis.
Phenotypic studies.
Animals were singly housed from the time of weaning (PpgLepRbKO and PpgPpg-NTSKO) or beginning 7 days after surgery (PpgAAV-NTSKO). Food intake and body weight were monitored weekly.
For stimulation studies, KO mice, DREADD-expressing mice, or their controls that were either at least 2 months old or 1 month past surgery, and they were treated with saline or CNO (4936, Tocris) at the onset of dark cycle; subsequent food intake was monitored. For chronic food intake and body weight changes, mice were treated with saline (i.p., bid) for 2–3 days prior to injecting saline or CNO (1 mg/kg, i.p., bid) for 4 days (injections were given at ~5:30 p.m. and ~8 a.m.). Mice were subsequently subjected to saline injections for another 2–3 days to monitor recovery.
Perfusion and IHC.
Mice were anesthetized with isoflurane and transcardially perfused with PBS followed by 10% buffered formalin. Brains were removed, placed in 10% buffered formalin overnight, and dehydrated in 30% sucrose for 1 week. With use of a freezing microtome (Leica), brains were cut into 30-μm sections. Sections were treated sequentially with 1% hydrogen peroxide/0.5% sodium hydroxide, 0.3% glycine, 0.03% sodium dodecyl sulfate, and blocking solution (PBS with 0.1% triton, 3% normal donkey serum; MilliporeSigma). The sections were incubated overnight at room temperature in rabbit anti-pSTAT3 (Cell Signaling Technology, 9145L; 1: 250) and exposed the next day with either biotinylated (1:200 followed by avidin-biotin complex [ABC] amplification and DAB reaction) or fluorescent secondary antibody (Molecular Probes, 1:200) to visualize proteins. Immunofluorescent staining was performed using primary antibodies (FOS, 2250, Cell Signaling Technology; dsRed, 632496, Takara, 1:1000; GLP1, T-4363.0050, Peninsula Laboratories International Inc., 1:1000; TH, NB300-109, Novus Biologicals, 1:1000; choline acetyltransferase, AB144P, MilliporeSigma, 1:500; and prolactin-releasing peptide, H-008-52, Phoenix Pharmaceuticals, 1:1000); antibodies were reacted with species-specific Alexa Fluor–488, –568, or –647 conjugated secondary antibodies (Thermo Fisher Scientific, 1:200). Images were collected on an Olympus BX53F microscope. Images were pseudocolored using Photoshop software (Adobe) or Image J (NIH).
Statistics.
Data are reported as mean ± SEM. Statistical analyses of physiologic data were performed with Prism software (version 7). Two-way ANOVA, or paired or unpaired 2-tailed t tests, were used as indicated in the text and figure legends; P < 0.05 was considered statistically significant.
Study approval.
The animal procedures performed were approved by the University of Michigan Committee on the Use and Care of Animals in accordance with Association for the Assessment and Approval of Laboratory Animal Care and NIH guidelines.
Author contributions
WC, EN, CH, KR, AM, BK, JM, and KSK researched and analyzed data and proofread the manuscript. WC, DPO, RJS, DS, CJR, and MGM designed experiments and wrote and edited the manuscript. MGM is the guarantor of the manuscript.
Supplementary Material
Acknowledgments
We thank members of the Myers, Olson, and Seeley & Sandoval Labs for helpful discussions. Research support was provided by the Michigan Diabetes Research Center (NIH P30 DK020572, including the Molecular Genetics and Animal Studies Cores), the American Diabetes Association (1-16-PDF-021 to WC), the Marilyn H. Vincent Foundation (to MGM), and MedImmune LLC/AstraZenica (to MGM). This work was also supported in part by NIH awards DK117821 (to MGM, RJS, DAS, DPO), DK082480 (to DAS), and DK104999 (to DPO) and by research support from Boehringer Ingelheim (DAS, RJS), Ethicon Endo-Surgery Inc. (DAS, RJS), Sanofi (RJS), and Novo Nordisk A/S (DAS, RJS).
Version 1. 03/17/2020
In-Press Preview
Version 2. 04/09/2020
Electronic publication
Footnotes
Conflict of interest: CJR is an employee of AstraZenica LLC.
Copyright: © 2020, American Society for Clinical Investigation.
Reference information: JCI Insight. 2020;5(7):e134359.https://doi.org/10.1172/jci.insight.134359.
Contributor Information
Wenwen Cheng, Email: wenwenc@umich.edu.
Ermelinda Ndoka, Email: ermndoka@umich.edu.
Karen Roelofs, Email: rkjaz@sbcglobal.net.
Andrew MacKinnon, Email: Andrew.F.MacKinnon.6@nd.edu.
Basma Khoury, Email: khouryb@med.umich.edu.
Christopher J. Rhodes, Email: rhodesc@MedImmune.com.
David P. Olson, Email: dpolson@med.umich.edu.
Randy J. Seeley, Email: seeleyrj@med.umich.edu.
Martin G. Myers, Jr., Email: mgmyers@umich.edu.
References
- 1.Schwartz GJ. Integrative capacity of the caudal brainstem in the control of food intake. Philos Trans R Soc Lond, B, Biol Sci. 2006;361(1471):1275–1280. doi: 10.1098/rstb.2006.1862. [DOI] [PMC free article] [PubMed] [Google Scholar]
- 2.Grill HJ, Hayes MR. The nucleus tractus solitarius: a portal for visceral afferent signal processing, energy status assessment and integration of their combined effects on food intake. Int J Obes (Lond) 2009;33(Suppl_1):S11–S15. doi: 10.1038/ijo.2009.10. [DOI] [PubMed] [Google Scholar]
- 3.Berthoud HR. Interactions between the “cognitive” and “metabolic” brain in the control of food intake. Physiol Behav. 2007;91(5):486–498. doi: 10.1016/j.physbeh.2006.12.016. [DOI] [PubMed] [Google Scholar]
- 4.Huo L, Maeng L, Bjørbaek C, Grill HJ. Leptin and the control of food intake: neurons in the nucleus of the solitary tract are activated by both gastric distension and leptin. Endocrinology. 2007;148(5):2189–2197. doi: 10.1210/en.2006-1572. [DOI] [PubMed] [Google Scholar]
- 5.Morton GJ, et al. Leptin action in the forebrain regulates the hindbrain response to satiety signals. J Clin Invest. 2005;115(3):703–710. doi: 10.1172/JCI22081. [DOI] [PMC free article] [PubMed] [Google Scholar]
- 6.Huo L, Gamber KM, Grill HJ, Bjørbaek C. Divergent leptin signaling in proglucagon neurons of the nucleus of the solitary tract in mice and rats. Endocrinology. 2008;149(2):492–497. doi: 10.1210/en.2007-0633. [DOI] [PMC free article] [PubMed] [Google Scholar]
- 7.Hayes MR, et al. Endogenous Leptin Signaling in the Caudal Nucleus Tractus Solitarius and Area Postrema Is Required for Energy Balance Regulation. Cell Metab. 2016;23(4):744. doi: 10.1016/j.cmet.2016.02.009. [DOI] [PubMed] [Google Scholar]
- 8.Williams DL, Baskin DG, Schwartz MW. Hindbrain leptin receptor stimulation enhances the anorexic response to cholecystokinin. Am J Physiol Regul Integr Comp Physiol. 2009;297(5):R1238–R1246. doi: 10.1152/ajpregu.00182.2009. [DOI] [PMC free article] [PubMed] [Google Scholar]
- 9.De Jonghe BC, Hayes MR, Zimmer DJ, Kanoski SE, Grill HJ, Bence KK. Food intake reductions and increases in energetic responses by hindbrain leptin and melanotan II are enhanced in mice with POMC-specific PTP1B deficiency. Am J Physiol Endocrinol Metab. 2012;303(5):E644–E651. doi: 10.1152/ajpendo.00009.2012. [DOI] [PMC free article] [PubMed] [Google Scholar]
- 10.Scott MM, Williams KW, Rossi J, Lee CE, Elmquist JK. Leptin receptor expression in hindbrain Glp-1 neurons regulates food intake and energy balance in mice. J Clin Invest. 2011;121(6):2413–2421. doi: 10.1172/JCI43703. [DOI] [PMC free article] [PubMed] [Google Scholar]
- 11.Cork SC, Richards JE, Holt MK, Gribble FM, Reimann F, Trapp S. Distribution and characterisation of Glucagon-like peptide-1 receptor expressing cells in the mouse brain. Mol Metab. 2015;4(10):718–731. doi: 10.1016/j.molmet.2015.07.008. [DOI] [PMC free article] [PubMed] [Google Scholar]
- 12.Adams JM, et al. Liraglutide Modulates Appetite and Body Weight Through Glucagon-Like Peptide 1 Receptor-Expressing Glutamatergic Neurons. Diabetes. 2018;67(8):1538–1548. doi: 10.2337/db17-1385. [DOI] [PMC free article] [PubMed] [Google Scholar]
- 13.Sisley S, Gutierrez-Aguilar R, Scott M, D’Alessio DA, Sandoval DA, Seeley RJ. Neuronal GLP1R mediates liraglutide’s anorectic but not glucose-lowering effect. J Clin Invest. 2014;124(6):2456–2463. doi: 10.1172/JCI72434. [DOI] [PMC free article] [PubMed] [Google Scholar]
- 14.Campbell JE, Drucker DJ. Pharmacology, physiology, and mechanisms of incretin hormone action. Cell Metab. 2013;17(6):819–837. doi: 10.1016/j.cmet.2013.04.008. [DOI] [PubMed] [Google Scholar]
- 15.Skibicka KP. The central GLP-1: implications for food and drug reward. Front Neurosci. 2013;7:181. doi: 10.3389/fnins.2013.00181. [DOI] [PMC free article] [PubMed] [Google Scholar]
- 16.Gaykema RP, et al. Activation of murine pre-proglucagon-producing neurons reduces food intake and body weight. J Clin Invest. 2017;127(3):1031–1045. doi: 10.1172/JCI81335. [DOI] [PMC free article] [PubMed] [Google Scholar]
- 17.Holt MK, et al. Preproglucagon Neurons in the Nucleus of the Solitary Tract Are the Main Source of Brain GLP-1, Mediate Stress-Induced Hypophagia, and Limit Unusually Large Intakes of Food. Diabetes. 2019;68(1):21–33. doi: 10.2337/db18-0729. [DOI] [PMC free article] [PubMed] [Google Scholar]
- 18.Scrocchi LA, et al. Glucose intolerance but normal satiety in mice with a null mutation in the glucagon-like peptide 1 receptor gene. Nat Med. 1996;2(11):1254–1258. doi: 10.1038/nm1196-1254. [DOI] [PubMed] [Google Scholar]
- 19.Scrocchi LA, Brown TJ, Drucker DJ. Leptin sensitivity in nonobese glucagon-like peptide I receptor -/- mice. Diabetes. 1997;46(12):2029–2034. doi: 10.2337/diab.46.12.2029. [DOI] [PubMed] [Google Scholar]
- 20.Chambers AP, et al. The Role of Pancreatic Preproglucagon in Glucose Homeostasis in Mice. Cell Metab. 2017;25(4):927–934.e3. doi: 10.1016/j.cmet.2017.02.008. [DOI] [PMC free article] [PubMed] [Google Scholar]
- 21.Barnett A, Allsworth J, Jameson K, Mann R. A review of the effects of antihyperglycaemic agents on body weight: the potential of incretin targeted therapies. Curr Med Res Opin. 2007;23(7):1493–1507. doi: 10.1185/030079907X199691. [DOI] [PubMed] [Google Scholar]
- 22.Aschner P, et al. Effect of the dipeptidyl peptidase-4 inhibitor sitagliptin as monotherapy on glycemic control in patients with type 2 diabetes. Diabetes Care. 2006;29(12):2632–2637. doi: 10.2337/dc06-0703. [DOI] [PubMed] [Google Scholar]
- 23.Maida A, Lovshin JA, Baggio LL, Drucker DJ. The glucagon-like peptide-1 receptor agonist oxyntomodulin enhances beta-cell function but does not inhibit gastric emptying in mice. Endocrinology. 2008;149(11):5670–5678. doi: 10.1210/en.2008-0336. [DOI] [PubMed] [Google Scholar]
- 24.Richard JE, et al. GLP-1 receptor stimulation of the lateral parabrachial nucleus reduces food intake: neuroanatomical, electrophysiological, and behavioral evidence. Endocrinology. 2014;155(11):4356–4367. doi: 10.1210/en.2014-1248. [DOI] [PMC free article] [PubMed] [Google Scholar]
- 25.Alhadeff AL, Baird JP, Swick JC, Hayes MR, Grill HJ. Glucagon-like Peptide-1 receptor signaling in the lateral parabrachial nucleus contributes to the control of food intake and motivation to feed. Neuropsychopharmacology. 2014;39(9):2233–2243. doi: 10.1038/npp.2014.74. [DOI] [PMC free article] [PubMed] [Google Scholar]
- 26.De Jonghe BC, Holland RA, Olivos DR, Rupprecht LE, Kanoski SE, Hayes MR. Hindbrain GLP-1 receptor mediation of cisplatin-induced anorexia and nausea. Physiol Behav. 2016;153:109–114. doi: 10.1016/j.physbeh.2015.10.031. [DOI] [PMC free article] [PubMed] [Google Scholar]
- 27.Secher A, et al. The arcuate nucleus mediates GLP-1 receptor agonist liraglutide-dependent weight loss. J Clin Invest. 2014;124(10):4473–4488. doi: 10.1172/JCI75276. [DOI] [PMC free article] [PubMed] [Google Scholar]
- 28.Burmeister MA, et al. The Hypothalamic Glucagon-Like Peptide 1 Receptor Is Sufficient but Not Necessary for the Regulation of Energy Balance and Glucose Homeostasis in Mice. Diabetes. 2017;66(2):372–384. doi: 10.2337/db16-1102. [DOI] [PMC free article] [PubMed] [Google Scholar]
- 29.Cheng W, et al. Calcitonin Receptor Neurons in the Mouse Nucleus Tractus Solitarius Control Energy Balance via the Non-aversive Suppression of Feeding. Cell Metab. 2020;31(2):301–312.e5. doi: 10.1016/j.cmet.2019.12.012. [DOI] [PMC free article] [PubMed] [Google Scholar]
- 30.Barrera JG, Jones KR, Herman JP, D’Alessio DA, Woods SC, Seeley RJ. Hyperphagia and increased fat accumulation in two models of chronic CNS glucagon-like peptide-1 loss of function. J Neurosci. 2011;31(10):3904–3913. doi: 10.1523/JNEUROSCI.2212-10.2011. [DOI] [PMC free article] [PubMed] [Google Scholar]
- 31.Zhu H, Roth BL. DREADD: a chemogenetic GPCR signaling platform. Int J Neuropsychopharmacol. 2014;18(1):pyu007. doi: 10.1093/ijnp/pyu007. [DOI] [PMC free article] [PubMed] [Google Scholar]
- 32.Gomez JL, et al. Chemogenetics revealed: DREADD occupancy and activation via converted clozapine. Science. 2017;357(6350):503–507. doi: 10.1126/science.aan2475. [DOI] [PMC free article] [PubMed] [Google Scholar]
- 33.Kanoski SE, et al. Endogenous leptin receptor signaling in the medial nucleus tractus solitarius affects meal size and potentiates intestinal satiation signals. Am J Physiol Endocrinol Metab. 2012;303(4):E496–E503. doi: 10.1152/ajpendo.00205.2012. [DOI] [PMC free article] [PubMed] [Google Scholar]
- 34.Leinninger GM, et al. Leptin action via neurotensin neurons controls orexin, the mesolimbic dopamine system and energy balance. Cell Metab. 2011;14(3):313–323. doi: 10.1016/j.cmet.2011.06.016. [DOI] [PMC free article] [PubMed] [Google Scholar]
- 35.Song Y, Koehler JA, Baggio LL, Powers AC, Sandoval DA, Drucker DJ. Gut-Proglucagon-Derived Peptides Are Essential for Regulating Glucose Homeostasis in Mice. Cell Metab. 2019;30(5):976–986.e3. doi: 10.1016/j.cmet.2019.08.009. [DOI] [PMC free article] [PubMed] [Google Scholar]
- 36.Allison MB, Patterson CM, Krashes MJ, Lowell BB, Myers MG, Olson DP. TRAP-seq defines markers for novel populations of hypothalamic and brainstem LepRb neurons. Mol Metab. 2015;4(4):299–309. doi: 10.1016/j.molmet.2015.01.012. [DOI] [PMC free article] [PubMed] [Google Scholar]
- 37.Gray JT, Zolotukhin S. Design and construction of functional AAV vectors. Methods Mol Biol. 2011;807:25–46. doi: 10.1007/978-1-61779-370-7_2. [DOI] [PubMed] [Google Scholar]
Associated Data
This section collects any data citations, data availability statements, or supplementary materials included in this article.


