Abstract
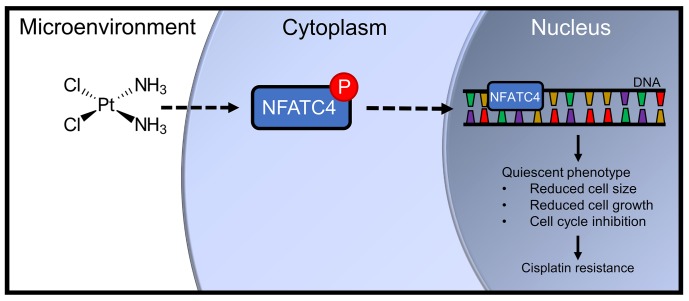
Development of chemotherapy resistance is a major problem in ovarian cancer. One understudied mechanism of chemoresistance is the induction of quiescence, a reversible nonproliferative state. Unfortunately, little is known about regulators of quiescence. Here, we identify the master transcription factor nuclear factor of activated T cells cytoplasmic 4 (NFATC4) as a regulator of quiescence in ovarian cancer. NFATC4 is enriched in ovarian cancer stem-like cells and correlates with decreased proliferation and poor prognosis. Treatment of cancer cells with cisplatin resulted in NFATC4 nuclear translocation and activation of the NFATC4 pathway, while inhibition of the pathway increased chemotherapy response. Induction of NFATC4 activity resulted in a marked decrease in proliferation, G0 cell cycle arrest, and chemotherapy resistance, both in vitro and in vivo. Finally, NFATC4 drove a quiescent phenotype in part via downregulation of MYC. Together, these data identify NFATC4 as a driver of quiescence and a potential new target to combat chemoresistance in ovarian cancer.
Keywords: Therapeutics
Keywords: Cancer
The master transcription factor NFATC4 is a regulator of quiescence and chemoresistance in ovarian cancer.
Introduction
Every year approximately 240,000 women are diagnosed with ovarian cancer worldwide, and 140,200 succumb to the disease (1). Among all cancers in developed countries, ovarian cancer has the third-highest incidence/mortality ratio. Although initial response rates to cytoreductive surgery and primary chemotherapy can be as high as 70%, the vast majority of patients experience a cancer relapse, develop chemotherapy-resistant disease, and die of their cancer (2). Consequently, identifying and understanding mechanisms of chemotherapy resistance in ovarian cancer are essential for the development of new therapeutics to prevent relapse and improve overall survival.
Quiescence is defined as a reversible nondividing state in which cells arrest in the G0 phase of the cell cycle. Adult stem cells are typically maintained in G0 until stimulated to enter the cell cycle and proliferate (3). Because chemotherapy targets rapidly dividing cells, quiescent stem cells are innately resistant to these therapies (4). A striking example of this mechanism can be observed in the hair follicle, where the nuclear factor of activated T cells (NFAT) family member NFAT1 drives cyclin-dependent kinase 4 (CDK4) downregulation in the stem cell pool to induce a quiescent state (5). During chemotherapy, the rapidly dividing follicular cells die, resulting in hair loss; however, because of the NFAT1-induced quiescence, the stem cells survive, allowing hair regrowth following cessation of therapy.
The role of quiescence in cancer is a new area of research. Quiescent cancer stem-like cells (CSCs) have been reported in leukemia, medulloblastoma, and colon cancers (6–8). In some cases, the quiescence is niche dependent, driving CSCs’ resistance to chemotherapeutics and tumor recurrence (6–8). Consequently, successful targeting of quiescent CSCs may be essential for improving cancer cure rates (9). To date, little is known about regulators of quiescence in ovarian cancer.
We previously reported the identification of ovarian CSC populations defined by the expression of the stem cell makers aldehyde dehydrogenase (ALDH) and CD133 (10). Meeting the definition for CSCs Weinberg and colleagues proposed (11), these cells have enhanced tumor initiation capacity and the ability to both self-renew and asymmetrically divide (10, 12). In addition, these cells exhibit increased resistance to chemotherapy (10). Here, we demonstrate that the NFAT family member NFATC4 (coding for the NFAT3 protein) is upregulated in ovarian CSCs and in response to chemotherapy undergoes cytoplasm to nuclear translocation, resulting in subsequent activation of known NFATC4 target genes. Using 2 constitutively active NFATC4 constructs, we demonstrate that NFATC4 drives the induction of a quiescent state characterized by (a) decreased proliferation rates, (b) smaller cell size, and (c) arrest of cells in G0 (13). Furthermore, induction of NFATC4 conveyed growth arrest and chemoresistance both in vitro and in vivo, suggesting that NFATC4-driven quiescence is in part related to suppressed MYC activity, activation of NFATC4 results in suppression of MYC expression, and overexpression of MYC following induction of NFATC4 can partially rescue the quiescent phenotype.
Results
NFATC4 mRNA and activity are enriched in a population of slowly dividing CSCs.
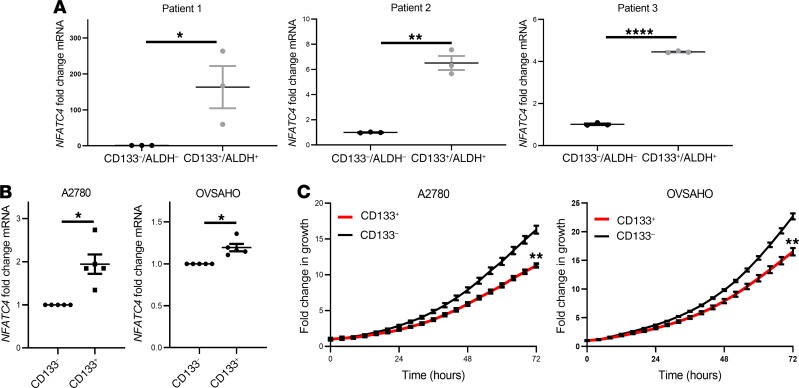
NFAT family members have been linked with quiescence in hair follicle stem cells (5). We therefore evaluated the expression of NFAT family members in ovarian CSCs. We previously identified a subset of ovarian CSCs marked by expression of ALDH and CD133 (10). Evaluation of NFAT family mRNAs in ALDH+CD133+ ovarian CSCs and ALDH–CD133– ovarian cancer bulk cells identified NFATC4 as upregulated (4- to 200-fold, P < 0.05–0.001) in 3 independent late-stage (III–IV) high-grade serous carcinoma (HGSC) patient-derived ALDH+CD133+ samples (Figure 1A). Although not as prominent, NFATC4 expression was also enriched in slower growing CD133+ CSC populations from OVSAHO and A2780 cell lines (cell lines chosen because they have distinct CD133+ cell populations) (Figure 1, B and C).
Figure 1. NFATC4 is enriched in ovarian CSCs.
(A) NFATC4 mRNA expression in ALDH+CD133+ ovarian CSCs and bulk ALDH–/CD133– cancer cells from 3 primary advanced-stage (stages III–IV) HGSC patients (n = 3). (B) NFATC4 mRNA expression in CD133+ and CD133– ovarian cancer cell lines (n = 4). (C) Representative growth curves of CD133+ and CD133– cells from ovarian cancer cell lines (n = 3). T tests were performed to determine significance. *P < 0.05; **P < 0.01; ****P < 0.0001.
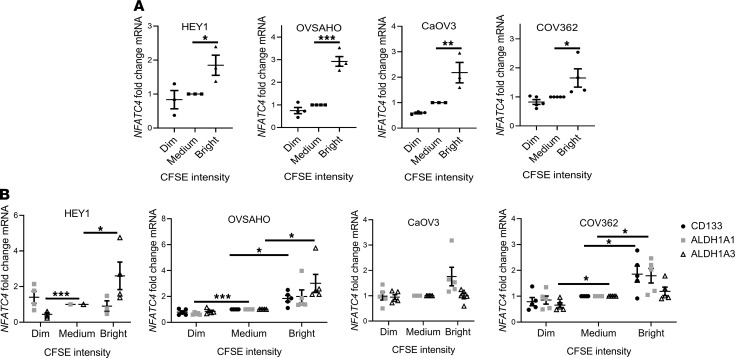
To determine whether NFATC4 was enriched in slower proliferating cells, we evaluated NFATC4 expression in slowly proliferating/vital dye–retaining cells (14) in multiple ovarian cancer cell lines. Slowly growing/dye-retaining cells (bright) demonstrated a significant enrichment for NFATC4 mRNA expression compared with the fast-growing/dim (dye diluted) cells in all 4 cell lines tested (HEY1 P < 0.05; OVSAHO P < 0.001; CaOV3 P < 0.01; COV362 P < 0.05) (Figure 2A). These slowly dividing cells were also shown to be significantly enriched for ovarian CSC markers (Figure 2B).
Figure 2. NFATC4 expression correlates with a decrease in cellular proliferation and an increase in cancer stem cell markers.
(A) NFATC4 mRNA expression levels in 4 cell lines (HEY1 n = 3, OVSAHO n = 4, CaOV3 n = 3, COV362 n = 4) stained with CFSE. CFSE intensity: bright, slowly dividing; medium, bulk cells; dim, rapidly dividing. (B) mRNA expression of the dominant ALDH genes (ALDH1A1/3) and CD133 in CFSE-stained cell lines: HEY1 (n = 4), OVSAHO (n = 4), CaOV3 (n = 5), COV362 (n = 5). One-way ANOVAs were performed to determine significance. *P < 0.05; **P < 0.01; ***P < 0.001.
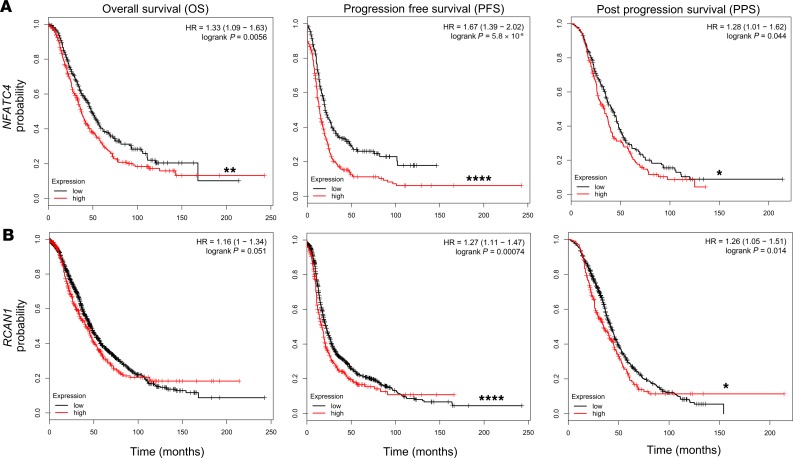
Because these findings may have clinical relevance, in silico analysis of the impact of NFATC4 expression on patient prognosis was performed using publicly available data (15, 16). Analyses of microarray data from 1287 HGSC ovarian cancer patients (16) suggested higher expression of NFATC4 was correlated with worse overall survival (OS), progression-free survival (PFS), and postprogression survival (PPS) (Figure 3A, P < 0.01; P < 0.0001; P < 0.05, respectively). Similarly, analysis of 376 samples in the The Cancer Genome Atlas (TCGA) ovarian cancer data set demonstrated that dysregulation of the NFATC4 pathway correlated with poor patient outcome (P < 0.05; Supplemental Figure 1; supplemental material available online with this article; https://doi.org/10.1172/jci.insight.131486DS1). Parallel analysis of the NFATC4 target gene, regulator of calcineurin 1 (RCAN1), also showed a correlation between elevated expression and OS, PFS, and PPS (Figure 3B, P < 0.051; P < 0.0001; P < 0.05, respectively). The impact of RCAN1 on prognosis was less prominent but was likely complicated by RCAN1 expression in T cells.
Figure 3. NFATC4 expression correlates with worse ovarian cancer patient outcomes.
Kaplan-Meier survival plots displaying overall survival (OS), progression-free survival (PFS), and postprogression survival (PPS) of TCGA HGSC patients expressing (A) high or low NFATC4 (B) high and low RCAN1. *P < 0.05; **P < 0.01; ****P < 0.0001.
NFATC4 activity induces a quiescent state.
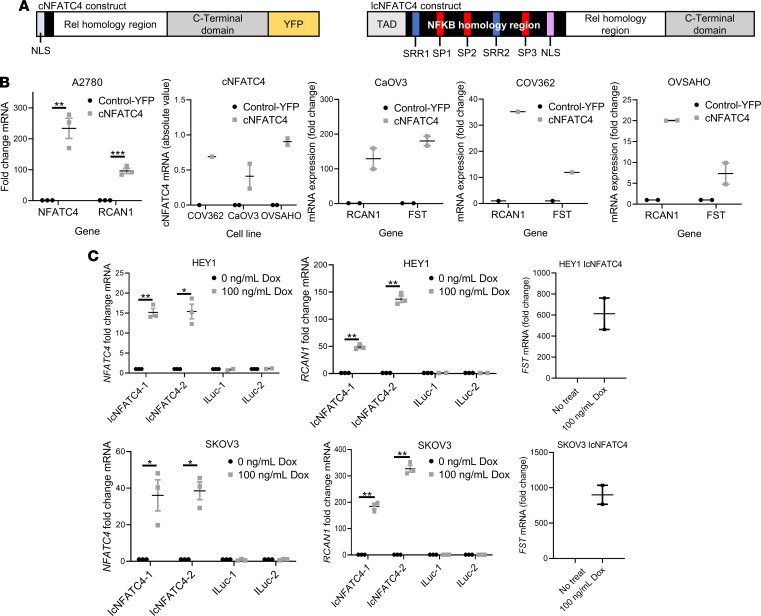
To directly interrogate the function of NFATC4 in ovarian cancer cells, we used 2 distinct previously generated NFATC4 expression constructs, one constitutively active (cNFATC4) (17) and one inducible (IcNFATC4) (18). NFAT proteins are primarily regulated through phosphorylation-regulated cytoplasmic retention (dephosphorylation results in nuclear translocation and activation of various transcription binding partners) (19, 20). One construct (cNFATC4) lacks the regulatory phosphorylation domain and is therefore constitutively nuclear/active (Figure 4A). Transfection of this construct into A2780 cells demonstrated clear expression of the NFATC4 mRNA relative to cells transfected with control-YFP (Figure 4B). Showing cNFATC4 is transcriptionally active, expression of cNFATC4 resulted in a strong induction of the known NFAT target genes RCAN1 (21) and FST (22) (Figure 4B). To confirm the result was broadly applicable, we repeated this experiment and found similar results using multiple ovarian HGSC cell lines (CaOV3, COV362, and OVSAHO) (Figure 4B).
Figure 4. Characterization of NFATC4 overexpression constructs.
(A) Schematic diagram of the 2 constitutively active NFTAC4 overexpression constructs: cNFATC4 (truncated regulatory domain and tagged with a yellow fluorescent protein [YFP]) and IcNFATC4 (NLS phosphorylation sites mutated). (B) cNFATC4 and RCAN1 mRNA expression in A2780 (n = 3) and HGSC cells (CaOV3 n = 2, OVSAHO n = 1, and COV362 n = 2) expressing cNFATC4 or control-YFP construct. HGSC also show follistatin (FST) mRNA expression. (C) NFATC4 (n = 3), RCAN1, and FST (n = 2) mRNA expression in HEY1 and SKOV3 cells expressing IcNFATC4 or ILuc control constructs treated with or without 100 ng/mL doxycycline for 72 hours. T tests and 1-way ANOVAs were performed to determine significance. *P < 0.05; **P < 0.01; ***P < 0.001.
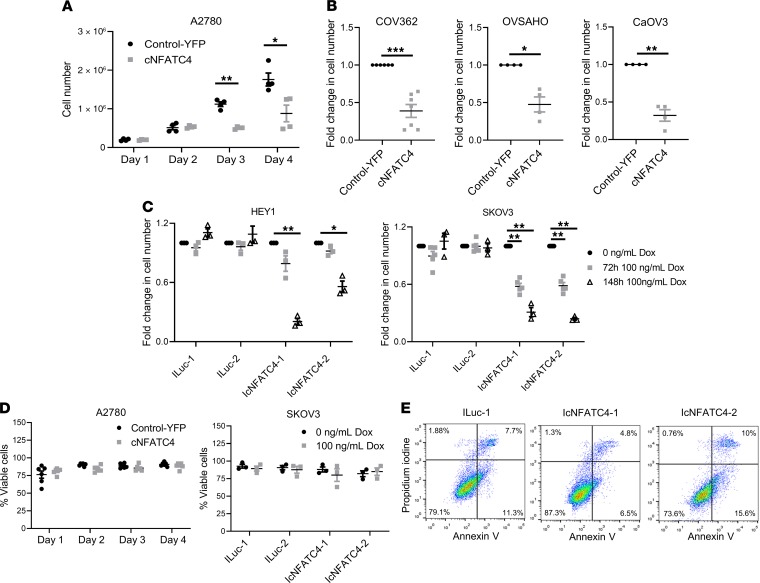
We also generated a doxycycline-inducible nuclear NFATC4 (IcNFATC4) with a puro selection cassette (Figure 4A). Because deletion of the regulatory domain could lead to unexpected changes in function, we used a previously developed construct with point mutations that change the regulatory serines to alanines, leaving the remaining protein intact (18). Due to the lack of serine phosphorylation, this NFAT3 protein has an exposed nuclear localization sequence and is therefore constitutively nuclear. An inducible luciferase (ILuc) was used as a control. Disappointingly and inexplicably, despite clear presence of the construct, we were unable to show any inducible expression in multiple HGSC cell lines, including OVSAHO, OVCAR3, and OVCAR4 (Supplemental Figure 2A). However, we were able to generate inducible expression of NFATC4 mRNAs in the HGSC cell line HEY1 (23) and the endometrioid ovarian cancer SKOV3 line (Figure 4C). Suggesting activity of the IcNFATC4 construct, following doxycycline induction, the NFATC4 protein (NFAT3) was detected at high levels in the cell nucleus (Supplemental Figure 2B). Confirming transcriptional activity, the NFAT target genes RCAN1 and FST were induced following NFATC4 induction (Figure 4C). Using these constructs, we tested the effects of NFATC4 activity on ovarian cancer cell growth. Compared with control-YFP lines, cNFATC4 overexpression was associated with a 2-fold (A2780) decrease in total cell number over 4 days (P < 0.0001) (Figure 5A). Similarly, cNFATC4 overexpression in HGSC cell lines resulted in a 60% (COV362, P < 0.001), 50% (OVSAHO, P < 0.05), and 70% (CaOV3, P < 0.01) decrease in total cell number compared with respective control-YFP lines (Figure 5B).
Figure 5. NFATC4 overexpression significantly inhibits cell growth.
Cell counts of (A) A2780 (n = 4) cell line or (B) HGSC cell lines (COV362 n = 7, OVSAHO n = 4, and CaOV3 n = 4, at 6, 4, and 6 days, respectively) expressing cNFATC4 or control-YFP constructs. (C) Cell counts of HEY1 (n = 3) and SKOV3 (n = 4) cells expressing IcNFATC4 or ILuc control constructs treated with or without doxycycline. (D) Trypan blue viability staining of A2780 (n = 6) cells expressing cNFATC4 or YFP control or SKOV3 (n = 3) cells expressing IcNFATC4 or ILuc control with or without 100 ng/mL doxycycline. (E) Representative images of annexin V/PI staining of A2780 cells expressing cNFATC4 or YFP control (n = 3). T tests and 1-way ANOVAs were performed to determine significance. *P < 0.05; **P < 0.01; ***P < 0.001.
For the IcNFATC4 constructs, doxycycline induction of 2 independent HEY1 IcNFATC4 cell clones and 2 independent SKOV3 cell clones showed 1.5- to 3-fold and 2- to 4-fold (P < 0.01) decreases in cell number at 3 and 6 days after doxycycline treatment, respectively (Figure 5C). In contrast, doxycycline had no impact on ILuc cell growth for either cell line (Figure 5C). Interestingly, we noted that, despite multiple rounds of FACS enrichment, cNFATC4 expression, but not control-YFP, was rapidly lost over time in cell culture, which could be due to selection for rapidly growing cells (Supplemental Figure 3).
Given the significant reduction in cell numbers and links between NFAT proteins and apoptosis (24), we evaluated the effects of NFATC4 on cellular viability. Trypan blue staining of A2780 and SKOV3 cells indicated that total viability did not change with the expression of cNFATC4 or IcNFATC4 (with or without doxycycline) compared with their respective controls (Figure 5D). We also analyzed apoptosis rates in the HEY1 IcNFATC4 cells versus ILuc control with annexin V/propidium iodine (annexin V/PI) FACS. We observed no significant increase in annexin V staining in IcNFATC4 cells versus ILuc controls (Figure 5E). Thus, it does not appear that increased apoptosis rates account for the reduction in proliferation of NFATC4-overexpressing ovarian cancer cells.
Another explanation for a reduction in growth following overexpression of NFATC4 could be an increase in cellular senescence (25). Senescent cells demonstrate an increase in senescence-associated β-galactosidase (SABG). SABG staining demonstrated no increase in SABG expression in control or cNFATC4 cells compared with controls (Supplemental Figure 4, A and B). Therefore, it appears that NFATC4 expression decreases cell division without inducing death, apoptosis, or senescence.
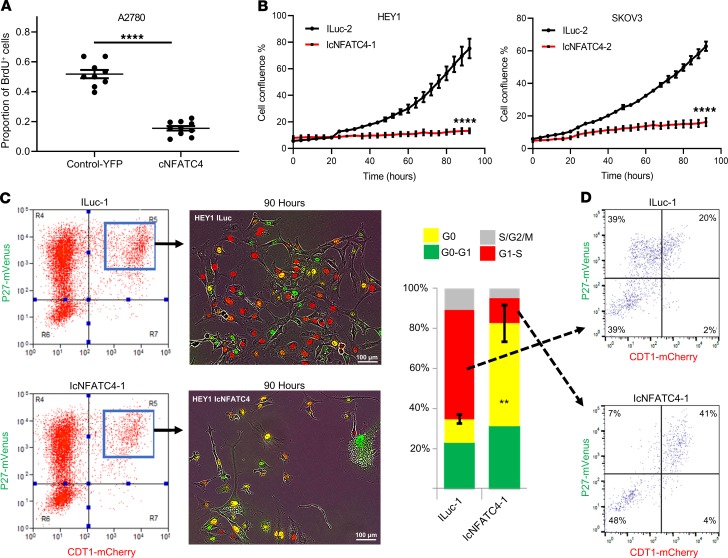
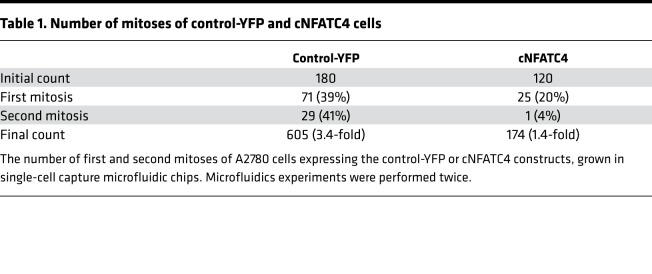
We next evaluated the impact of NFATC4 expression on cellular division. Suggesting a reduction in the percentage of dividing cells, immunofluorescent evaluation of BrdU incorporation demonstrated a reduction of BrdU incorporation in cNFATC4 cells (P < 0.0001) (Figure 6A). We then evaluated cellular proliferation at a single-cell level. We monitored cell divisions of cells expressing cNFATC4 or control-YFP in single-cell microfluidic culture chips (Table 1), as described previously (12). Over 4 days, 39% of control cells and 20% of cNFATC4 cells underwent at least 1 cell division. Of the dividing control cells, 41% underwent a second cell division while only 4% of the cNFATC4 cells underwent a second division; this resulted in a final >3-fold decreased total cell number in the cNFATC4 cells versus control-YFP cells (Table 1). We also evaluated the impact of NFATC4 on growth rates of SKOV3 and HEY1 cell lines. Cell lines expressing the constructs IcNFATC4 or ILuc were evaluated in the presence of doxycycline for 96 hours using real-time imaging. Doxycycline-treated IcNFATC4-expressing cells had significantly slower proliferation rates than doxycycline-treated ILuc controls (HEY1 P < 0.0001; SKOV3 P < 0.001), with near-complete arrest at 96 hours (Figure 6B) (P < 0.0001).
Figure 6. NFATC4 inhibits proliferation and arrests cells in G0.
(A) Quantitation of BrdU incorporation of A2780 cells expressing control-YFP (n = 8) or cNFATC4 (n = 10). (B) IncuCyte growth curves of IcNFATC4 or ILuc cells treated with or without doxycycline (n = 4). (C) FACS plots demonstrating the isolation and quantification of IcNFATC4 and ILuc HEY1 cells expressing the fluorescence ubiquitination cell cycle indicator (FUCCI) cell cycle reporter vectors (n = 3). Bar graph summarizing the cell cycle phase of cells expressing either construct. (D) Cell cycle analysis of G1/S phase enriched ILuc and IcNFATC4. T tests and 1-way ANOVAs were performed to determine significance. Scale bars: 100 μm. ****P < 0.001.
Table 1. Number of mitoses of control-YFP and cNFATC4 cells.
An explanation for restricted cell proliferation, in the absence of cell death or senescence, is the induction of quiescence. Quiescent cells typically exit the cell cycle and reside in G0. To directly evaluate the impact of NFATC4 activity on G0 cells, we transduced HEY1 cells expressing the IcNFATC4 and ILuc constructs with the mVenus-p27K- and mCherry-CDT1 vectors (13). This system can be used to define the G0/G1 transition; briefly, cells expressing high levels of each fusion protein (yellow) are in G0, cells with low or no mVenus-p27K- and high mCherry-CDT1 (red) are transitioning into G1 or in the G1/S phase, and cells with no/low expression of either construct are in S/G2/M. ILuc and IcNFATC4 cells were labeled with the 2 reporters, and the cells expressing both reporter constructs were FACS isolated (Figure 6C). Purified cells were then treated with doxycycline, plated at approximately 10% confluence, and allowed to adhere overnight before real-time imaging was performed over 90 hours. At the conclusion of the experiment, we scored the number of cells in each phase of the cell cycle and found IcNFATC4 cells had a >4-fold increase in the number of cells in G0 (Figure 6C, P < 0.01).
To determine whether a subset of cells were cycling while a distinct subset was arresting in G0, we FACS isolated ILuc and IcNFATC4 cells in the G1/S phase of the cell cycle (mCherry-CDT1+, mVenus-p27K-–) of the cell cycle, replated them, and FACS analyzed them after 72 hours. FACS analysis showed that while ILuc cells redistributed appropriately through the cell cycle, with 39% of cells in G1/S, nearly 90% of the IcNFATC4 cells were in the S/G2/M and G0 phases of the cell cycle, with only 7% of cells in the G1/S phase of the cell cycle (Figure 6D).
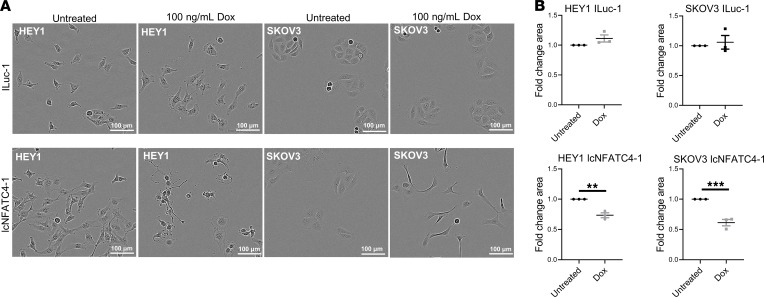
In addition to G0 arrest, quiescent cells have a unique phenotype, which includes a reduction in cell size (26). Light microscopic evaluation of doxycycline-treated HEY1 and SKOV3 IcNFATC4 and ILuc controls, controlled for cell confluences (Supplemental Figure 5A), demonstrated IcNFATC4 cells became significantly smaller with doxycycline treatment (HEY1 P < 0.01; SKOV3 P < 0.001) (Figure 7, A and B). FACS analyses of forward scatter as another measure of size confirmed these results in A2780 cNFATC4 cells and doxycycline-treated HEY1 IcNFATC4 cells (Supplemental Figure 5, B–D).
Figure 7. NFATC4 overexpression reduces cell size.
(A) Representative images of cell size changes in ILuc and IcNFATC4 cells following doxycycline treatment for 106 hours (n = 3). (B) Quantification of the change in cell size. T tests were performed to determine significance. Scale bars: 100 μm. **P < 0.01; ***P < 0.001.
NFATC4 overexpression promotes chemotherapy resistance in vitro.
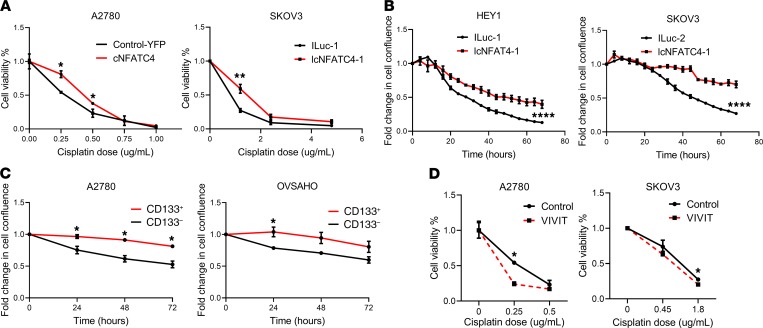
Multiple groups have reported that quiescent/slow-cycling cells are more chemotherapy resistant (27–29). We therefore tested the effects of constitutive NFATC4 expression on chemoresistance. We cotreated A2780 cells expressing the cNFATC4 or control-YFP construct and SKOV3 expressing the IcNFATC4 or ILuc constructs with doxycycline and varying concentrations of cisplatin for 72 hours (for IC50 values, see Supplemental Table 1). We then quantitated cell number and normalized it to the untreated cells. cNFATC4 and IcNFATC4 cells demonstrated significantly increased survival (P < 0.001 and P < 0.01, respectively) in response to cisplatin chemotherapy when compared with control-YFP and doxycycline-treated ILuc (Figure 8A). SKOV3 expressing IcNFATC4 treated with and without doxycycline also showed a similar effect (Supplemental Figure 6, left graph P < 0.01), while ILuc untreated versus doxycycline showed no difference (Supplemental Figure 6, right graph). To confirm these results, we cotreated HEY1 and SKOV3 cells expressing the IcNFATC4 or ILuc control construct with doxycycline and cisplatin (9.5 μg/mL) for 72 hours and measured cell confluence using IncuCyte real-time imaging (Figure 8B). IcNFATC4 cells were significantly more resistant to chemotherapy than ILuc cells for both HEY1 (P < 0.0001) and SKOV3 (P < 0.0001) cell lines.
Figure 8. NFATC4 promotes chemoresistance in vitro.
(A) Viability of cells expressing construct pairs (cNFATC4/control-YFP n = 3 or IcNFATC4/ILuc n = 6) treated with various concentrations of cisplatin. (B) IncuCyte confluence growth curves of IcNFATC4/ILuc-expressing cells cotreated with cisplatin and doxycycline (n = 3). (C) IncuCyte confluence growth curves of CD133– versus CD133+ cells treated with cisplatin (n = 4). (D) Cell viability of A2780 (n = 3) and SKOV3 (n = 4) following cotreatment with cisplatin and the pan-NFAT inhibitor VIVIT. T tests and 1-way ANOVAs were performed to determine significance. *P < 0.05; **P < 0.01; ****P < 0.0001.
Supporting these results, slower growing/NFATC4-enriched CD133+ A2780 and OVSAHO CSCs (Figure 1C) demonstrated resistance to cisplatin treatment (Figure 8C). A2780 CD133+ cells, which had the highest levels of NFATC4, were most cisplatin resistant. To functionally link NFATC4 activity and chemotherapy resistance, we cotreated cell lines with the pan-NFAT inhibitor VIVIT (30) and various concentrations of cisplatin for 72 hours. Cells cotreated with VIVIT and cisplatin showed a significant decrease in cell viability when compared with cells treated with cisplatin alone (A2780 P < 0.05; SKOV3 P < 0.05) (Figure 8D).
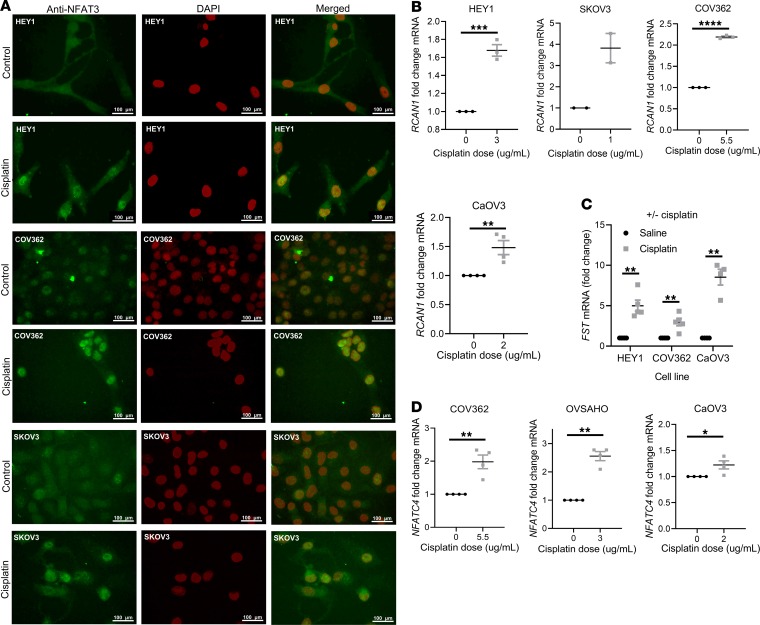
To determine whether chemotherapy exposure could induce NFAT3 nuclear translocation, we performed immunofluorescence on cisplatin-treated ovarian cancer cell lines. Cisplatin demonstrated clear nuclear translocation of native NFAT3 in all tested ovarian cancer cell lines (Figure 9A). Confirming transcriptional activity of NFATC4 with cisplatin-induced nuclear translocation, cisplatin treatment resulted in increases in both RCAN1 mRNA (COV362 P < 0.0001; SKOV3 P < 0.01; HEY1 P < 0.001; CaOV3 P < 0.01) (Figure 9B) and FST mRNA (COV362 P < 0.01; HEY1 P < 0.1; CaOV3 P < 0.01) (Figure 9C). We also observed a significant enrichment of NFATC4 mRNA expression (COV362 P < 0.01; OVSAHO P < 0.01; CaOV3 P < 0.05) following prolonged treatment with a high dose of cisplatin for 72 hours (Figure 9D). Whether this relates to an increase in NFAT gene expression in platinum-treated cells or selection for cells expressing NFATC4 remains to be determined. Furthermore, NFAT3 protein levels were demonstrated to be higher and more nuclear in chemoresistant ovarian cell lines compared with their chemosensitive pairs (Supplemental Figure 7). Taken together, our in vitro data demonstrate NFATC4 promotes quiescence and chemoresistance in ovarian cancer cells and ovarian CSCs in vitro.
Figure 9. NFATC4 is activated by chemotherapy.
(A) Representative images of NFAT3 immunofluorescence in cell lines treated with or without cisplatin (n = 3). Scale bars: 100 μm. (B) RCAN1 mRNA expression levels of HEY1 (n = 3), SKOV3 (n = 2), COV362 (n = 3), and CaOV3 (n = 4) treated with or without cisplatin. (C) FST mRNA expression in cell lines treated with a high concentration of cisplatin for 72 hours (n = 4). (D) NFATC4 mRNA expression levels in cells treated with or without the indicated doses of cisplatin: CaOV3 (2 μg/mL, n = 5), COV362 (5.5 μg/mL, n = 5), HEY (2.5 μg/mL, n = 4). T tests and 1-way ANOVAs were performed to determine significance. *P < 0.05; **P < 0.01; ***P < 0.001; ****P < 0.0001.
With NFATC4 clearly being activated by cisplatin, we wished to investigate whether this response was specific to cisplatin or a general response to cellular stress. To test this, we paclitaxel treated ovarian cancer cell lines for 72 hours (for IC50 values, see Supplemental Table 1) and looked at expression of the same genes (Supplemental Figure 8). We demonstrated a mild increase in both RCAN1 and NFATC4 expression following paclitaxel treatment. This suggests paclitaxel may contribute to activation of the NFATC4 pathway. However, platinum, which is known to increase intracellular calcium levels, a known activator of NFAT nuclear localization, is likely the primary driver.
cNFATC4 expression suppresses tumor growth and drives chemotherapy resistance in vivo.
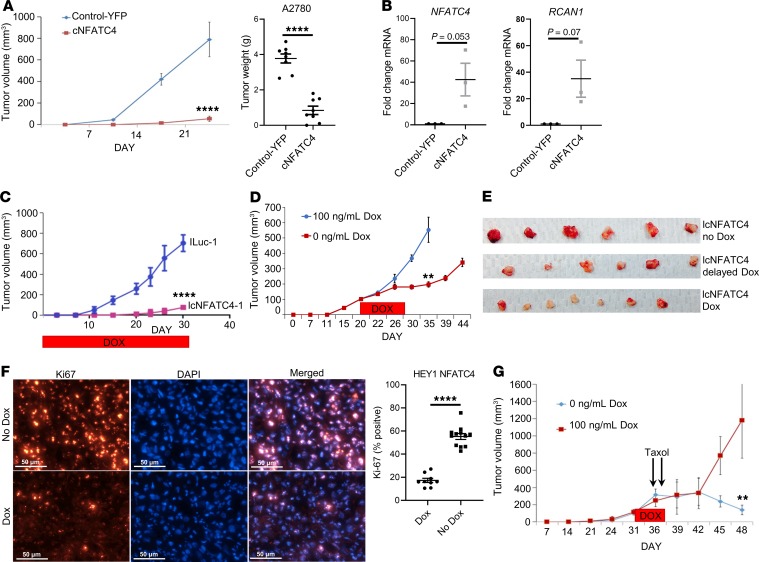
We next examined the effect of NFATC4 expression on tumor xenograft growth. A2780 cNFATC4 tumors demonstrated significant growth delay relative to controls (P < 0.0001), with essentially no growth for 3 weeks and with 2/10 cNFATC4 tumors failing to initiate (Figure 10A). Quantitative PCR (qPCR) analysis confirmed cNFATC4 tumors had higher expression of NFATC4 and RCAN1 compared with control-YFP tumors (Figure 10B). After 3 weeks, cNFATC4 tumors resumed normal growth; however, suggesting a requirement for loss of cNFATC4 for resumption of growth, analysis of these tumors demonstrated complete loss of cNFATC4 transgene expression (Supplemental Figure 9).
Figure 10. NFATC4 inhibits tumor growth and promotes chemoresistance in vivo.
(A) Tumor growth of A2780 cells expressing cNFATC4 (n = 8) or control-YFP (n = 7). (B) NFATC4 and RCAN1 gene expression of A2780 tumors expressing cNFATC4 or control-YFP (n = 3). (C) Tumor growth of HEY1 cells expressing IcNFATC4 or ILuc control constructs in the presence of doxycycline (n = 6). (D) Tumor growth of IcNFATC4 HEY1 cells treated with delayed doxycycline or vehicle (n = 6). (E) Tumor weights of HEY1 IcNFATC4 xerographs treated with vehicle (n = 6) or delayed (n = 6) or continuous doxycycline (n = 8). (F) Ki-67 immunofluorescence of IcNFATC4 HEY1 tumors treated with (n = 9) or without (n = 12) doxycycline. Scale bars: 50 μm. (G) Tumor growth of HEY1 IcNFATC4 cells treated with doxycycline for 5 days or vehicle, then both treated with 16 mg/kg Taxol (paclitaxel), intraperitoneally. T tests and 1-way ANOVAs were performed to determine significance. All experiments were repeated a minimum of 3 times. **P < 0.01; ****P < 0.0001.
We similarly evaluated the impact of IcNFATC4 expression on tumor growth. In the presence of continuous doxycycline treatment, tumors expressing IcNFATC4 were >13-fold smaller than their ILuc controls (P < 0.0001) (Figure 10C). To confirm this was not related to unequal cell inoculation or altered tumor initiation, we repeated this experiment but did not initiate doxycycline treatment until tumors were 100 mm3. Control-Luc and IcNFATC4 tumors initiated and grew similarly. However, approximately 5 days after the initiation of treatment with doxycycline, IcNFATC4 tumors showed growth arrest (Figure 10, D and E). Confirming reversibility of the phenotype, on withdrawal of doxycycline, after a slight delay, tumors resumed normal growth. Last, to confirm quiescence of the NFATC4-activated cells, we performed Ki-67 immunofluorescence on IcNFATC4 tumors treated with or without doxycycline. Tumors treated with doxycycline had significantly less Ki-67–positive staining compared with untreated tumors (P < 0.0001) (Figure 10F), confirming NFATC4-induced quiescence.
We next tested the impact of IcNFATC4 induction on chemotherapy resistance. We allowed IcNFATC4 tumors to grow until they were approximately 150 mm3. Tumor-bearing mice were then randomized and half were then treated with doxycycline for 5 days to induce NFATC4 expression. Due to the low sensitivity of HEY1 to cisplatin at baseline, animals were treated with 2 daily doses of high-dose paclitaxel (16 mg/kg). Although control tumors demonstrated a complete response to chemotherapy, tumors in which IcNFATC4 expression was transiently induced demonstrated growth arrest in response to doxycycline, and then approximately 8 days after doxycycline discontinuation, tumors resumed normal growth without any evidence of response to therapy (P < 0.001) (Figure 10G).
NFATC4 downregulates MYC and MYC overexpression can partially inhibit early NFATC4-mediated quiescence.
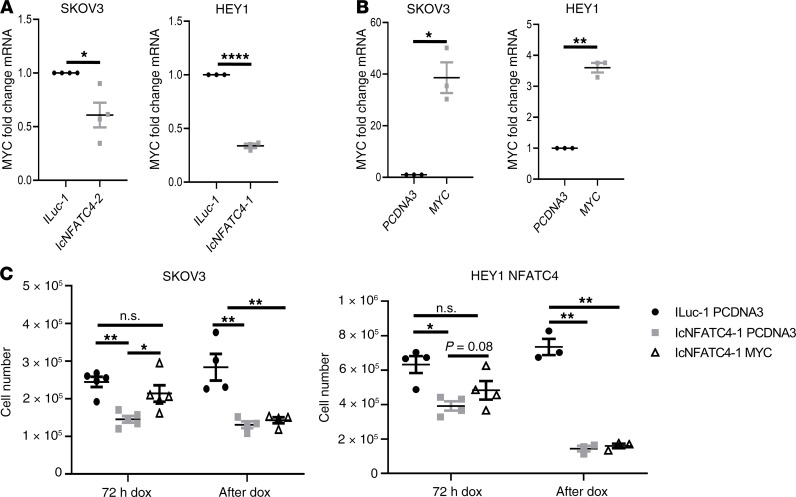
It has been reported by multiple studies that NFAT family members can regulate the proto-oncogene MYC (31–33). MYC is a master regulator of growth-promoting signal transduction pathways and a well-defined pro-proliferation gene (34). To determine whether NFATC4, like other family NFAT family members, can regulate MYC expression and whether this could be a mechanism for NFATC4-mediated quiescence, we examined the effect of cNFATC4 on MYC mRNA expression. HEY1 and SKOV3 cells demonstrated a significant reduction in MYC expression following NFATC4 induction (P < 0.0001 and P < 0.05, respectively; Figure 11A). Furthermore, we conducted doxycycline recovery experiments, where we induced the construct by treating cells with doxycycline for 72 hours, then removed the doxycycline and recorded cell number (Supplemental Figure 10A) and mRNA expression of NFATC4 target genes (Supplemental Figure 11) as the cells resumed cell cycle. We were then able to reinduce the quiescent state via additional doxycycline treatment (Supplemental Figure 10B and Supplemental Figure 11). These experiments demonstrated MYC, along with the NFATC4 target genes RCAN1 and FST, cycled with the induction and loss of quiescence, supporting their role in inducing this quiescent state.
Figure 11. NFATC4 overexpression inhibits MYC, and MYC overexpression partially rescues the quiescent phenotype at early, but not late, time points.
(A) MYC mRNA expression following 24-hour doxycycline treatment. SKOV3 (n = 4), HEY1 (n = 3). (B) Validation of MYC overexpression construct in SKOV3 and HEY1 cell lines (n = 3). (C) The effect of MYC overexpression on cell number of IcNFATC4 cells transfected with pcDNA3 or MYC and treated with doxycycline for 72 hours (SKOV3 n = 5; HEY1 n = 3) or posttreated for 72 hours (SKOV3 n = 4; HEY1 n = 3) with doxycycline before transfection with pcDNA3 or MYC and treated with doxycycline for an additional 72 hours. T tests and 1-way ANOVAs were performed to determine significance. n.s., not significant; *P < 0.05; **P < 0.01; ****P < 0.0001.
To investigate whether this downregulation in MYC following NFATC4 induction could affect cell proliferation, we transfected IcNFATC4-expressing SKOV3 and HEY1 cells with a MYC overexpression construct (35) or PCDNA3 vector control. MYC overexpression resulted in a significant increase in MYC mRNA expression (SKOV3 P < 0.05; HEY1 P < 0.01) (Figure 11B). To determine whether early induction of MYC expression was able to prevent NFATC4-induced quiescence, we induced IcNFATC4 cells for 6 hours, then transfected cells with PCDNA3 (control) or MYC. We continued doxycycline for 72 hours and then evaluated cell growth. Cells transfected with MYC 6 hours after NFATC4 induction demonstrated cell growth that was not statistically significantly different from control ILuc cells (Figure 11C).
To determine whether MYC expression could overcome growth suppression in established NFATC4-driven quiescent cells, we repeated the above experiment, in cells in which NFATC4 had been induced for 72 hours to ensure the cells had already established a quiescent phenotype before transfection with PCDNA3 or MYC. Doxycycline treatment was continued for an additional 72 hours and cell proliferation evaluated. Interestingly, MYC expression in established quiescent cells was unable to reverse the quiescent phenotype (Figure 11C).
Discussion
The NFAT family of transcription factors act as master regulators of numerous cellular processes. In normal cells, NFAT family members can influence both proliferation (36–40) and quiescence (5). NFAT proteins have been directly implicated in the regulation of stem cell proliferation (41). We report here a critical role for NFATC4 in the regulation of cellular quiescence in ovarian cancer. Expression of constitutively nuclear NFATC4 suppressed cellular proliferation, reduced cell size, and arrested tumor growth. Furthermore, consistent with previous reports (42, 43), we find that NFATC4 activity contributed to chemotherapy resistance, both in vitro and in vivo. Finally, NFATC4 induction repressed MYC, which contributed to a quiescent state.
NFAT family members and regulation of quiescence.
We identified NFATC4 as a potential regulator of quiescence in ovarian cancer. Previously NFATC1 was identified as regulating quiescence in the hair follicle. More recently, a study of NFATC3 in the brain (44) observed significant changes in cell proliferation and vital dye retention with NFATC3 inhibition. These studies implicate the NFAT family of transcription factors as regulators of quiescence.
The complete mechanism through which NFAT regulates proliferation/quiescence is unclear. In the hair follicle, NFAT regulates CDK4 to arrest cell cycle progression (5). We did not observe similar mechanisms here; however, we did observe NFATC4 expression correlated with a downregulation of MYC, while MYC overexpression was able to partially rescue the quiescent phenotype following early, but not late, induction of NFATC4. This observation suggests that although downregulation of MYC could be an important part of the induction of a quiescent phenotype, there are secondary mechanisms downstream of NFATC4 that are critical in the maintenance of the quiescent state. Future work is required to elucidate the mechanism responsible for NFATC4-induced quiescence.
NFATC4 and chemotherapy resistance.
NFATC4 has been poorly studied in cancer. In normal physiologic states, NFATC4 appears to function partly as a general stress response protein, as it serves a protective role in cardiomyocytes in response to radiation (45), is activated by mechanical stress in the heart (46) and bladder (47), and serves as a protective factor during hypoxia (48). NFATC4 may serve as a similar stress regulator in cancer cells to promote survival. We have shown that NFATC4 translocates to the nucleus and initiates transcription in response to cisplatin chemotherapy and drives chemotherapy resistance. Similarly, NFATC4 expression is linked with therapeutic response in gastric cancer (49). Paclitaxel’s partial induction of the NFATC4 pathway may be a result of its limited ability to increase intracellular calcium (50), while increasing intracellular calcium is a key mechanism by which cisplatin functions (51).
Consistent with a role for NFATC4 in CSCs, NFATC4 plays a role in pancreatic cell plasticity and tumor initiation (52). Consistent with the data above, survival data demonstrating dysregulation or high expression of NFATC4 leads to worse prognosis of ovarian cancer patients suggest NFATC4 may be an important therapeutic target in ovarian cancer to overcome the chemotherapy resistance associated with slow-cycling cells. This hypothesis is supported by studies on cyclosporine, a commonly used immunosuppressant, which inhibits the NFAT family. Cyclosporine has shown activity as a chemosensitizer in a phase II clinical trial, demonstrating that cyclosporine could improve response to therapy in patients with chemotherapy-refractory disease (53, 54). However, this has not been reproducible (55) and has not been tested in patients with chemotherapy-naive disease, who may benefit the most from the elimination of slow-cycling cells. Furthermore, as cyclosporine affects all NFAT family members, and is not selective for cancer cells, suppression of immunity may limit efficacy. NFATC4 is the only core NFAT family member that is not expressed in the immune system (56); thus, the development of specific NFATC4 inhibitors could allow chemosensitization of the NFATC4-expressing CSCs without concomitant immunosuppression.
In summary, we have found that the master transcriptional regulator NFATC4 induces a quiescent state in ovarian cancer and translocates to the nucleus in response to chemotherapy. Constitutively nuclear NFATC4 is associated with a reduction in cellular size and proliferation and the induction of chemotherapy resistance. NFATC4 promotes the quiescent phenotype by early downregulation of MYC; however, other mechanisms are responsible for maintaining an established quiescent phenotype. Taken together, these data suggest NFATC4 is an important therapeutic target in ovarian cancer that warrants significant further investigation.
Methods
Cell culture.
The A2780 cell line was obtained from Susan Murphy at Duke University (Durham, North Carolina, USA). SKOV3, CaOV3, and HEY1 lines were purchased from ATCC. OVSAHO cells were a gift from Deborah Marsh from the University of Sydney (Sydney, New South Wales, Australia). COV362 cells were purchased from Sigma-Aldrich. All cells were cultured in RPMI-1640 medium with 10% FBS and 1% penicillin/streptomycin at 37°C and 5% CO2.
Constructs.
Both constructs used in this study were designed to result in constitutively nuclear NFATC4. A constitutively nuclear NFATC4-YFP fusion (cNFATC4) with the phospho-regulatory domain deleted or a YFP-only control (control-YFP) was subcloned into a pGIPZ lentiviral vector and transduced into the A2780, CaOV3, OVSAHO, and COV362 ovarian cancer cell lines. A second, phospho-specific, mutant, constitutively active NFATC4 (18) was also subcloned into the doxycycline-inducible Tet-One expression system (Clontech) to create an inducible and constitutive NFATC4 (IcNFATC4) in the HEY1 ovarian cancer line. This was paired with an inducible luciferase control (ILuc) to control for overexpression. Details regarding the structure and validation of all constructs are presented in the Results section (Figure 4). Because the only known function of NFAT proteins is transcription, the phospho-mutants used were constitutively nuclear and therefore constitutively active. A pcDNA3-MYC construct was purchased from Addgene (plasmid 16011).
Patient samples.
Fresh high-grade serous ovarian carcinomas (HGSOCs) were acquired from the University of Michigan’s Comprehensive Cancer Center. Fresh tumor samples were dissociated using a Tumor Dissociation Kit (Miltenyi Biotec) and cultured using standard conditions. HGSOC diagnosis was confirmed using immunohistochemistry. All the patient tumor samples used were derived from primary debulking of patients with stage IIIC HGSC.
CFSE assay.
HEY1, COV362, OVSAHO, and CaOV3 cell lines were stained with 2.5 μM of CellTrace CFSE Cell Proliferation Kit (Thermo Fisher Scientific) for 20 minutes at 37°C, washed, and then grown for 5–7 days. The top 4% bright cells, 10% medium cells, and bottom 4% dim cells were FACS isolated. RNA was extracted and qPCR performed to validate NFATC4 expression (as below).
Quantitative PCR.
RNA was extracted using RNeasy Mini Kit (QIAGEN), and cDNA was made using SuperScript III Reverse Transcriptase kit (Thermo Fisher Scientific). qPCR was performed using SYBR Green PCR Master Mix (Applied Biosystems, Thermo Fisher Scientific) using standard cycling conditions. The primers used for this study are available in the supplemental material (Supplemental Table 2).
Cell counting.
Cell counts were performed using the Moxi Z automated counting system and the Cassettes Type S (ORFLO Technologies). For trypan blue staining, the Countess automated cell counter (Invitrogen, Thermo Fisher Scientific) was used with Countess Cell Counting Chamber Slides.
BrdU labeling.
A2780 cells were treated with 10 μM BrdU labeling solution and incubated for 4 hours at 37°C in a CO2 incubator. Cells were washed with PBS, fixed with 4% paraformaldehyde, and permeabilized with 0.1% Triton X-100. Standard immunocytochemistry (ICC) protocol was followed. Cells were then incubated in 2.5 M HCl for 30 minutes at room temperature, then washed with PBS. Standard ICC protocol was then followed.
Microfluidics.
A2780 control-YFP or cNFATC4 cells were loaded into single-cell capture microfluidic chips from the University of Michigan. Cells’ mitoses were tracked using a microscope over a 3-day period and results were recorded. Cell viability was confirmed using LIVE/DEAD cell staining (Abcam) at the termination of the experiment.
Size analysis.
HEY1 and SKOV3 cells expressing the ILuc and IcNFATC4 constructs were pretreated with doxycycline, then plated into a 96-well plate at 300 and 1000 cells/well, respectively, and placed into the IncuCyte (Sartorius). Cells were treated with or without doxycycline and grown for 36 hours. Images were taken at 36 hours while making sure the confluence was comparable between the doxycycline-treated and untreated control cells (Supplemental Figure 5A). Images were imported into ImageJ (NIH), and cell size was calculated by drawing around cells and quantifying their area.
FUCCI.
HEY1 cells expressing the IcNFATC4 or ILuc constructs were transduced with the p27-mVenus and CDT1-mCherry FUCCI cell cycle reporter constructs (13). Cells expressing both constructs were isolated using FACS and plated in the IncuCyte and grown for 90 hours. Fluorescence was measured, and percentages of green, red, yellow, and unstained cells were quantitated. G1/S phase cells expressing the constructs were FACS isolated and grown for 3 additional days to determine whether they retained the cell cycle phases as a result of the NFATC4 overexpression.
Annexin V staining.
For apoptosis detection via annexin staining, HEY1 ILuc and IcNFATC4 cells were grown in 6-well dishes with or without doxycycline for 72 hours. Cells were stained with the FITC Annexin V Apoptosis Detection Kit (BD Biosciences) according to the manufacturer’s instructions, and at least 10,000 events were analyzed on the MoFlo Astrios flow cytometer (Beckman Coulter). The percentage of annexin V+, PI+, annexin V+PI+, and annexin V–PI– cells was quantified.
SABG staining.
Cells were plated on tissue culture coverslips, allowed to grow for 96 hours, and fixed, and then SABG staining was done as previously described (57).
IncuCyte growth curves.
HEY1 and SKOV3 cells expressing the ILuc or IcNFATC4 constructs were seeded at 300 and 1000 cells per well, respectively, in a 96-well plate. For growth curves, cells were treated with or without 100 ng/mL doxycycline for 96 hours. For cisplatin curves, cells were treated with 9.5 μg/mL cisplatin for 72 hours with or without cotreatment with 100 ng/mL doxycycline. IncuCyte images were taken every 4 hours and cell confluence was recorded.
Immunofluorescence.
Cell lines, or frozen tissue sections, were fixed with 4% paraformaldehyde and permeabilized with 0.1% Triton X-100. Cells were blocked with 10% horse serum or 2% BSA and incubated with 1:100 mouse anti-NFATC4 antibody (Santa Cruz Biotechnology, sc-271597) or 1:200 rabbit anti-MKI67 antibody (MilliporeSigma, HPA000451) in 0.5% BSA overnight or 5% horse serum for 2 hours. Slides were washed 3 times for 5 minutes with PBS. Cells were incubated with an Alexa Fluor 488 anti-mouse or Cy5 anti-rabbit secondary antibody (both 1:500, A32723 and A10523, Thermo Fisher Scientific), mounted with DAPI mounting medium (Vector Labs), and then imaged on an Olympus BX41 microscope.
In vivo xenografts.
NOD/SCID/IL2R-KO or nude mice (colonies from the University of Michigan and the University of Pittsburgh) were injected with 500,000 control-YFP or cNFATC4 cells or 300,000 ILuc or IcNFATC4 cells for tumor xenograft experiments. Animals were maintained at 12-hour light/12-hour dark cycles under specific pathogen–free conditions with free access to food and water. For induction, 2 mg/mL doxycycline was administered in the water along with 5% sucrose to mask its bitter taste. Tumors were monitored once a week initially and twice a week after tumors reached 1000 mm3, and animals were sacrificed at protocol endpoints. All experiments were conducted in accordance with the animal care and use committee from the University of Michigan.
Statistics.
Statistical analysis was conducted using GraphPad Prism (8.0.2) and VassarStats (http://vassarstats.net/). All data were analyzed using 2-tailed t tests or 1-way ANOVAs. Data represent mean ± SEM. A P value of less than 0.05 was considered statistically significant.
Study approval.
Informed consent was obtained from all patients before tissue procurement. All studies were performed with the approval of the Institutional Review Board of the University of Michigan. All mouse experiments were conducted with the approval of the IACUCs at the University of Michigan and the University of Pittsburgh.
Author contributions
AJC and MI conducted the majority of the experiments. RJB and SB conceived the project and planned the experiments. SPG, PO, EY, and DC helped with the experiments. GMD, KMA, and EY reviewed the manuscript. AJC, MI, and RJB wrote the manuscript.
Supplementary Material
Acknowledgments
Funding for this work was provided by Ann and Sol Schreiber Mentored Investigator Award (599997) from the Ovarian Cancer Research Alliance, Department of Defense award W81XWH-15-1-0083, and NIH R01 award 1R01CA203810.
Version 1. 03/17/2020
In-Press Preview
Version 2. 04/09/2020
Electronic publication
Footnotes
Conflict of interest: The authors have declared that no conflict of interest exists.
Copyright: © 2020, American Society for Clinical Investigation.
Reference information: JCI Insight. 2020;5(7):e131486.https://doi.org/10.1172/jci.insight.131486.
Contributor Information
Alexander J. Cole, Email: acol9471@uni.sydney.edu.au.
Mangala Iyengar, Email: mangala.iyengar@gmail.com.
Santiago Panesso-Gómez, Email: panessos@upmc.edu.
Greg M. Delgoffe, Email: delgoffeg@upmc.edu.
Katherine M. Aird, Email: kaird@psu.edu.
Euisik Yoon, Email: esyoon@umich.edu.
Shoumei Bai, Email: bais@mwri.magee.edu.
Ronald J. Buckanovich, Email: buckanovichrj@mwri.magee.edu.
References
- 1.Siegel RL, Miller KD, Jemal A. Cancer statistics, 2018. CA Cancer J Clin. 2018;68(1):7–30. doi: 10.3322/caac.21442. [DOI] [PubMed] [Google Scholar]
- 2.Ushijima K. Treatment for recurrent ovarian cancer-at first relapse. J Oncol. 2010;2010:497429. doi: 10.1155/2010/497429. [DOI] [PMC free article] [PubMed] [Google Scholar]
- 3.Yoshihara H, et al. Thrombopoietin/MPL signaling regulates hematopoietic stem cell quiescence and interaction with the osteoblastic niche. Cell Stem Cell. 2007;1(6):685–697. doi: 10.1016/j.stem.2007.10.020. [DOI] [PubMed] [Google Scholar]
- 4.Zeuner A, et al. Elimination of quiescent/slow-proliferating cancer stem cells by Bcl-XL inhibition in non-small cell lung cancer. Cell Death Differ. 2014;21(12):1877–1888. doi: 10.1038/cdd.2014.105. [DOI] [PMC free article] [PubMed] [Google Scholar]
- 5.Horsley V, Aliprantis AO, Polak L, Glimcher LH, Fuchs E. NFATc1 balances quiescence and proliferation of skin stem cells. Cell. 2008;132(2):299–310. doi: 10.1016/j.cell.2007.11.047. [DOI] [PMC free article] [PubMed] [Google Scholar]
- 6.Jin K, Ewton DZ, Park S, Hu J, Friedman E. Mirk regulates the exit of colon cancer cells from quiescence. J Biol Chem. 2009;284(34):22916–22925. doi: 10.1074/jbc.M109.035519. [DOI] [PMC free article] [PubMed] [Google Scholar]
- 7.Saito Y, et al. Induction of cell cycle entry eliminates human leukemia stem cells in a mouse model of AML. Nat Biotechnol. 2010;28(3):275–280. doi: 10.1038/nbt.1607. [DOI] [PMC free article] [PubMed] [Google Scholar]
- 8.Vanner RJ, et al. Quiescent sox2(+) cells drive hierarchical growth and relapse in sonic hedgehog subgroup medulloblastoma. Cancer Cell. 2014;26(1):33–47. doi: 10.1016/j.ccr.2014.05.005. [DOI] [PMC free article] [PubMed] [Google Scholar]
- 9.Cole AJ, Fayomi AP, Anyaeche VI, Bai S, Buckanovich RJ. An evolving paradigm of cancer stem cell hierarchies therapeutic implications. Theranostics. 2020;10(7):3083–3098. doi: 10.7150/thno.41647. [DOI] [PMC free article] [PubMed] [Google Scholar]
- 10.Silva IA, et al. Aldehyde dehydrogenase in combination with CD133 defines angiogenic ovarian cancer stem cells that portend poor patient survival. Cancer Res. 2011;71(11):3991–4001. doi: 10.1158/0008-5472.CAN-10-3175. [DOI] [PMC free article] [PubMed] [Google Scholar]
- 11.Mani SA, et al. The epithelial-mesenchymal transition generates cells with properties of stem cells. Cell. 2008;133(4):704–715. doi: 10.1016/j.cell.2008.03.027. [DOI] [PMC free article] [PubMed] [Google Scholar]
- 12.Choi YJ, et al. Identifying an ovarian cancer cell hierarchy regulated by bone morphogenetic protein 2. Proc Natl Acad Sci U S A. 2015;112(50):E6882–E6888. doi: 10.1073/pnas.1507899112. [DOI] [PMC free article] [PubMed] [Google Scholar]
- 13.Oki T, et al. A novel cell-cycle-indicator, mVenus-p27K-, identifies quiescent cells and visualizes G0-G1 transition. Sci Rep. 2014;4:4012. doi: 10.1038/srep04012. [DOI] [PMC free article] [PubMed] [Google Scholar]
- 14.Deleyrolle LP, Rohaus MR, Fortin JM, Reynolds BA, Azari H. Identification and isolation of slow-dividing cells in human glioblastoma using carboxy fluorescein succinimidyl ester (CFSE) J Vis Exp. 2012;(62):3918. doi: 10.3791/3918. [DOI] [PMC free article] [PubMed] [Google Scholar]
- 15.Cancer Genome Atlas Research Network Integrated genomic analyses of ovarian carcinoma. Nature. 2011;474(7353):609–615. doi: 10.1038/nature10166. [DOI] [PMC free article] [PubMed] [Google Scholar]
- 16.Gyorffy B, Lánczky A, Szállási Z. Implementing an online tool for genome-wide validation of survival-associated biomarkers in ovarian-cancer using microarray data from 1287 patients. Endocr Relat Cancer. 2012;19(2):197–208. doi: 10.1530/ERC-11-0329. [DOI] [PubMed] [Google Scholar]
- 17.Bai S, Kerppola TK. Opposing roles of FoxP1 and Nfat3 in transcriptional control of cardiomyocyte hypertrophy. Mol Cell Biol. 2011;31(14):3068–3080. doi: 10.1128/MCB.00925-10. [DOI] [PMC free article] [PubMed] [Google Scholar] [Retracted]
- 18.Graef IA, et al. L-type calcium channels and GSK-3 regulate the activity of NF-ATc4 in hippocampal neurons. Nature. 1999;401(6754):703–708. doi: 10.1038/44378. [DOI] [PubMed] [Google Scholar]
- 19.Ruff VA, Leach KL. Direct demonstration of NFATp dephosphorylation and nuclear localization in activated HT-2 cells using a specific NFATp polyclonal antibody. J Biol Chem. 1995;270(38):22602–22607. doi: 10.1074/jbc.270.38.22602. [DOI] [PubMed] [Google Scholar]
- 20.Beals CR, Clipstone NA, Ho SN, Crabtree GR. Nuclear localization of NF-ATc by a calcineurin-dependent, cyclosporin-sensitive intramolecular interaction. Genes Dev. 1997;11(7):824–834. doi: 10.1101/gad.11.7.824. [DOI] [PubMed] [Google Scholar]
- 21.Lee MY, et al. Integrative genomics identifies DSCR1 (RCAN1) as a novel NFAT-dependent mediator of phenotypic modulation in vascular smooth muscle cells. Hum Mol Genet. 2010;19(3):468–479. doi: 10.1093/hmg/ddp511. [DOI] [PMC free article] [PubMed] [Google Scholar]
- 22.Pisconti A, et al. Follistatin induction by nitric oxide through cyclic GMP: a tightly regulated signaling pathway that controls myoblast fusion. J Cell Biol. 2006;172(2):233–244. doi: 10.1083/jcb.200507083. [DOI] [PMC free article] [PubMed] [Google Scholar] [Retracted]
- 23.Anglesio MS, et al. Type-specific cell line models for type-specific ovarian cancer research. PLoS One. 2013;8(9):e72162. doi: 10.1371/journal.pone.0072162. [DOI] [PMC free article] [PubMed] [Google Scholar]
- 24.Mognol GP, Carneiro FR, Robbs BK, Faget DV, Viola JP. Cell cycle and apoptosis regulation by NFAT transcription factors: new roles for an old player. Cell Death Dis. 2016;7:e2199. doi: 10.1038/cddis.2016.97. [DOI] [PMC free article] [PubMed] [Google Scholar]
- 25.Kuilman T, Michaloglou C, Mooi WJ, Peeper DS. The essence of senescence. Genes Dev. 2010;24(22):2463–2479. doi: 10.1101/gad.1971610. [DOI] [PMC free article] [PubMed] [Google Scholar]
- 26.Rumman M, Dhawan J, Kassem M. Concise review: quiescence in adult stem cells: biological significance and relevance to tissue regeneration. Stem Cells. 2015;33(10):2903–2912. doi: 10.1002/stem.2056. [DOI] [PubMed] [Google Scholar]
- 27.Moore N, Lyle S. Quiescent, slow-cycling stem cell populations in cancer: a review of the evidence and discussion of significance. J Oncol. 2011;2011:396076. doi: 10.1155/2011/396076. [DOI] [PMC free article] [PubMed] [Google Scholar]
- 28.Naumov GN, et al. Ineffectiveness of doxorubicin treatment on solitary dormant mammary carcinoma cells or late-developing metastases. Breast Cancer Res Treat. 2003;82(3):199–206. doi: 10.1023/B:BREA.0000004377.12288.3c. [DOI] [PubMed] [Google Scholar]
- 29.Dembinski JL, Krauss S. Characterization and functional analysis of a slow cycling stem cell-like subpopulation in pancreas adenocarcinoma. Clin Exp Metastasis. 2009;26(7):611–623. doi: 10.1007/s10585-009-9260-0. [DOI] [PMC free article] [PubMed] [Google Scholar]
- 30.Roehrl MH, Kang S, Aramburu J, Wagner G, Rao A, Hogan PG. Selective inhibition of calcineurin-NFAT signaling by blocking protein-protein interaction with small organic molecules. Proc Natl Acad Sci U S A. 2004;101(20):7554–7559. doi: 10.1073/pnas.0401835101. [DOI] [PMC free article] [PubMed] [Google Scholar]
- 31.Singh G, et al. Sequential activation of NFAT and c-Myc transcription factors mediates the TGF-beta switch from a suppressor to a promoter of cancer cell proliferation. J Biol Chem. 2010;285(35):27241–27250. doi: 10.1074/jbc.M110.100438. [DOI] [PMC free article] [PubMed] [Google Scholar]
- 32.Köenig A, et al. NFAT-induced histone acetylation relay switch promotes c-Myc-dependent growth in pancreatic cancer cells. Gastroenterology. 2010;138(3):1189–99.e1. doi: 10.1053/j.gastro.2009.10.045. [DOI] [PMC free article] [PubMed] [Google Scholar]
- 33.Buchholz M, et al. Overexpression of c-myc in pancreatic cancer caused by ectopic activation of NFATc1 and the Ca2+/calcineurin signaling pathway. EMBO J. 2006;25(15):3714–3724. doi: 10.1038/sj.emboj.7601246. [DOI] [PMC free article] [PubMed] [Google Scholar]
- 34.Dang CV. MYC on the path to cancer. Cell. 2012;149(1):22–35. doi: 10.1016/j.cell.2012.03.003. [DOI] [PMC free article] [PubMed] [Google Scholar]
- 35.Ricci MS, et al. Direct repression of FLIP expression by c-myc is a major determinant of TRAIL sensitivity. Mol Cell Biol. 2004;24(19):8541–8555. doi: 10.1128/MCB.24.19.8541-8555.2004. [DOI] [PMC free article] [PubMed] [Google Scholar]
- 36.Bushdid PB, Osinska H, Waclaw RR, Molkentin JD, Yutzey KE. NFATc3 and NFATc4 are required for cardiac development and mitochondrial function. Circ Res. 2003;92(12):1305–1313. doi: 10.1161/01.RES.0000077045.84609.9F. [DOI] [PubMed] [Google Scholar]
- 37.McCaffrey PG, et al. Isolation of the cyclosporin-sensitive T cell transcription factor NFATp. Science. 1993;262(5134):750–754. doi: 10.1126/science.8235597. [DOI] [PubMed] [Google Scholar]
- 38.Northrop JP, et al. NF-AT components define a family of transcription factors targeted in T-cell activation. Nature. 1994;369(6480):497–502. doi: 10.1038/369497a0. [DOI] [PubMed] [Google Scholar]
- 39.Hoey T, Sun YL, Williamson K, Xu X. Isolation of two new members of the NF-AT gene family and functional characterization of the NF-AT proteins. Immunity. 1995;2(5):461–472. doi: 10.1016/1074-7613(95)90027-6. [DOI] [PubMed] [Google Scholar]
- 40.Wilkins BJ, et al. Targeted disruption of NFATc3, but not NFATc4, reveals an intrinsic defect in calcineurin-mediated cardiac hypertrophic growth. Mol Cell Biol. 2002;22(21):7603–7613. doi: 10.1128/MCB.22.21.7603-7613.2002. [DOI] [PMC free article] [PubMed] [Google Scholar]
- 41.Huang T, Xie Z, Wang J, Li M, Jing N, Li L. Nuclear factor of activated T cells (NFAT) proteins repress canonical Wnt signaling via its interaction with Dishevelled (Dvl) protein and participate in regulating neural progenitor cell proliferation and differentiation. J Biol Chem. 2011;286(43):37399–37405. doi: 10.1074/jbc.M111.251165. [DOI] [PMC free article] [PubMed] [Google Scholar]
- 42.Lin H, et al. Activation of a nuclear factor of activated T-lymphocyte-3 (NFAT3) by oxidative stress in carboplatin-mediated renal apoptosis. Br J Pharmacol. 2010;161(7):1661–1676. doi: 10.1111/j.1476-5381.2010.00989.x. [DOI] [PMC free article] [PubMed] [Google Scholar]
- 43.Gopinath S, Vanamala SK, Gujrati M, Klopfenstein JD, Dinh DH, Rao JS. Doxorubicin-mediated apoptosis in glioma cells requires NFAT3. Cell Mol Life Sci. 2009;66(24):3967–3978. doi: 10.1007/s00018-009-0157-5. [DOI] [PMC free article] [PubMed] [Google Scholar]
- 44.Serrano-Pérez MC, et al. NFAT transcription factors regulate survival, proliferation, migration, and differentiation of neural precursor cells. Glia. 2015;63(6):987–1004. doi: 10.1002/glia.22797. [DOI] [PubMed] [Google Scholar]
- 45.Coleman MA, et al. Low-dose radiation affects cardiac physiology: gene networks and molecular signaling in cardiomyocytes. Am J Physiol Heart Circ Physiol. 2015;309(11):H1947–H1963. doi: 10.1152/ajpheart.00050.2015. [DOI] [PMC free article] [PubMed] [Google Scholar]
- 46.Finsen AV, et al. Syndecan-4 is essential for development of concentric myocardial hypertrophy via stretch-induced activation of the calcineurin-NFAT pathway. PLoS One. 2011;6(12):e28302. doi: 10.1371/journal.pone.0028302. [DOI] [PMC free article] [PubMed] [Google Scholar]
- 47.Chang AY, et al. Calcineurin mediates bladder wall remodeling secondary to partial outlet obstruction. Am J Physiol Renal Physiol. 2011;301(4):F813–F822. doi: 10.1152/ajprenal.00586.2010. [DOI] [PMC free article] [PubMed] [Google Scholar]
- 48.Moreno M, Fernández V, Monllau JM, Borrell V, Lerin C, de la Iglesia N. Transcriptional profiling of hypoxic neural stem cells identifies calcineurin-NFATc4 signaling as a major regulator of neural stem cell biology. Stem Cell Reports. 2015;5(2):157–165. doi: 10.1016/j.stemcr.2015.06.008. [DOI] [PMC free article] [PubMed] [Google Scholar]
- 49.Zhang X, Kang T, Zhang L, Tong Y, Ding W, Chen S. NFATc3 mediates the sensitivity of gastric cancer cells to arsenic sulfide. Oncotarget. 2017;8(32):52735–52745. doi: 10.18632/oncotarget.17175. [DOI] [PMC free article] [PubMed] [Google Scholar]
- 50.Zhang K, Heidrich FM, DeGray B, Boehmerle W, Ehrlich BE. Paclitaxel accelerates spontaneous calcium oscillations in cardiomyocytes by interacting with NCS-1 and the InsP3R. J Mol Cell Cardiol. 2010;49(5):829–835. doi: 10.1016/j.yjmcc.2010.08.018. [DOI] [PMC free article] [PubMed] [Google Scholar]
- 51.Kerkhofs M, et al. Emerging molecular mechanisms in chemotherapy: Ca2+ signaling at the mitochondria-associated endoplasmic reticulum membranes. Cell Death Dis. 2018;9(3):334. doi: 10.1038/s41419-017-0179-0. [DOI] [PMC free article] [PubMed] [Google Scholar]
- 52.Hessmann E, et al. NFATc4 regulates Sox9 gene expression in acinar cell plasticity and pancreatic cancer initiation. Stem Cells Int. 2016;2016:5272498. doi: 10.1155/2016/5272498. [DOI] [PMC free article] [PubMed] [Google Scholar]
- 53.Morgan RJ, et al. Phase II trial of carboplatin and infusional cyclosporine in platinum-resistant recurrent ovarian cancer. Cancer Chemother Pharmacol. 2004;54(4):283–289. doi: 10.1007/s00280-004-0818-x. [DOI] [PubMed] [Google Scholar]
- 54.Chambers SK, Davis CA, Chambers JT, Schwartz PE, Lorber MI, Hschumacher RE. Phase I trial of intravenous carboplatin and cyclosporin A in refractory gynecologic cancer patients. Clin Cancer Res. 1996;2(10):1699–1704. [PubMed] [Google Scholar]
- 55.Manetta A, Blessing JA, Hurteau JA. Evaluation of cisplatin and cyclosporin A in recurrent platinum-resistant ovarian cancer: a phase II study of the gynecologic oncology group. Gynecol Oncol. 1998;68(1):45–46. doi: 10.1006/gyno.1997.4887. [DOI] [PubMed] [Google Scholar]
- 56.Mancini M, Toker A. NFAT proteins: emerging roles in cancer progression. Nat Rev Cancer. 2009;9(11):810–820. doi: 10.1038/nrc2735. [DOI] [PMC free article] [PubMed] [Google Scholar]
- 57.Iyengar M, et al. CDK4/6 inhibition as maintenance and combination therapy for high grade serous ovarian cancer. Oncotarget. 2018;9(21):15658–15672. doi: 10.18632/oncotarget.24585. [DOI] [PMC free article] [PubMed] [Google Scholar]
Associated Data
This section collects any data citations, data availability statements, or supplementary materials included in this article.


