Abstract
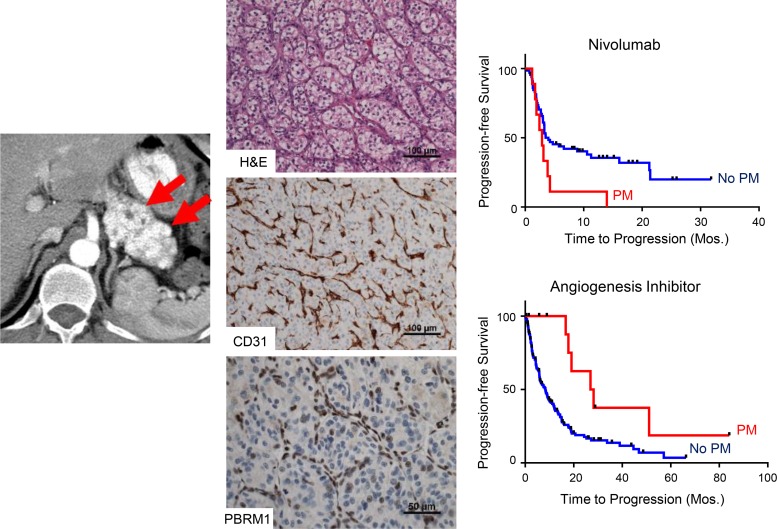
Renal cell carcinoma (RCC) is characterized by a particularly broad metastatic swath, and, enigmatically, when the pancreas is a destination, the disease is associated with improved survival. Intrigued by this observation, we sought to characterize the clinical behavior, therapeutic implications, and underlying biology. While pancreatic metastases (PM) are infrequent, we identified 31 patients across 2 institutional cohorts and show that improved survival is independent of established prognostic variables, that these tumors are exquisitely sensitive to antiangiogenic agents and resistant to immune checkpoint inhibitors (ICIs), and that they are characterized by a distinctive biology. Primary tumors of patients with PM exhibited frequent PBRM1 mutations, 3p loss, and 5q amplification, along with a lower frequency of aggressive features such as BAP1 mutations and loss of 9p, 14q, and 4q. Gene expression analyses revealed constrained evolution with remarkable uniformity, reduced effector T cell gene signatures, and increased angiogenesis. Similar findings were observed histopathologically. Thus, RCC metastatic to the pancreas is characterized by indolent biology, heightened angiogenesis, and an uninflamed stroma, likely underlying its good prognosis, sensitivity to antiangiogenic therapies, and refractoriness to ICI. These data suggest that metastatic organotropism may be an indicator of a particular biology with prognostic and treatment implications for patients.
Keywords: Oncology
Keywords: Urology
Metastatic organotropism may be an indicator of a particular biology with prognostic and treatment implications for patients.
Introduction
Clear cell renal cell carcinoma (ccRCC) is unique in its capacity to metastasize to nearly any site in the body, including uncommon sites like the tongue, salivary glands, spleen, testes, and pancreas (1–3). While metastases to the pancreas are infrequent, when they are found, ccRCC is a frequent primary site (4–9). Pancreatic metastases (PM) may be found in isolation, but also in more broadly metastatic tumors (10, 11).
What makes PM tropism particularly interesting is that when metastasizing to the pancreas, ccRCC is associated with better outcomes in patients, and this is the case even when other metastatic sites are involved (6, 12–17). However, whether the improved prognosis can be accounted for by validated prognostic models, such as the international metastatic database consortium (IMDC), is not known. In addition, whether the improved outcomes are indicative of a particular biology, and whether this has implications for systemic therapy, is similarly unknown.
Here, in the largest and most comprehensive study of its kind, we sought to gain insight into the significance and biology of PM tropism.
Results
Improved overall survival in patients with PM is independent of validated prognostic models (IMDC) and extent of metastases.
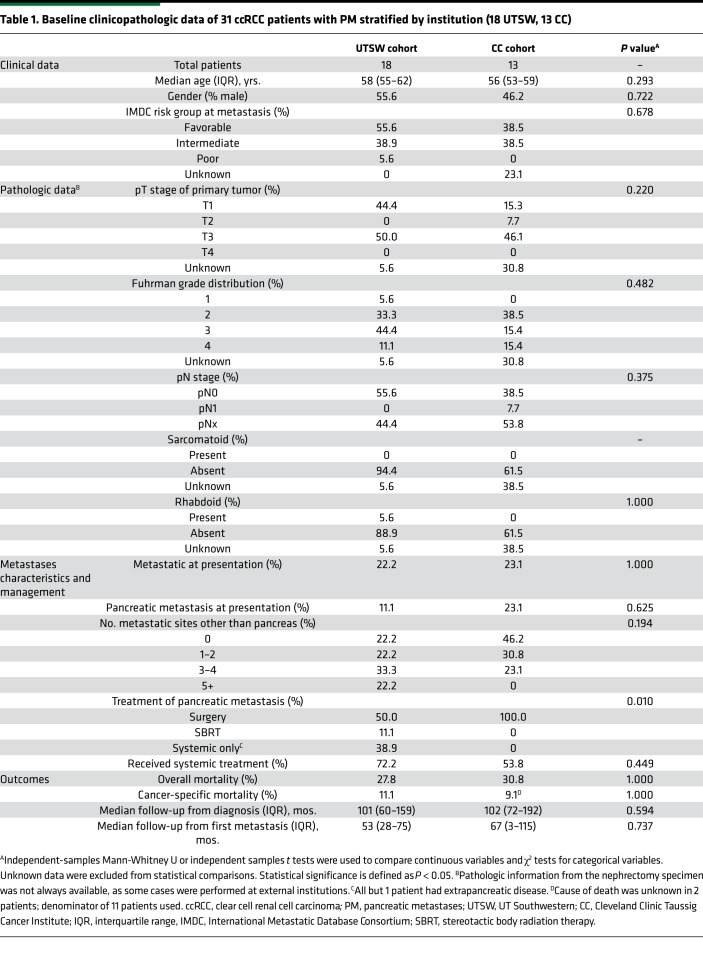
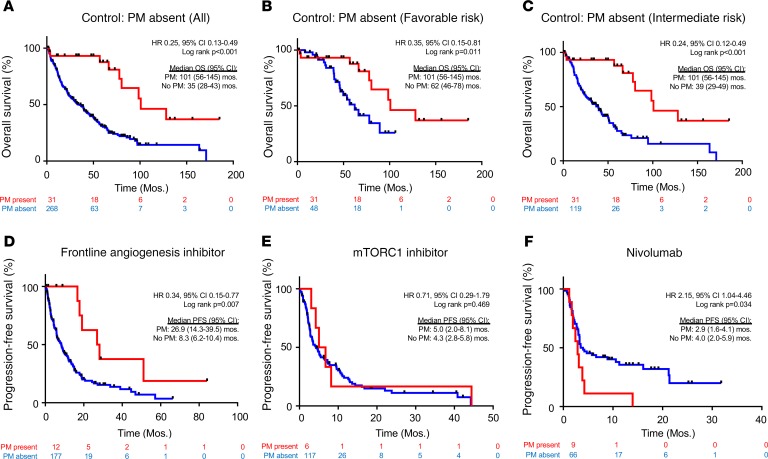
While metastases to the pancreas are infrequent, analyses across 2 institutions (UT Southwestern [UTSW] and Cleveland Clinic) identified 31 patients with PM (Table 1 and Supplemental Figure 1; supplemental material available online with this article; https://doi.org/10.1172/jci.insight.134564DS1). Table 1 shows clinicopathologic characteristics of the 2 cohorts and comparative analyses across both institutions. Both cohorts were similar overall except with respect to the use of nonsurgical approaches for PM management. Among the 31 patients, 10 patients (32%) had isolated PM and 21 (68%) had metastases to additional organ site(s). After a median follow-up of 101 months from initial diagnosis (57 months from first metastasis), 9 of 31 patients in the entire PM cohort had died, with 3 deaths definitively attributable to disease. We compared survival outcomes (from metastasis diagnosis) with a contemporaneous cohort of metastatic ccRCC patients without PM from UTSW. Patients with PM exhibited superior overall survival (OS) (median 101 months [8.4 years] vs. 35 months [2.9 years]; HR 0.25 [95% CI, 0.13–0.49]; P < 0.001). Five-year survival rates were 88% in patients with PM versus 31% in historic controls (P < 0.001) (Figure 1A).
Table 1. Baseline clinicopathologic data of 31 ccRCC patients with PM stratified by institution (18 UTSW, 13 CC).
Figure 1. Patients with PM have improved survival that is independent of the IMDC risk score and better disease control with angiogenesis inhibitors compared with other treatments.
(A) Kaplan-Meier survival analyses of PM cohort compared with a historical control of 268 metastatic ccRCC without PM. Kaplan-Meier survival analyses of PM cohort compared with a historical control in (B) favorable (n = 48) or (C) intermediate (n = 119) IMDC risk groups. Time is measured from metastatic diagnosis. (D) PFS in metastatic ccRCC patients treated with first-line angiogenic inhibitors, stratified by the presence (n = 12) or absence (n = 177) of PM. PFS with (E) mTORC1 inhibitors (6 patients with vs. 117 patients without PM) and (F) nivolumab (9 patients with vs. 66 patients without PM). PM, pancreatic metastases; ccRCC, clear cell renal cell carcinoma; IMDC, International Metastatic Database Consortium; PFS, progression-free survival; mTORC1, mTOR complex 1.
To determine whether the differences in survival could be explained by previously validated prognostic factors, we controlled for IMDC risk group. All but 1 patient with PM were in a favorable or intermediate risk group by IMDC criteria (Table 1). We evaluated OS rates in the PM cohort compared with the historical non-PM cohort after adjusting for favorable or intermediate risk disease. Patients with PM demonstrated superior OS in both favorable (HR 0.35 [95% CI, 0.15–0.81]; P = 0.011; Figure 1B) and intermediate (HR 0.24 [95% CI, 0.12–0.49]; P < 0.001; Figure 1C) risk patients. Thus, the improved OS in patients with PM cannot be accounted for by established prognostic factors.
Next, we assessed the value of IMDC criteria in predicting survival specifically in patients with PM. We asked whether overall and cancer-specific survival in patients with PM could be estimated by IMDC group. We compared patients with PM in an IMDC favorable group (n = 15) with those in an intermediate/poor group (n = 13). While the numbers were small, no apparent difference was observed in the Kaplan-Meier curves (Supplemental Figure 2, A and B). These data show that current risk stratification tools have limited utility in patients with PM. At least in this context, clinical and laboratory parameters that comprise current prognostic models, therefore, do not sufficiently capture the heterogeneous behavior of RCC.
One potential explanation for the improved outcomes may be that PM develop in isolation and that PM by themselves may not affect survival. However, nearly 70% of the patients in our cohort had metastases to other sites in addition to the pancreas. Further, we found that OS did not vary significantly according to the extent of metastases (Supplemental Figure 2C).
Patients with PM exhibit favorable response to angiogenic inhibitors but resistance to nivolumab.
Next, we evaluated whether the presence of PM affected treatment responsiveness. Systemic therapies for ccRCC can be grouped into 3 categories: angiogenesis inhibitors, mTOR complex 1 (mTORC1) inhibitors, and immunotherapy, largely immune checkpoint inhibitors (ICIs). To assess whether the presence of PM impacted drug responsiveness, we evaluated progression-free survival (PFS) on each of these treatments. Because PFS for angiogenesis inhibitors varies depending upon the line of therapy (18), we focused on patients treated in the frontline. We found that median PFS in patients with PM was 26.9 versus 8.3 months in non-PM patients (HR 0.34 [95% CI, 0.15–0.77]; P = 0.007; Figure 1D). In contrast, there was no difference in PFS with mTORC1 inhibitors (everolimus and temsirolimus) (HR 0.71 [95% CI, 0.29–1.79]; P = 0.469) (Figure 1E). Finally, we tested nivolumab and found that patients with PM progressed more rapidly on nivolumab than patients without PM (2.9 vs. 4.0 months; HR 2.15 [95% CI, 1.04–4.46]; P = 0.034) (Figure 1F). Thus, patients with PM appear to be particularly responsive to angiogenesis inhibitors but resistant to nivolumab.
Histological analyses reveal limited heterogeneity, an extensive vascular network, and low grade.
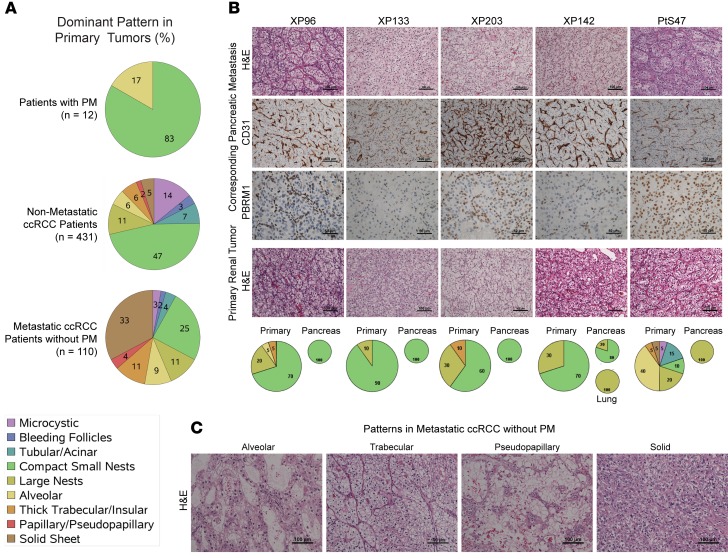
The finding of shared features, including indolent disease with favorable prognosis, responsiveness to angiogenesis inhibitors, and resistance to nivolumab, suggested that tumors with PM may represent a unique clade of ccRCC. To begin to explore this question, we performed detailed pathological analyses. These analyses centered on the UTSW cohort (n = 18), for which extensive pathology slides were available. While ccRCC are notoriously heterogeneous and multiple architectures have been reported (19, 20), we found that 83% of primary tumors were dominated by a single architecture — small, compact nests (Figure 2A). In contrast, a dominant compact nest pattern was found in only 25% of primary tumors leading to metastases outside the pancreas (P < 0.0001). The compact, small nest pattern consists of well-circumscribed, small acini of tumor cells with clear cytoplasm, compact nuclei, and indistinct, low-grade nucleoli. This pattern is characteristically associated with low-grade tumors and is the predominant pattern in nonmetastatic ccRCC (47% of primary tumors without metastases) (20). The pattern is quite different from more aggressive patterns found in metastatic RCC patients without PM (Figure 2C).
Figure 2. PM tumors are characterized by a homogeneous, small nest architectural pattern with a highly vascular network and infrequent inflammatory cells.
(A) Pie charts showing the distribution of architectures in primary tumors of patients with PM (n = 12) and reference pathology cohorts: patients without metastases (n = 431), and patients with non-PM metastases (n = 110). (B) H&E sections and IHC for PBRM1 and CD31 of PM as well as H&E sections of corresponding primary tumors. Pie charts of architectures corresponding to patients are shown below. (C) Architectural subtypes associated with more aggressive ccRCC. PM, pancreatic metastases; ccRCC, clear cell renal cell carcinoma.
Primary tumors of patients with PM were characterized by a prominent vascular network, evidenced by CD31 staining, and minimal, if any, inflammatory infiltrate (Figure 2B and Supplemental Figure 3). Similar findings were observed in pancreatic metastases (Figure 2B). The increased vascularity of PM likely explains the arterial enhancement characteristically observed on contrast imaging, which disappears with angiogenic inhibitors (Supplemental Figure 4). Overall, these data show that primary tumors that metastasize to the pancreas are characterized by a uniform architecture, limited diversity, low-grade tumor cells, and a highly vascular stroma devoid of inflammatory cells — findings that may contribute to explain the prognostic and predictive implications of tumors with PM.
Low aggressiveness mutation profiles of PM tumors.
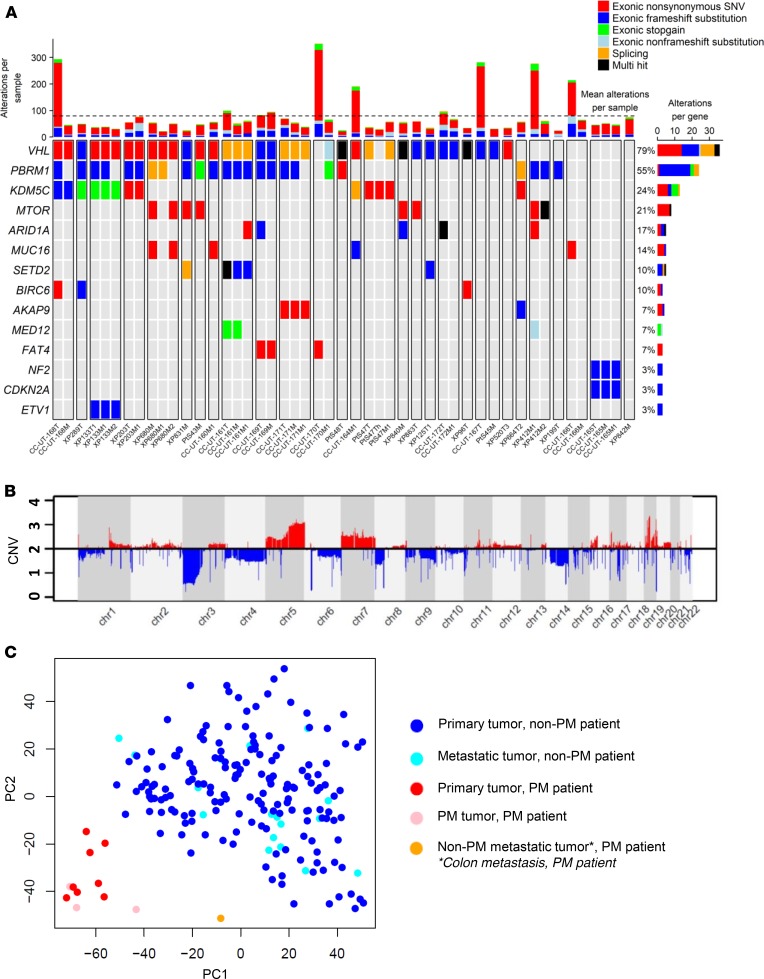
We performed whole exome sequencing (WES) to analyze the genomic landscape using our somatic mutation-calling pipeline and filtered the list for cancer genes based on the Catalogue of Somatic Mutations in Cancer (21) (Figure 3A and Supplemental Table 5). After VHL (79%), PBRM1 harbored the most mutations (55%), followed by the histone demethylase KDM5C (24%). We also found enrichment for MTOR mutations (21%), and these samples generally did not have KDM5C alterations. Other driver genes in ccRCC (22, 23) found to be mutated in our cohort included ARID1A (17%) and SETD2 (10%).
Figure 3. PM tumors are characterized by a mutational and copy number profile of less aggressive ccRCC, with clustered gene expression revealing constrained evolution.
(A) Oncoplot of somatic mutations based on the Catalogue of Somatic Mutations in Cancer in primary tumors (T suffix) and metastases (M suffix) from 31 patients with PM (separated by white lines). Most highly mutated genes are shown, with corresponding patient mutation percentages (left). (B) Average copy number alterations of primary and metastatic samples (n = 48) corresponding to 31 patients. (C) Principal component analysis of gene expression from fresh frozen PM primary tumors and metastases (n = 12) compared with controls (UT Southwestern) (Hotelling’s T-squared P < 1 × 10–16). PM, pancreatic metastases; ccRCC, clear cell renal cell carcinoma.
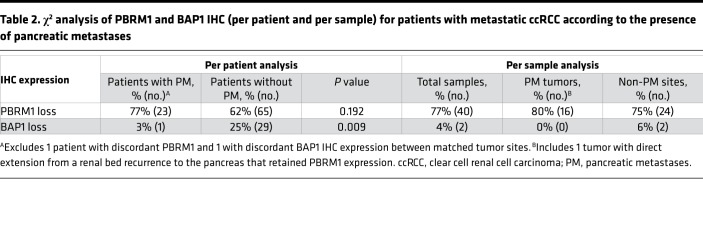
No driver mutations were found in TERT, which is associated with aggressive disease (24). Similarly, BAP1, which causes aggressive ccRCC (25–28), was mutated in only 2 samples, and neither sample was a primary tumor or PM (1 adrenal, 1 colon metastasis) (Supplemental Table 5). BAP1 is a tumor suppressor protein and mutations often cause loss of the protein. Loss of BAP1 protein can also be analyzed by IHC, which confirmed that all other samples expressed BAP1 (Table 2). By comparison, BAP1 loss was observed in 25% of patients with metastatic ccRCC without PM. The difference between these 2 cohorts was statistically significant (P = 0.009) (Table 2). These data support that BAP1 mutations, which are causative of ccRCC and drive aggressive disease (25, 29, 30), are infrequently found in tumors that metastasize to the pancreas.
Table 2. χ2 analysis of PBRM1 and BAP1 IHC (per patient and per sample) for patients with metastatic ccRCC according to the presence of pancreatic metastases.
We previously reported that PBRM1 loss is associated with improved outcomes in patients (30), and further expanded our mutational studies with IHC analyses. We found that PBRM1 protein expression was lost in 23 patients (77%) (Table 2). This included 10 additional samples in which a mutation was not detected (possibly due to dilution of mutant tumor reads from stromal contamination). While the results did not reach statistical significance, the overall rate of PBRM1 loss among patients with PM (77%) was 15% higher than a separate internal cohort of 105 patients with metastatic ccRCC lacking PM (77% vs. 62%) (Table 2). PBRM1 loss was a truncal event in our cohort, with concordance rates between primary tumors and PM for PBRM1 loss of 94% (n = 18 patients with matched samples).
These data reveal that tumors that metastasize to the pancreas show an evolutionary profile characterized by a low frequency of mutations associated with aggressive disease, such as TERT and BAP1, and a higher frequency of PBRM1 loss, which is typical of a more indolent disease.
Low aggressiveness chromosomal alterations.
We next performed copy number analyses in our cohort of 31 patients. We observed DNA copy number variants (CNVs) characteristic of ccRCC (22, 31–33), including frequent losses of chromosome 3p (93% of patients), gains in 5q (72%), and gains in chromosome 7 (41%) (Figure 3B, Supplemental Figure 5, and Supplemental Table 3A). CNVs associated with aggressive ccRCC, including losses in 9p, 14q, and 4q as well as 8q gains (22, 31, 33–37), were less frequent in patients with PM than in purely metastatic cohorts (33). Overall, the rates of copy number abnormalities observed in our cohort were more similar to what has been observed in nonmetastatic primary ccRCC (Supplemental Table 3B) (22, 32).
We next compared CNVs in the primary tumor with those in either PM or other metastases in the same patients. PM exhibited a CNV profile that was more similar to the primary tumor than other metastases (Supplemental Table 3A and Supplemental Figure 5). These data suggest that limited diversification is observed not only in the primary tumors leading to PM, but also in the PM themselves. Overall, these data suggest that tumors associated with PM are characterized by a limited spectrum of alterations consistent with a constrained evolutionary process.
Uniformity, angiogenesis, and reduced inflammation characterize gene expression profiles of PM tumors.
We performed RNA-Seq on both primary tumors and metastases. Both primary tumors and metastases from patients with PM clustered together, suggesting limited evolutionary divergence (Figure 3C). In addition, as a whole, PM tumors clustered separately from non-PM tumors, showing that PM tumors represent a homogeneous and distinctive group of ccRCC (Hotelling’s T-squared P < 1 × 10–16; Figure 3C and Supplemental Table 6).
Next, we performed gene ontology analyses. Interestingly, we identified an enrichment for processes that regulate chromatin such as nucleosome assembly, organization, and positioning as well as chromatin silencing, which is noteworthy, as low-grade tumors are characterized by compact heterochromatin (Supplemental Table 4). Histone coding genes were frequently overexpressed in PM tumors (and Supplemental Figure 6). Pathways involving histone clusters 1–3 (e.g., histone H3-K27 trimethylation) were the most highly enriched pathways in PM tumors, which is notable given the important role that chromatin remodeling genes play in ccRCC and their prognostic implications (38).
We expanded these analyses to evaluate previously validated angiogenic and inflammatory signatures (39–41). In keeping with our histology results, we found that PM and the corresponding primary tumors were enriched for angiogenic markers and had low levels of inflammatory markers, such as effector T cells (Supplemental Figure 7).
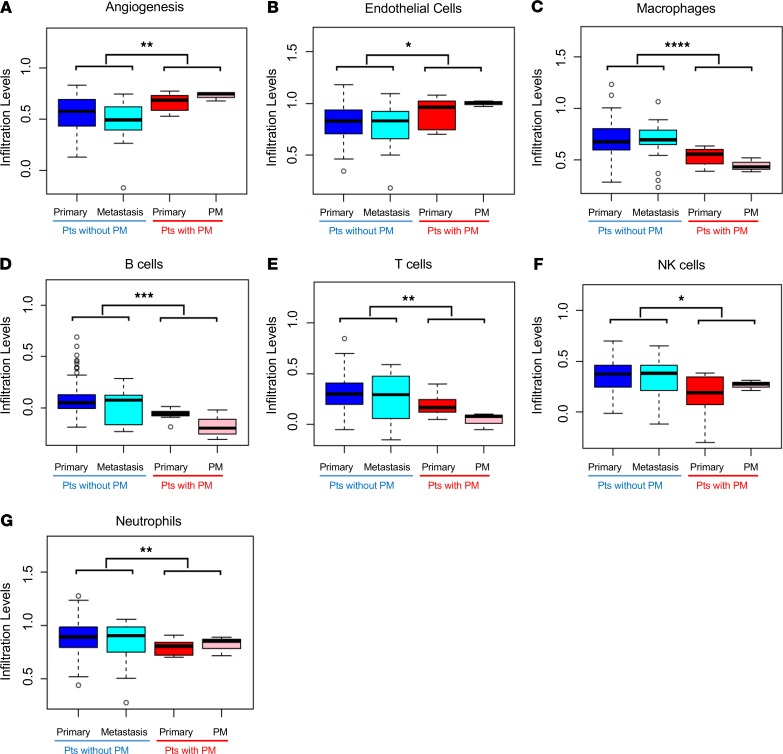
We extended gene expression analyses to evaluate an empirically derived tumor microenvironment (eTME) gene expression signature, which we previously reported (42). According to this signature, 2 dominant subtypes of RCC were identified: an inflamed subtype and a noninflamed subtype characterized by angiogenesis genes. We observed that PM (and the corresponding primary tumors) were characterized by an angiogenic signature and low levels of inflammation (Figure 4, A–G). More specifically, we observed an enrichment for endothelial cells and a lower frequency of macrophages, B cells, T cells, natural killer cells, and neutrophils. These phenotypes correspond to the typical noninflamed subtype of RCCs that we previously defined (42).
Figure 4. Primary tumors with PM are characterized by an angiogenic signature and low levels of inflammation.
Box-and-whisker plots comparing median relative gene expression levels (lines within the boxes) and IQRs (bounds of the boxes) for primary tumors and metastases of PM and non-PM patients for the indicated empirically defined tumor microenvironment gene signatures. Whiskers extend to 1.5 times the IQR. Open circles represent the most extreme data points beyond the whiskers (*P < 0.05, **P < 0.01, ***P < 0.001, ****P < 0.0001 by 2-tailed Student’s t tests). PM, pancreatic metastases; IQR, interquartile range.
Tumors harboring mutations in PBRM1 engraft in the pancreas of host mice.
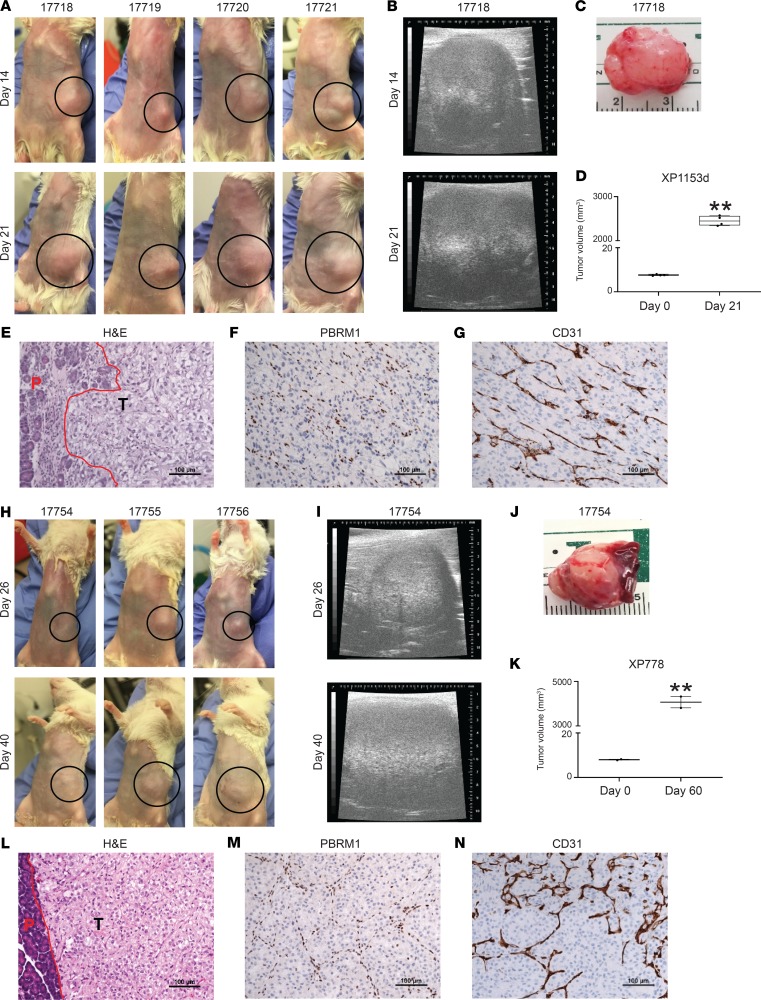
Finally, we asked whether tumors with PBRM1 mutations had the ability to grow when implanted directly onto the pancreas of immunocompromised mice. Tumor samples from 2 different patients with PBRM1 mutations were implanted heterotopically into the pancreas of NOD/SCID mice and monitored for growth (Figure 5). Tumors from both patients engrafted, demonstrating that tumors with PBRM1 loss are able to grow in the pancreas (Figure 5, A–E and H–L). IHC for PBRM1 confirmed that these tumors do not express PBRM1 (Figure 5, F and M). These tumors exhibited a prominent vascular network, at least regionally (Figure 5, G and N). These data provide proof of principle that the pancreas is able to support the growth of ccRCCs with PBRM1 mutations.
Figure 5. The pancreas supports engraftment and growth of ccRCC with PBRM1 loss.
(A and H) Images of tumors growing in the pancreas of 7 NOD/SCID host mice from 2 different patients with PBRM1 mutations. Dotted black circles demarcate the tumor areas. (B and I) Ultrasound images of tumor growth. (C and J) Images of harvested tumors from indicated mice. (D and K) Tumor volumes at implantation and harvest. (E and L) H&E staining of the tumors showing pancreatic interface in red; P-pancreas; T-tumor. (F and M) PBRM1 and (G and N) CD31 IHC studies. **P < 0.01.
Discussion
Herein we report the most comprehensive study of RCC metastatic to the pancreas to date. Our data show that tumors that metastasize to the pancreas are associated with improved outcomes irrespective of the current IMDC model (43), and that this model has limited application in this setting. Further, we show that tumors with PM are associated with differential response to systemic therapy, and while they respond favorably to antiangiogenic drugs, they are resistant to nivolumab. PM tumors are characterized by a homogeneous, indolent, highly vascular, small nest architecture as well as a profile of mutations and CNA characteristic overall of indolent/nonmetastatic ccRCC. Gene expression analyses revealed limited evolution and an angiongenic signature, which together with histopathological studies, provide a potential explanation for the differential treatment responsiveness. Overall, these findings suggest that tumors that metastasize to the pancreas represent a distinct clade of ccRCC, even if concomitant metastases are found elsewhere.
Comprehensive genomic and histopathological analyses show that PM tumors are characterized by low aggressiveness. Genetic and IHC analyses revealed a low frequency of BAP1 loss, which we and others previously showed is associated with aggressive disease (25, 26, 28, 30, 44) and a high frequency of PBRM1 loss (>75%), which is associated with less aggressive disease (25, 30). Similarly, PM tumors are characterized by 3p loss and 5q amplification, a characteristic chromotryptic event in ccRCC, with a low frequency of copy number alterations associated with aggressiveness, such as 9p, 14q, and 4q loss. Interestingly, genomic alterations were not significantly different in PM despite sometimes a span of over a decade between the primary and the PM.
What drives tropism to the pancreas is poorly understood. The small, compact nest pattern distinctively enriched in our cohort is characterized by an interdigitating stroma with an extensive vascular network, which we speculate reflects dependency on angiogenesis. This dependency may influence metastases by restricting growth to highly vascularized destinations, like the pancreas (45). Further, we show that PBRM1-deficient tumors are able to engraft in the pancreas. High vascularity characterizes other endocrine organs as well, such as the thyroid and adrenal gland, and, interestingly, when metastatic to these organs, RCC has similarly been associated with a favorable prognosis (46–48). Interestingly, prominent vascularization of these tumors may underlie their exquisite sensitivity to angiogenesis inhibitors.
Conversely, PM tumors were characterized by a lack of an inflammatory stroma. This was observed histologically and also by RNA-Seq. This may explain why these patients were refractory to nivolumab. Indeed, “cold” tumors without inflammatory cells are notoriously resistant to ICI (49–51). The lack of an inflammatory stroma may also explain the limited utility of the IMDC prognostic model, as 4–6 variables that comprise the IMDC model (thrombocytosis, anemia, neutrophilia, and low-performance status) may reflect tumor-induced systemic inflammation (42). As PM tumors are generally devoid of an inflammatory stroma, they escape prognostication by this model.
The PM stroma characterized by a prominent vascular network and low levels of inflammation likely relates to the underlying genetic characteristics of the tumor. Indeed, we and others previously reported a correlation between BAP1 mutation and an inflamed stroma (42). How BAP1 loss may promote inflammation is unclear, but BAP1 loss has been associated with reactivation of endogenous retroviruses in humans, which may trigger an immune response (52). Conversely, PBRM1 loss has been linked to angiogenic gene expression and responsiveness to antiangiogenic agents (39, 41). Furthermore, gene targeting experiments in the mouse kidney show that Vhl and Pbrm1 inactivation results in ccRCC with compact nests and a prominent vascular network, indicating that these alterations likely drive the characteristic histology of PM. In contrast, Vhl and Bap1 inactivation in the mouse kidney results in more aggressive, inflamed and less vascularized tumors (25, 30).
PM tumors may represent an extreme case in the spectrum of ccRCC and, as such, may help inform the current therapeutic debate that centers around the optimal use of angiogenesis inhibitors and ICI. Our data suggest that tumors with PM benefit from antiangiogenic therapy, but not ICI, which may be curative for some patients. That tumors may be dichotomized between these two extremes is suggested by our previous analyses of 599 ccRCC samples using our eTME, where we found that inflammatory and angiogenesis signatures are mostly nonoverlapping (42). Similar observations have been made by others (41). However, these are likely extremes, and it is unknown how many tumors may benefit from combining antiangiogenic drugs, such as axitinib, with ICI, such as pembrolizumab, a recently FDA-approved regimen (18). Furthermore, by reducing perfusion, antiangiogenic drugs may induce necrosis, which in turn may promote inflammation and synergize with immunotherapy. Determining the role of antiangiogenic therapies versus ICI in patients with PM would ultimately require prospective clinical trials.
Methods
Patients.
Clinical information and tumor samples were obtained from patients with metastatic RCC at UTSW and Cleveland Clinic Taussig Cancer Institute (CC). Metastatic RCC patients found to have PM either at diagnosis or during follow-up were identified from both institutions. PM were confirmed histologically or by a radiologist with dedicated genitourinary expertise on multiphase contrast-enhanced cross-sectional imaging (CT or MRI). PM were required to be noncontiguous with the primary tumor; patients with direct extension of the primary renal tumor to the pancreas were excluded.
Baseline clinical data, including patient demographics, comorbidities, performance status, and IMDC risk scores were collected. Pathologic information from primary tumors (or where available, metastatic sites) was collected, including tumor size, histology, ISUP grade, lymphovascular invasion, multifocality, necrosis, surgical margins, and presence of sarcomatoid or rhabdoid features. The timing of metastasis was obtained, along with the total number and location of metastatic sites and the type and number of systemic therapies received. Treatment approaches to PM, which included surgical resection, stereotactic radiotherapy, or systemic therapy, were noted. Oncologic outcomes including PFS, OS, and cancer-specific survival (CSS) were recorded. OS and CSS were measured from the time of initial diagnosis of metastatic disease.
Heterotopic tumor implantation into mice.
Fresh tumor fragments from 2 lines (XP1153d and XP778) were implanted heterotopically in the pancreas of 4- to 6-week-old NOD/SCID mice (The Jackson Laboratory). A small skin incision (~1 cm) was made in the left flank. The pancreas was exteriorized by pulling out the spleen carefully using a sterile swab and forceps. A tumor fragment (~8 mm3) was anchored into a suture needle (Coated PGA 6-0, 041178) and sutured into the pancreatic head region. Mice were monitored weekly and tumor volumes were assessed by ultrasound (VisualSonics Vevo-770).
Sample nomenclature.
Tissue samples for analysis were obtained from the primary renal tumor as well as metastatic sites (PM and other distant metastases); matched normal tissue was evaluated as a reference. A schema of the PM cohort is shown in Supplemental Figure 1. Supplemental Table 1 lists all the samples evaluated and the respective analyses. Among 56 tumor samples, 17 were fresh frozen (from UTSW) and 39 were FFPE (10 from UTSW, 29 from CC). Samples designated by the prefix “XP” or “PtS” signify UTSW samples, whereas those designated by “CC-UT” signify CC samples, which were evaluated at UTSW. A number follows the prefixes; suffixes designate whether a sample was obtained from the primary tumor (T), thrombus (Th), or metastasis (M). In some instances, multiple samples were obtained from different sites, and an additional numerical suffix is added at the end to make this distinction.
Pathological analyses.
The morphologic architecture, cytologic pattern, and tumor microenvironment in each sample were centrally reviewed and characterized by a genitourinary pathologist after preparing H&E-stained slides. Morphologic patterns were evaluated according to a recently developed classification system that correlates with tumor aggressiveness and prognosis (20).
IHC staining for BAP1, PBRM1, and CD31 was performed at UTSW on FFPE tissue using Autostainer Link 48 (Dako), as previously described (26, 30). Primary antibodies were obtained from Bethyl Laboratories (PBRM1, 1:4,000 dilution, A301-591A), Santa Cruz Biotechnology (BAP1, 1:700 dilution, sc-28383), and Agilent Technologies (CD31, clone JC70A, 1:50 dilution). Positive staining in the background of stromal cells and intratumoral lymphocytes was used as an internal control. Tumors were characterized as PBRM1 or BAP1 negative when they lacked strong or diffuse nuclear staining. Appropriate positive and negative controls were used for each run and checked for validation. One of the PM tumors found to express PBRM1 was noted to be a renal bed recurrence with direct extension to the pancreas rather than a pure metastasis to the pancreas. After exclusion of this sample from analysis, the rate of PBRM1 loss among pancreatic tumors rose to 84%.
Nucleic acid extraction.
Nucleic acid was extracted and purified from fresh frozen (UTSW) or FFPE (UTSW, CC) tissue as previously described (26). For fresh frozen tissue, DNA and RNA were simultaneously extracted and purified using AllPrep DNA/RNA Mini Kit (QIAGEN, 80204). For FFPE tissue, DNA was extracted using QIAamp DNA FFPE Tissue Kit (QIAGEN, 56404), and RNA was extracted using TRIzol reagent (Thermo Fisher, 15596026). Nucleic acid yield and quality were assessed using a NanoDrop ND-1000 spectrophotometer (NanoDrop Technologies). RNA quality was further evaluated by quantifying the abundance of ribosomal RNA fractions with Experion (Bio-Rad) and/or 2100 Bioanalyzer (Agilent).
WES.
Extracted DNA was submitted to either Genohub/Admera (UTSW samples) or the New York Genome Center (CC samples) for WES. Sequencing was conducted using the HiSeq2500 platform (Illumina) to generate 2 × 75 bp paired-end data. Quality of the sequencing data was checked by FastQC (https://www.bioinformatics.babraham.ac.uk/projects/fastqc/). A mean coverage of 118× (after duplicate removal) was achieved for exome libraries on tumor samples (105× for UTSW samples, 134× for CC samples). Total mutation burden was higher for CC samples (possibly related to higher coverage and FFPE samples), but did not vary between fresh frozen and FFPE samples from UTSW.
We used the Quantitative Biomedical Research Center (QBRC) mutation calling pipeline (53) (https://github.com/tianshilu/QBRC-Somatic-Pipeline, main branch, d29d583), developed by the QBRC at UTSW, for somatic mutation calling. In short, exome sequencing reads were aligned to the human reference genome GRCh38 (hg38) by BWA-MEM (43). Picard was used to add read group information and sambamba was used to mark PCR duplicates. GATK toolkit (54–56) was used to perform base quality score recalibration and local realignment around indels. MuTect (57), VarScan (58), Shimmer (59), SpeedSeq (60), Manta, and Strelka2 (61) were used to call SNPs and indels. A mutation that was repeatedly called by any two of these software tools was retained. Annovar was used to annotate SNPs and indels and protein sequence changes (62). A minimum of 7 total reads in the normal sample and at least 3 variant reads in the tumor sample with a variant allele frequency ≥5% were required for somatic mutation calling. Intronic, untranslated region, and intergenic mutations were filtered out. Missense mutations predicted to be benign by both PP2 and SIFT were filtered out, with <5% chance of inducing functional changes at the protein level (63).
We carried out somatic CNV analyses on our WES data using CNVkit implemented as a part of our mutation calling pipeline (https://github.com/tianshilu/QBRC-Somatic-Pipeline, main branch, d29d583) with default parameters on paired tumor-normal sequencing data. CNVkit uses both on- and off-target sequencing reads to calculate log2 copy ratios across the genome for each sample and improves accuracy in copy number calling by applying a series of corrections (64). Arm gain or loss was called when >50% of the chromosome arm exhibited copy number gain or loss (22, 33).
RNA-Seq.
RNA-Seq was performed on fresh frozen samples by Admera Health. RNA-Seq libraries were prepared using the TruSeq RNA Sample Preparation kit (Illumina). The libraries were multiplexed 3 per lane and sequenced on the HiSeq2500 platform to obtain, on average, approximately 100 million paired-end (2 × 75 bp) reads per sample. FastQC was applied to conduct quality control procedures, with the parameters “--extract --threads 48 -q.” RNA-Seq reads were aligned to the human reference genome GRCh38 (hg38) using STAR (https://www.ncbi.nlm.nih.gov/pmc/articles/PMC3530905/) with the parameters “--runThreadN 48 --outSAMtype BAM Unsorted --outReandsUnmapped Fastx.” The featureCounts software program (65) with parameters “--primary -O -t exon -g transcript_id -s 0 -T 48 --largestOverlap --minOverlap 3 --ignoreDup -p -P -B -C” was then used to measure gene expression levels. The human genome annotation file employed by featureCounts was downloaded from the University of California Santa Cruz table browser under the RefSeq Gene track. Downstream analyses were performed using the R computing environment (version 3.2.1). Reads per kilobase million (RPKM) values were calculated from gene read counts. RPKM values were then log2-transformed, by log(x+1), where x is the expression level, and quantile normalized. Two-tailed Student’s t test was applied to assess the statistical significance of differentially expressed genes.
All fresh frozen UTSW samples were compared with a historic UTSW cohort of ccRCC patients without PM that had available RNA-Seq data from fresh frozen tumors. Principal component analysis was performed, and the PM and historic cohorts were compared using Hotelling’s T-squared statistic.
Accession codes.
Sequencing data for patients specifically consenting to have their genomic data in a public database have been made available through the European Genome-phenome Archive (accession code: EGAS00001004208).
Statistics.
Baseline clinicopathologic characteristics were tabulated across the entire cohort and compared between institutions (UTSW, CC) using independent-sample Mann-Whitney U and χ2 tests for continuous and categorical variables, respectively. CSS and OS from the time of first metastasis were compared within the entire PM cohort using Kaplan-Meier methods stratified by IMDC risk score, and differences were analyzed with the log-rank statistic. We also compared OS and PFS between our PM cohort and a historic UTSW control cohort of metastatic ccRCC patients without PM who received systemic therapy for RCC at UTSW between 2006 and 2018 (Supplemental Table 2) and performed parallel subgroup analyses by controlling for IMDC risk score. For PFS analysis, progression was defined by the presence of new or enlarging lesions while receiving a particular line of systemic therapy according to Response Evaluation Criteria in Solid Tumors (version 1.1). Concordance rates between IHC and WES results were evaluated. Statistical analyses were conducted using SPSS version 25.0 (IBM). P values are 2-sided, with statistical significance defined as P < 0.05. All patients and samples available for clinical and IHC analyses are summarized in Supplemental Table 1. For IHC analyses, our historic control consisted of patients with metastatic ccRCC without PM treated at UTSW who had interpretable and unequivocal IHC without heterogeneity between matched tumor sites, if available.
Study approval.
Clinical information and tumor samples were obtained from patients with metastatic RCC at UTSW and CC under the purview of Institutional Review Board-approved protocols. Written informed consent was obtained for UTSW patients prospectively enrolled in tumor banking protocols.
Tumor graft studies were conducted according to the Institutional Animal Care and Use Committee protocol (APN 2015-100932).
Author contributions
NS, QY, JC, IAB, VM, and BR contributed to acquisition of clinical data. MG and VTT performed pancreatic implantations. IP performed radiographic analyses. QY, CP, and PK contributed to sample acquisition. OO and TM performed IHC staining, and PK performed centralized pathological review. YM performed nucleic acid extraction. ZX, ZZ, and TW performed bioinformatics analyses. NS and AC performed statistical analyses. NS, ZX, ZZ, AC, IP, CP, TW, PK, BR, and JB contributed to data interpretation. JB conceived and designed the study. RM and ORT prepared figures and reviewed the manuscript. JB had full access to all the data and the final responsibility for the decision to submit for publication. All authors contributed to the preparation and critical review of the manuscript.
Supplementary Material
Acknowledgments
We are grateful to the patients whose information and samples made this study possible and to those who agreed to share their genomic information. This work was supported by the NIH/NCI Kidney Cancer SPORE P50CA19651601 (to JB, PK, TW, IP, VM, and RM), R03ES026397-01 (to TW), R01154475 (to IP), U01CA207091 (to IP); Ruth L. Kirschstein National Research Service Award T32 CA136515-09 (to NS); Cancer Prevention & Research Institute of Texas (CPRIT) grants RP180192 (to JB) and RP190208 (to TW); and UT Southwestern Medical Center Physician Scientist Training Program (to NS). The funding sources had no role in the study design, data collection, analysis, interpretation, or writing of this manuscript. We acknowledge the UTSW Tissue Resource, which is supported in part by the Harold C. Simmons Cancer Center through an NCI Cancer Center Support Grant, 1P30 CA142543.
Version 1. 04/09/2020
Electronic publication
Funding Statement
J. Brugarolas, P. Kapur, T. Wang, I. Pedrosa, V. Margulis, R. McKay
T. Wang
I. Pedrosa
I. Pedrosa
N. Singla
Cancer Center Support grant
Footnotes
Conflict of interest: JB is a consultant for Exelixis and received research funding from Genentech, Peloton, and Arrowhead. IP is a consultant for Bayer Healthcare. BR serves as a consultant for and received research funding from Pfizer, Merck, GNE/Roche, Peloton, Aveo, and BMS. BR also received research funding from AstraZeneca and serves as a consultant for Novartis, Synthorx, Compugen, Corvus, and Exelixis. BR owns stock in PTC Therapeutics.
Copyright: © 2020, American Society for Clinical Investigation.
Reference information: JCI Insight. 2020;5(7):e134564.https://doi.org/10.1172/jci.insight.134564.
Contributor Information
Nirmish Singla, Email: nirmish@gmail.com.
Zhiqun Xie, Email: Zhiqun.Xie@utsouthwestern.edu.
Ze Zhang, Email: ze.zhang@utsouthwestern.edu.
Ming Gao, Email: ming.gao@utsouthwestern.edu.
Qurratulain Yousuf, Email: Qurratulain.Yousuf@UTSouthwestern.edu.
Oreoluwa Onabolu, Email: Oreoluwa.Onabolu@utsouthwestern.edu.
Tiffani McKenzie, Email: Tiffani.McKenzie@UTSouthwestern.edu.
Vanina Toffessi Tcheuyap, Email: Vanina.ToffessiTcheuyap@UTSouthwestern.edu.
Yuanqing Ma, Email: Yuanqing.Ma@utsouthwestern.edu.
Jacob Choi, Email: choij2@ccf.org.
Alana Christie, Email: Alana.Christie@utsouthwestern.edu.
Oscar Reig Torras, Email: Oscar.ReigTorras@UTSouthwestern.edu.
Isaac A. Bowman, Email: isaac.bowman@utsouthwestern.edu.
Vitaly Margulis, Email: Vitaly.Margulis@UTSouthwestern.edu.
Ivan Pedrosa, Email: Ivan.Pedrosa@UTSouthwestern.edu.
Tao Wang, Email: tao.wang@utsouthwestern.edu.
Payal Kapur, Email: payal.kapur@utsouthwestern.edu.
Brian Rini, Email: brian.rini@vumc.org.
James Brugarolas, Email: james.brugarolas@utsouthwestern.edu.
References
- 1.Villarreal-Garza C, Perez-Alvarez SI, Gonzalez-Espinoza IR, Leon-Rodriguez E. Unusual metastases in renal cell carcinoma: a single institution experience and review of literature. World J Oncol. 2010;1(4):149–157. doi: 10.4021/wjon232w. [DOI] [PMC free article] [PubMed] [Google Scholar]
- 2.Sountoulides P, Metaxa L, Cindolo L. Atypical presentations and rare metastatic sites of renal cell carcinoma: a review of case reports. J Med Case Rep. 2011;5:429. doi: 10.1186/1752-1947-5-429. [DOI] [PMC free article] [PubMed] [Google Scholar]
- 3.Bianchi M, et al. Distribution of metastatic sites in renal cell carcinoma: a population-based analysis. Ann Oncol. 2012;23(4):973–980. doi: 10.1093/annonc/mdr362. [DOI] [PubMed] [Google Scholar]
- 4.Sperti C, et al. Metastatic tumors to the pancreas: a systematic review and meta-analysis. Minerva Chir. 2016;71(5):337–344. [PubMed] [Google Scholar]
- 5.Sperti C, Moletta L, Patanè G. Metastatic tumors to the pancreas: The role of surgery. World J Gastrointest Oncol. 2014;6(10):381–392. doi: 10.4251/wjgo.v6.i10.381. [DOI] [PMC free article] [PubMed] [Google Scholar]
- 6.Ballarin R, et al. Pancreatic metastases from renal cell carcinoma: the state of the art. World J Gastroenterol. 2011;17(43):4747–4756. doi: 10.3748/wjg.v17.i43.4747. [DOI] [PMC free article] [PubMed] [Google Scholar]
- 7.Faure JP, Tuech JJ, Richer JP, Pessaux P, Arnaud JP, Carretier M. Pancreatic metastasis of renal cell carcinoma: presentation, treatment and survival. J Urol. 2001;165(1):20–22. doi: 10.1097/00005392-200101000-00005. [DOI] [PubMed] [Google Scholar]
- 8.Janzen NK, Kim HL, Figlin RA, Belldegrun AS. Surveillance after radical or partial nephrectomy for localized renal cell carcinoma and management of recurrent disease. Urol Clin North Am. 2003;30(4):843–852. doi: 10.1016/S0094-0143(03)00056-9. [DOI] [PubMed] [Google Scholar]
- 9.Ghavamian R, et al. Renal cell carcinoma metastatic to the pancreas: clinical and radiological features. Mayo Clin Proc. 2000;75(6):581–585. doi: 10.4065/75.6.581. [DOI] [PubMed] [Google Scholar]
- 10.Medioni J, Choueiri TK, Zinzindohoué F, Cho D, Fournier L, Oudard S. Response of renal cell carcinoma pancreatic metastasis to sunitinib treatment: a retrospective analysis. J Urol. 2009;181(6):2470–2475. doi: 10.1016/j.juro.2009.02.020. [DOI] [PubMed] [Google Scholar]
- 11.Law CH, et al. Pancreatic resection for metastatic renal cell carcinoma: presentation, treatment, and outcome. Ann Surg Oncol. 2003;10(8):922–926. doi: 10.1245/ASO.2003.02.003. [DOI] [PubMed] [Google Scholar]
- 12.Cheng SK, Chuah KL. Metastatic renal cell carcinoma to the pancreas: a review. Arch Pathol Lab Med. 2016;140(6):598–602. doi: 10.5858/arpa.2015-0135-RS. [DOI] [PubMed] [Google Scholar]
- 13.Chrom P, Stec R, Bodnar L, Szczylik C. Prognostic significance of pancreatic metastases from renal cell carcinoma in patients treated with tyrosine kinase inhibitors. Anticancer Res. 2018;38(1):359–365. doi: 10.21873/anticanres.12230. [DOI] [PubMed] [Google Scholar]
- 14.Fikatas P, Klein F, Andreou A, Schmuck RB, Pratschke J, Bahra M. Long-term survival after surgical treatment of renal cell carcinoma metastasis within the pancreas. Anticancer Res. 2016;36(8):4273–4278. [PubMed] [Google Scholar]
- 15.Grassi P, et al. Clinical impact of pancreatic metastases from renal cell carcinoma: a multicenter retrospective analysis. PLoS One. 2016;11(4):e0151662. doi: 10.1371/journal.pone.0151662. [DOI] [PMC free article] [PubMed] [Google Scholar]
- 16.Kalra S, et al. Prognosis of patients with metastatic renal cell carcinoma and pancreatic metastases. BJU Int. 2016;117(5):761–765. doi: 10.1111/bju.13185. [DOI] [PMC free article] [PubMed] [Google Scholar]
- 17.Sellner F. Isolated pancreatic metastases from renal cell carcinoma: an outcome of a special metastatic pathway or of specific tumor cell selection? Clin Exp Metastasis. 2018;35(3):91–102. doi: 10.1007/s10585-018-9910-1. [DOI] [PubMed] [Google Scholar]
- 18.de Velasco G, et al. Sequencing and combination of systemic therapy in metastatic renal cell carcinoma. Eur Urol Oncol. 2019;2(5):505–514. doi: 10.1016/j.euo.2019.06.022. [DOI] [PubMed] [Google Scholar]
- 19.Verine J, et al. Architectural patterns are a relevant morphologic grading system for clear cell renal cell carcinoma prognosis assessment: comparisons with WHO/ISUP grade and integrated staging systems. Am J Surg Pathol. 2018;42(4):423–441. doi: 10.1097/PAS.0000000000001025. [DOI] [PubMed] [Google Scholar]
- 20.Cai Q, et al. Ontological analyses reveal clinically-significant clear cell renal cell carcinoma subtypes with convergent evolutionary trajectories into an aggressive type. EBioMedicine. 2020;51:102526. doi: 10.1016/j.ebiom.2019.10.052. [DOI] [PMC free article] [PubMed] [Google Scholar]
- 21.Sondka Z, Bamford S, Cole CG, Ward SA, Dunham I, Forbes SA. The COSMIC Cancer Gene Census: describing genetic dysfunction across all human cancers. Nat Rev Cancer. 2018;18(11):696–705. doi: 10.1038/s41568-018-0060-1. [DOI] [PMC free article] [PubMed] [Google Scholar]
- 22.Turajlic S, et al. Tracking cancer evolution reveals constrained routes to metastases: TRACERx Renal. Cell. 2018;173(3):581–594.e12. doi: 10.1016/j.cell.2018.03.057. [DOI] [PMC free article] [PubMed] [Google Scholar]
- 23.Cancer Genome Atlas Research Network Comprehensive molecular characterization of clear cell renal cell carcinoma. Nature. 2013;499(7456):43–49. doi: 10.1038/nature12222. [DOI] [PMC free article] [PubMed] [Google Scholar]
- 24.Casuscelli J, et al. Characterization and impact of TERT Promoter region mutations on clinical outcome in renal cell carcinoma. Eur Urol Focus. 2019;5(4):642–649. doi: 10.1016/j.euf.2017.09.008. [DOI] [PMC free article] [PubMed] [Google Scholar]
- 25.Gu YF, et al. Modeling renal cell carcinoma in mice: Bap1 and Pbrm1 inactivation drive tumor grade. Cancer Discov. 2017;7(8):900–917. doi: 10.1158/2159-8290.CD-17-0292. [DOI] [PMC free article] [PubMed] [Google Scholar]
- 26.Peña-Llopis S, et al. BAP1 loss defines a new class of renal cell carcinoma. Nat Genet. 2012;44(7):751–759. doi: 10.1038/ng.2323. [DOI] [PMC free article] [PubMed] [Google Scholar]
- 27.Kapur P, et al. BAP1 immunohistochemistry predicts outcomes in a multi-institutional cohort with clear cell renal cell carcinoma. J Urol. 2014;191(3):603–610. doi: 10.1016/j.juro.2013.09.041. [DOI] [PubMed] [Google Scholar]
- 28.Joseph RW, et al. Loss of BAP1 protein expression is an independent marker of poor prognosis in patients with low-risk clear cell renal cell carcinoma. Cancer. 2014;120(7):1059–1067. doi: 10.1002/cncr.28521. [DOI] [PMC free article] [PubMed] [Google Scholar]
- 29.Kadariya Y, et al. Bap1 is a bona fide tumor suppressor: genetic evidence from mouse models carrying heterozygous germline Bap1 mutations. Cancer Res. 2016;76(9):2836–2844. doi: 10.1158/0008-5472.CAN-15-3371. [DOI] [PMC free article] [PubMed] [Google Scholar]
- 30.Wang SS, et al. Bap1 is essential for kidney function and cooperates with Vhl in renal tumorigenesis. Proc Natl Acad Sci U S A. 2014;111(46):16538–16543. doi: 10.1073/pnas.1414789111. [DOI] [PMC free article] [PubMed] [Google Scholar]
- 31.Ito T, et al. Genomic copy number alterations in renal cell carcinoma with sarcomatoid features. J Urol. 2016;195(4 pt 1):852–858. doi: 10.1016/j.juro.2015.10.180. [DOI] [PMC free article] [PubMed] [Google Scholar]
- 32.Sato Y, et al. Integrated molecular analysis of clear-cell renal cell carcinoma. Nat Genet. 2013;45(8):860–867. doi: 10.1038/ng.2699. [DOI] [PubMed] [Google Scholar]
- 33.Turajlic S, et al. Deterministic evolutionary trajectories influence primary tumor growth: TRACERx renal. Cell. 2018;173(3):595–610.e11. doi: 10.1016/j.cell.2018.03.043. [DOI] [PMC free article] [PubMed] [Google Scholar]
- 34.Kojima T, et al. Decreased expression of CXXC4 promotes a malignant phenotype in renal cell carcinoma by activating Wnt signaling. Oncogene. 2009;28(2):297–305. doi: 10.1038/onc.2008.391. [DOI] [PubMed] [Google Scholar]
- 35.La Rochelle J, et al. Chromosome 9p deletions identify an aggressive phenotype of clear cell renal cell carcinoma. Cancer. 2010;116(20):4696–4702. doi: 10.1002/cncr.25279. [DOI] [PubMed] [Google Scholar]
- 36.Monzon FA, et al. Chromosome 14q loss defines a molecular subtype of clear-cell renal cell carcinoma associated with poor prognosis. Mod Pathol. 2011;24(11):1470–1479. doi: 10.1038/modpathol.2011.107. [DOI] [PMC free article] [PubMed] [Google Scholar]
- 37.Perrino CM, Hucthagowder V, Evenson M, Kulkarni S, Humphrey PA. Genetic alterations in renal cell carcinoma with rhabdoid differentiation. Hum Pathol. 2015;46(1):9–16. doi: 10.1016/j.humpath.2014.09.001. [DOI] [PubMed] [Google Scholar]
- 38.Ricketts CJ, et al. The Cancer Genome Atlas Comprehensive molecular characterization of renal cell carcinoma. Cell Rep. 2018;23(1):313–326.e5. doi: 10.1016/j.celrep.2018.03.075. [DOI] [PMC free article] [PubMed] [Google Scholar]
- 39.Hakimi AA, et al. Transcriptomic profiling of the tumor microenvironment reveals distinct subgroups of clear cell renal cell cancer: data from a randomized phase III trial. Cancer Discov. 2019;9(4):510–525. doi: 10.1158/2159-8290.CD-18-0957. [DOI] [PMC free article] [PubMed] [Google Scholar]
- 40.Masiero M, et al. A core human primary tumor angiogenesis signature identifies the endothelial orphan receptor ELTD1 as a key regulator of angiogenesis. Cancer Cell. 2013;24(2):229–241. doi: 10.1016/j.ccr.2013.06.004. [DOI] [PMC free article] [PubMed] [Google Scholar]
- 41.McDermott DF, et al. Clinical activity and molecular correlates of response to atezolizumab alone or in combination with bevacizumab versus sunitinib in renal cell carcinoma. Nat Med. 2018;24(6):749–757. doi: 10.1038/s41591-018-0053-3. [DOI] [PMC free article] [PubMed] [Google Scholar]
- 42.Wang T, et al. An empirical approach leveraging tumorgrafts to dissect the tumor microenvironment in renal cell carcinoma identifies missing link to prognostic inflammatory factors. Cancer Discov. 2018;8(9):1142–1155. doi: 10.1158/2159-8290.CD-17-1246. [DOI] [PMC free article] [PubMed] [Google Scholar]
- 43.Heng DY, et al. Prognostic factors for overall survival in patients with metastatic renal cell carcinoma treated with vascular endothelial growth factor-targeted agents: results from a large, multicenter study. J Clin Oncol. 2009;27(34):5794–5799. doi: 10.1200/JCO.2008.21.4809. [DOI] [PubMed] [Google Scholar]
- 44.Hakimi AA, et al. Adverse outcomes in clear cell renal cell carcinoma with mutations of 3p21 epigenetic regulators BAP1 and SETD2: a report by MSKCC and the KIRC TCGA research network. Clin Cancer Res. 2013;19(12):3259–3267. doi: 10.1158/1078-0432.CCR-12-3886. [DOI] [PMC free article] [PubMed] [Google Scholar]
- 45.Jansson L, et al. Pancreatic islet blood flow and its measurement. Ups J Med Sci. 2016;121(2):81–95. doi: 10.3109/03009734.2016.1164769. [DOI] [PMC free article] [PubMed] [Google Scholar]
- 46.Grassi P, et al. Outcome of patients with renal cell carcinoma and multiple glandular metastases treated with targeted agents. Oncology. 2017;92(5):269–275. doi: 10.1159/000455970. [DOI] [PubMed] [Google Scholar]
- 47.Jackson G, Fino N, Bitting RL. Clinical characteristics of patients with renal cell carcinoma and metastasis to the thyroid gland. Clin Med Insights Oncol. 2017;11:1179554917743981. doi: 10.1177/1179554917743981. [DOI] [PMC free article] [PubMed] [Google Scholar]
- 48.Beutner U, et al. Survival after renal cell carcinoma metastasis to the thyroid: single center experience and systematic review of the literature. Thyroid. 2015;25(3):314–324. doi: 10.1089/thy.2014.0498. [DOI] [PubMed] [Google Scholar]
- 49.Bonaventura P, et al. Cold tumors: a therapeutic challenge for immunotherapy. Front Immunol. 2019;10:168. doi: 10.3389/fimmu.2019.00168. [DOI] [PMC free article] [PubMed] [Google Scholar]
- 50.Maleki Vareki S. High and low mutational burden tumors versus immunologically hot and cold tumors and response to immune checkpoint inhibitors. J Immunother Cancer. 2018;6(1):157. doi: 10.1186/s40425-018-0479-7. [DOI] [PMC free article] [PubMed] [Google Scholar]
- 51.Gajewski TF, Corrales L, Williams J, Horton B, Sivan A, Spranger S. Cancer immunotherapy targets based on understanding the T cell-inflamed versus non-T cell-inflamed tumor microenvironment. Adv Exp Med Biol. 2017;1036:19–31. doi: 10.1007/978-3-319-67577-0_2. [DOI] [PMC free article] [PubMed] [Google Scholar]
- 52.Panda A, et al. Endogenous retrovirus expression is associated with response to immune checkpoint blockade in clear cell renal cell carcinoma. JCI Insight. 2018;3(16):121522. doi: 10.1172/jci.insight.121522. [DOI] [PMC free article] [PubMed] [Google Scholar]
- 53.Lu T, et al. Tumor neoantigenicity assessment with CSiN score incorporates clonality and immunogenicity to predict immunotherapy outcomes. Sci Immunol. 2020;5(44):eaaz3199. doi: 10.1126/sciimmunol.aaz3199. [DOI] [PMC free article] [PubMed] [Google Scholar]
- 54.DePristo MA, et al. A framework for variation discovery and genotyping using next-generation DNA sequencing data. Nat Genet. 2011;43(5):491–498. doi: 10.1038/ng.806. [DOI] [PMC free article] [PubMed] [Google Scholar]
- 55.McKenna A, et al. The Genome Analysis Toolkit: a MapReduce framework for analyzing next-generation DNA sequencing data. Genome Res. 2010;20(9):1297–1303. doi: 10.1101/gr.107524.110. [DOI] [PMC free article] [PubMed] [Google Scholar]
- 56.Van der Auwera GA, et al. From FastQ data to high confidence variant calls: the Genome Analysis Toolkit best practices pipeline. Curr Protoc Bioinformatics. 2013;43:11.10.1–11.10.33. doi: 10.1002/0471250953.bi1110s43. [DOI] [PMC free article] [PubMed] [Google Scholar]
- 57.Cibulskis K, et al. Sensitive detection of somatic point mutations in impure and heterogeneous cancer samples. Nat Biotechnol. 2013;31(3):213–219. doi: 10.1038/nbt.2514. [DOI] [PMC free article] [PubMed] [Google Scholar]
- 58.Koboldt DC, et al. VarScan 2: somatic mutation and copy number alteration discovery in cancer by exome sequencing. Genome Res. 2012;22(3):568–576. doi: 10.1101/gr.129684.111. [DOI] [PMC free article] [PubMed] [Google Scholar]
- 59.Hansen NF, Gartner JJ, Mei L, Samuels Y, Mullikin JC. Shimmer: detection of genetic alterations in tumors using next-generation sequence data. Bioinformatics. 2013;29(12):1498–1503. doi: 10.1093/bioinformatics/btt183. [DOI] [PMC free article] [PubMed] [Google Scholar]
- 60.Chiang C, et al. SpeedSeq: ultra-fast personal genome analysis and interpretation. Nat Methods. 2015;12(10):966–968. doi: 10.1038/nmeth.3505. [DOI] [PMC free article] [PubMed] [Google Scholar]
- 61.Saunders CT, Wong WS, Swamy S, Becq J, Murray LJ, Cheetham RK. Strelka: accurate somatic small-variant calling from sequenced tumor-normal sample pairs. Bioinformatics. 2012;28(14):1811–1817. doi: 10.1093/bioinformatics/bts271. [DOI] [PubMed] [Google Scholar]
- 62.Wang K, Li M, Hakonarson H. ANNOVAR: functional annotation of genetic variants from high-throughput sequencing data. Nucleic Acids Res. 2010;38(16):e164. doi: 10.1093/nar/gkq603. [DOI] [PMC free article] [PubMed] [Google Scholar]
- 63.Wang T, et al. Probability of phenotypically detectable protein damage by ENU-induced mutations in the Mutagenetix database. Nat Commun. 2018;9(1):441. doi: 10.1038/s41467-017-02806-4. [DOI] [PMC free article] [PubMed] [Google Scholar]
- 64.Talevich E, Shain AH, Botton T, Bastian BC. CNVkit: genome-wide copy number detection and visualization from targeted DNA sequencing. PLoS Comput Biol. 2016;12(4):e1004873. doi: 10.1371/journal.pcbi.1004873. [DOI] [PMC free article] [PubMed] [Google Scholar]
- 65.Liao Y, Smyth GK, Shi W. featureCounts: an efficient general purpose program for assigning sequence reads to genomic features. Bioinformatics. 2014;30(7):923–930. doi: 10.1093/bioinformatics/btt656. [DOI] [PubMed] [Google Scholar]
Associated Data
This section collects any data citations, data availability statements, or supplementary materials included in this article.


