Abstract
The therapies available for management of obesity and associated conditions are limited, because they are often directed toward an individual component of metabolic syndrome and are associated with adverse effects. Here, we report the multifaceted therapeutic potential of histidine-tagged recombinant soluble (pro)renin receptor (sPRR), termed sPRR-His, in a mouse model of diet-induced obesity (DIO). In the DIO model, 2-week administration of sPRR-His lowered body weight and remarkably improved multiple metabolic parameters in the absence of fluid retention. Conversely, inhibition of endogenous sPRR production by PF429242 induced diabetes and insulin resistance, both of which were reversed by the sPRR-His supplement. At the cellular level, sPRR-His enhanced insulin-induced increases in glucose uptake via upregulation of phosphorylated AKT and protein abundance of glucose transporter 4. Promoter and gene expression analysis revealed PRR as a direct target gene of PPARγ. Adipocyte-specific PPARγ deletion induced severe diabetes and insulin resistance associated with reduced adipose PRR expression and circulating sPRR. The sPRR-His supplement in the null mice nearly normalized blood glucose and insulin levels. Additionally, sPRR-His treatment suppressed DIO-induced renal sodium-glucose cotransporter-2 (SGLT2) expression. Overall, sPRR-His exhibits a therapeutic potential in management of metabolic syndrome via interaction with PPARγ.
Keywords: Metabolism
Keywords: Glucose metabolism
Treatment of obese mice with a recombinant soluble (pro)renin receptor (sPRR) attenuated hyperglycemia, insulin resistance, fatty liver, and albuminuria via interaction with PPARγ.
Introduction
The prevalence of overweight and obese persons has dramatically increased during the past 2 decades, with 65% of adults in the United States being overweight and 31% being obese (1, 2). Obesity represents a major risk factor for type 2 diabetes, steatosis, chronic kidney disease (CKD), and other chronic diseases, which all together constitute metabolic syndrome. The International Diabetes Federation estimates that one-quarter of the world’s adults are affected by metabolic syndrome and indicates that the expense for prevention and treatment of this disease is astronomical (3). Unfortunately, no therapy is currently available for the treatment of metabolic syndrome. Most of the existing therapies are directed toward an individual component of metabolic syndrome and thus have limited efficacy. For instance, antidiabetic therapies, such as metformin, insulin, dipeptidyl peptidase-4, and glucagon-like peptide-1, are used only for glycemic control and have little benefit for other components of metabolic syndrome (4). Moreover, these therapies are often associated with adverse effects, for example, one class of highly effective antidiabetic drugs, thiazolidinediones (TZDs), causes weight gain and fluid retention (5–8). Therefore, a multifaceted approach is desperately needed to simultaneously target multiple components of metabolic syndrome and to improve the safety profile.
(Pro)renin receptor (PRR) is a new member of the renin-angiotensin system (9). A 28-kDa soluble form of PRR (sPRR) is generated by protease-mediated intracellular cleavage and secreted in plasma (10). A large number of clinical studies suggest the importance of circulating sPRR as an important disease biomarker (11–16). Recent evidence demonstrates that one biological function of sPRR is the regulation of urine-concentrating capability (17). In this study, we generated a histidine-tagged recombinant sPRR, termed sPRR-His, and found that it enhanced the expression of renal aquaporin-2 and urine-concentrating capability and can therefore be used to treat nephrogenic diabetes insipidus induced by vasopressin type 2 receptor antagonism (17). Although sPRR-His is ineffective in treating lithium-induced diabetes insipidus, it reduces the epididymal fat mass by enhancing the “beiging” process, indicating a possible role of sPRR in the regulation of adipocyte biology during lithium overload (18). The goal of the present study was to perform a vigorous evaluation of sPRR-His as a potential therapy for metabolic diseases, such as obesity and associated conditions, and to further explore the underlying mechanism.
Results
The therapeutic effect of exogenous sPRR on body weight and metabolism in mice with diet-induced obesity.
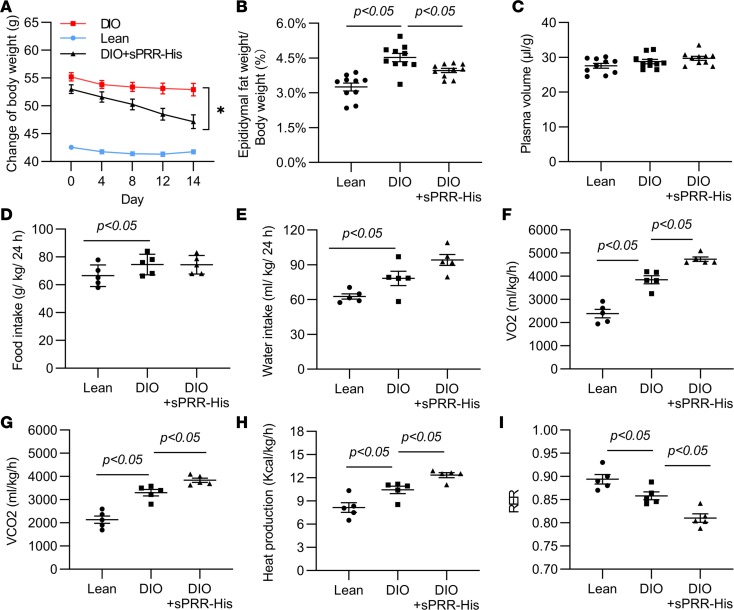
We treated male C57/BL6 mice with a high-fat diet (HFD) for 9 months and administered sPRR-His at 30 μg/kg/d for the last 2 weeks. The mice fed the long-term HFD developed severe diet-induced obesity (DIO) (Figure 1A) and an increase in epididymal fat mass (Figure 1B), which were both attenuated by sPRR-His treatment. Hematocrit (Hct) level, an index of red blood cell number relative to plasma volume, showed no difference between groups (Supplemental Figure 1; supplemental material available online with this article; https://doi.org/10.1172/jci.insight.128061DS1). These data were validated by precisely measuring plasma volume with FITC-dextran (Figure 1C). We used a 4-chamber Oxymax system (Columbus Instruments) to evaluate energy metabolism status. While food (Figure 1D) and water intake (Figure 1E) remained constant, sPRR-His treatment consistently elevated VO2 (Figure 1F), VCO2 (Figure 1G), and heat production (Figure 1H), indicating increased energy expenditure, which likely accounts for the antiobesity effect of sPRR-His. The respiratory exchange ratio, an indicator of whether the energy source is from fat versus carbohydrates, was reduced by sPRR-His (Figure 1I). This result suggests that sPRR-His may promote fat burning, leading to enhanced energy expenditure.
Figure 1. Effect of sPRR-His on body weight and metabolism in diet-induced obesity in male C57/BL6 mice.
Starting from 1 month of age, male C57/BL6 mice were placed on a high-fat diet for 9 months. During the last 2 weeks, mice were randomly divided to receive vehicle or sPRR-His. (A) The body weight changes over the 2-week treatment period. (B) The ratio of epididymal fat weight to body weight. (C) Plasma volume. (D) Food intake normalized by body weight. (E) Water intake normalized by body weight. (F) VO2 normalized by body weight. (G) VCO2 normalized by body weight. (H) Heat production normalized by body weight. (I) Respiratory exchange ratio (RER). For A–C, n =10. For D–I, n = 5. *P < 0.05 vs. DIO group by using ANOVA with the Bonferroni test for multiple comparisons. Data are shown as mean ± SEM.
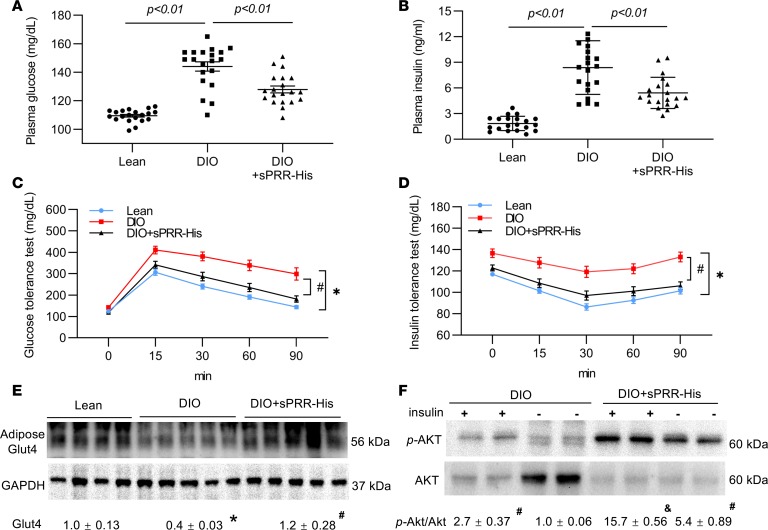
Obesity is a major risk factor for type 2 diabetes due to the disruption of insulin signaling, a phenomenon called insulin resistance (19, 20). DIO mice developed hyperglycemia and hyperinsulinemia, suggesting type 2 diabetes (Figure 2, A and B). Strikingly, following sPRR-His treatment, these parameters were almost normalized (Figure 2, A and B). We subsequently performed a glucose tolerance test (GTT) and an insulin tolerance test (ITT) to examine the status of glucose metabolism. DIO mice exhibited impaired GTT results, evidence of glucose intolerance, which was almost completely normalized by sPRR-His (Figure 2C). In parallel, DIO mice had impaired ITT results, with an attenuated blood glucose disappearance rate (Figure 2D). In contrast, the DIO/sPRR-His group had an ITT curve that was almost indistinguishable from that of the lean control group (Figure 2D). These results demonstrate a potent insulin-sensitizing action of sPRR-His in DIO mice.
Figure 2. Effect of sPRR-His on glucose metabolism in DIO mice.
After 8 hours of fasting, a single dose of glucose (1 g/kg body weight) or insulin (0.75 U/kg body weight) was administered via i.p. injection. This was followed by a series of blood collections and measurement of blood glucose. (A) Plasma glucose (n = 20). (B) Plasma insulin (n = 20). (C) Glucose tolerance test (n = 20). (D) Insulin tolerance test (n = 20). (E) Immunoblotting analysis of adipose Glut4 expression (n = 9). The same samples were run on a separate gel for detecting GAPDH. (F) Immunoblotting analysis of p-AKT and AKT (n = 5). The blot was stripped and reprobed with anti-AKT antibody. Densitometry values are shown underneath the blots. *P < 0.05 vs. lean group, #P < 0.05 vs. DIO group, &P < 0.05 vs. DIO/insulin group. For C and D, xy analyses with area under curve and unpaired Student’s t test were performed. For the others, statistical significance was determined by using ANOVA with the Bonferroni test for multiple comparisons. Data are shown as mean ± SEM.
Insulin typically signals through protein kinase B (also referred to as AKT) to target glucose transporter 4 (Glut4) in order to enhance glucose uptake (19). Subsequent experiments examined the effect of sPRR-His on the status of these signaling molecules. Adipose Glut4 protein abundance was lowered in DIO mice compared with that in lean controls, and it was restored by sPRR-His (Figure 2E). We then examined the phosphorylation of AKT in response to acute insulin treatment in DIO and DIO + sPRR-His mice. In both groups, insulin increased the level of p-AKT, but this increase was much greater in DIO + sPRR-His mice (Figure 2F). As predicted, the total AKT protein abundance in DIO mice was remarkably decreased by insulin as a result of increased phosphorylation of AKT (Figure 2F). In sharp contrast, the total AKT level was remarkably suppressed by sPRR-His both under basal conditions and after insulin treatment.
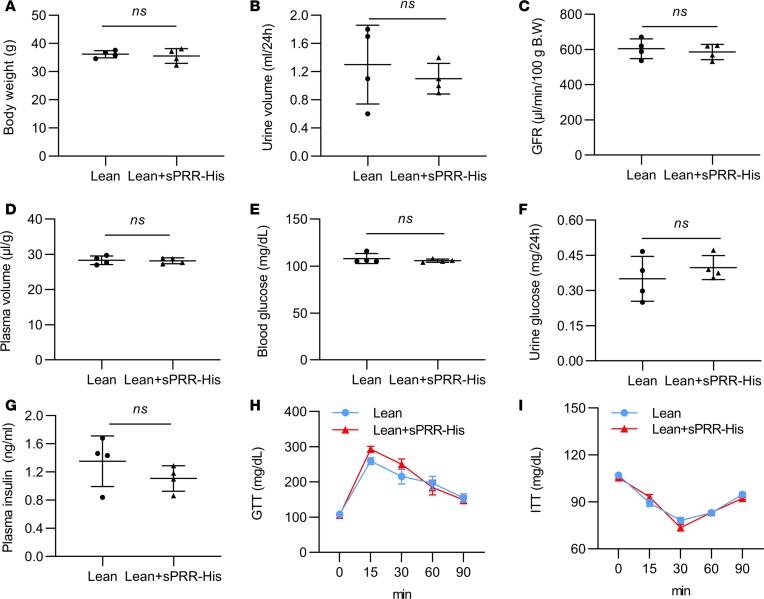
Unlike the DIO mice, the lean mice (Figure 3) showed no response to sPRR-His treatment. These data indicate a unique role of sPRR in obesity-associated conditions.
Figure 3. Effect of sPRR-His on body weight, renal function, and glucose metabolism in lean mice.
Lean mice were randomly divided to receive vehicle or sPRR-His for 2 weeks. (A) Body weight. (B) Urine volume. (C) GFR. (D) Plasma volume. (E) Blood glucose. (F) Urine glucose. (G) Plasma insulin. (H) GTT. (I) ITT. n = 4 per each group. For A–G, statistical significance was determined by using unpaired Student’s t test; for H and I, statistical significance was determined by using xy analyses with area under curve and unpaired Student’s t test performed. Data are shown as mean ± SEM.
The therapeutic effect of exogenous sPRR on liver steatosis in DIO mice.
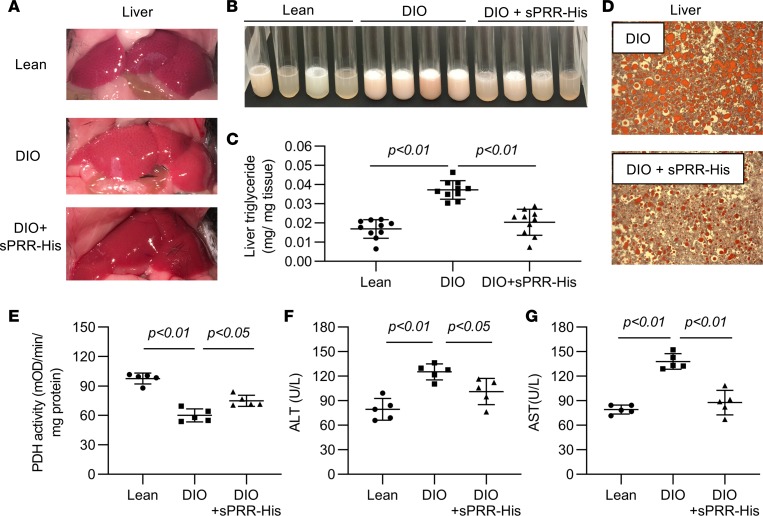
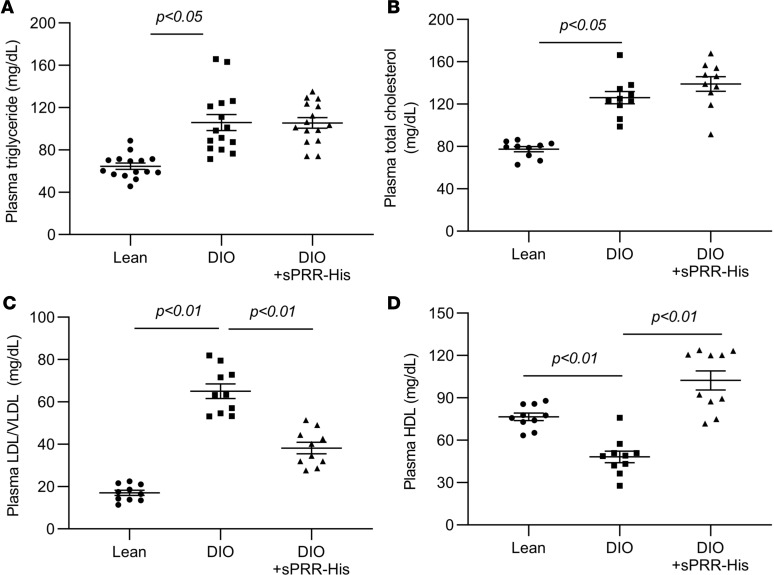
Obesity is also a major risk factor for nonalcoholic fatty liver disease (NAFLD) (21). We examined the hepatic effect of sPPR-His in the DIO model. As expected, in DIO mice, the liver had a pale appearance compared with that in lean controls, due to steatosis (Figure 4A). In contrast, the appearance of the liver in the DIO + sPRR-His group was almost indistinguishable from that in the lean controls (Figure 4A). After the liver homogenates were centrifuged, the upper white layer reflected an obviously increased lipid content in DIO mice compared with that from the lean controls. This lipid layer was much reduced in the DIO + sPRR-His group compared with that in the DIO group (Figure 4B). This result was validated by measuring the triglyceride content of the liver (Figure 4C). Furthermore, the lipid droplets revealed by Oil Red O staining were remarkably improved by sPRR-His treatment (Figure 4D). Hepatic steatosis is usually accompanied by liver dysfunction, as reflected by decreased liver pyruvate dehydrogenase (PDH) activity and increased plasma alanine aminotransferase (ALT) and aspartate aminotransferase (AST) levels, which were all attenuated by sPRR-His treatment (Figure 4, E–G). The consistent findings obtained through different approaches clearly demonstrated the protective action of sPRR-His against steatosis. Interestingly, sPRR-His did not alter DIO-induced hypertriglyceridemia (Figure 5A) and hypercholesteremia (Figure 5B) but did lower plasma LDL/VLDL levels (Figure 5C) and increased plasma HDL levels (Figure 5D).
Figure 4. Effect of sPRR-His on steatosis in DIO mice.
(A) The gross appearance of the liver. Shown are representative images from at least 3 independent experiments. (B) The appearance of the lipid layer in liver homogenates after centrifugation. Shown are representative images from 10 animals per group. (C) Liver triglyceride content (n = 10). (D) Oil red staining of the livers (original magnification, ×200) (n = 5). (E) Hepatic PDH activity (n = 5). (F) Alanine aminotransferase (ALT) (n = 5). (G) Aspartate aminotransferase (AST) (n = 5). Statistical significance was determined by using ANOVA with the Bonferroni test for multiple comparisons. Data are shown as mean ± SEM.
Figure 5. Effect of sPRR-His on lipid metabolism in DIO mice.
(A) Plasma triglyceride concentration (n = 15). (B) Plasma total cholesterol concentration (n = 10). (C) Plasma LDL/VLDL concentration (n = 10). (D) Plasma HDL concentration (n = 10). Statistical significance was determined by using ANOVA with the Bonferroni test for multiple comparisons. Data are shown as mean ± SEM.
The therapeutic effect of exogenous sPRR on renal complications in DIO mice.
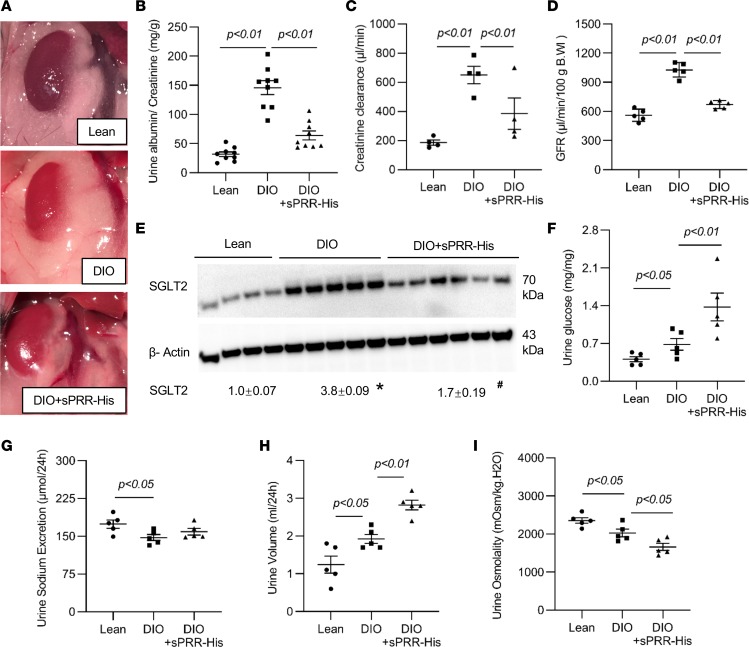
On gross appearance, the perirenal fat mass, which was attenuated in DIO + sPRR mice, was increased in DIO mice compared with that in lean controls (Figure 6A). Albuminuria, an important index of glomerular injury, was elevated more than 3-fold in DIO mice as compared with lean controls, and this increase was almost abolished by sPRR-His treatment (Figure 6B). Glomerular hyperfiltration is a major contributor to the pathogenesis of diabetic kidney disease (DKD). Therefore, we examined creatinine clearance to evaluate the estimated glomerular filtration rate (eGFR). The formula for measuring creatinine clearance is as follows: eGFR = (UCr × V)/SCr, where UCr is the urine creatinine concentration (mg/dL), V is the 24-hour urine volume, and SCr is the serum creatinine concentration (mg/dL). As expected, the creatinine clearance in DIO mice exhibited a 3-fold increase compared with that of the lean controls, indicating severe glomerular hyperfiltration (Figure 6C). Glomerular hyperfiltration was significantly attenuated by sPRR-His treatment (Figure 6C). This observation was verified by direct measurement of glomerular filtration rate (GFR) via transdermal assessment of elimination half-life kinetics of FITC-sinistrin (Figure 6D). Sodium-glucose cotransporter-2 (SGLT2) is known to be upregulated in obesity, resulting in increased glucose reabsorption and thus contributing to the pathogenesis of diabetes. Meanwhile, the activation of SGLT2 also decreases sodium delivery to the macula densa, attenuating tubuloglomerular feedback (TGF) and thus inducing glomerular hyperfiltration. Indeed, renal SGLT2 protein abundance exhibited a 3.8-fold increase in DIO mice over that in lean controls, and this increase was significantly attenuated by sPRR-His treatment (Figure 6E). In parallel, this treatment resulted in increased glucose excretion (Figure 6F) but not sodium excretion (Figure 6G). As expected, elevated glucose excretion was accompanied by the presence of diabetes insipidus (Figure 6, H and I). These results document the renoprotective action of sPRR-His in DIO mice, likely owing to its ability to inhibit SGLT2 expression, resulting in improvement of renal hemodynamics and hyperglycemia.
Figure 6. Effect of sPRR-His on renal function in DIO mice.
(A) Appearance of perirenal adipose tissue. (B) Urine albumin excretion (n = 9). (C) Creatinine clearance (n = 4). (D) GFR (n = 5). (E) Renal cortical SGLT2 expression (n = 8–9). The blot was stripped and reprobed with anti–β-actin antibody. (F) Urine glucose. (G) Urine sodium excretion (n = 5). (H) Urine volume (n = 5). (I) Urine osmolality (n = 5). *P < 0.05 vs. lean group, #P < 0.05 vs. DIO group. Statistical significance was determined by using ANOVA with the Bonferroni test for multiple comparisons. Data are shown as mean ± SEM.
Pharmacological investigation of the role of site-1 protease–derived sPRR in glucose metabolism in DIO mice.
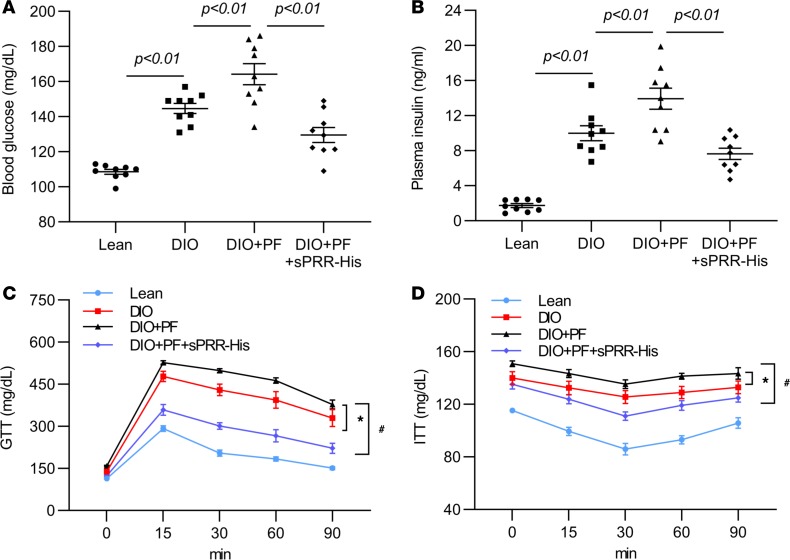
Earlier studies showed that the PRR cleavage process depended on furin or ADAM19 (10, 22). However, recent studies by Nakagawa et al. (23) and our group (24), in which different approaches were used, consistently identified site-1 protease (S1P) as the predominant or only source of sPRR production. This finding allowed evaluation of the involvement of S1P-derived endogenous sPRR in the current experimental model. Therefore, separate sets of C57/BL6 mice were fed HFD for 9 months and randomly divided into groups that received the vehicle, PF429242 (PF) alone, or PF in combination with sPRR-His for the last 2 weeks. Compared with the DIO group, the DIO + PF group showed greater increases in blood glucose and insulin levels, both of which were corrected by sPRR-His supplementation (Figure 7, A and B). In parallel, PF induced deterioration in GTT (Figure 7C) and ITT results (Figure 7D), both of which were improved by sPRR-His (Figure 7, A and B). The use of PF in this experiment substantiated the insulin-sensitizing role of endogenous sPRR.
Figure 7. The role of S1P-derived sPRR on glucose metabolism in DIO mice.
Male C57/BL6 mice were fed a HFD for 9 months and were treated with vehicle, PF alone, or PF in combination with sPRR-His for the last 2 weeks. (A) Plasma glucose. (B) Plasma insulin. (C) GTT. (D) ITT. n = 9 per group. *P < 0.05 vs. DIO group, #P < 0.05 vs. DIO + PF group. For C and D, xy analyses with area under curve and unpaired Student’s t test were performed. For A and B, statistical significance was determined by using ANOVA with the Bonferroni test for multiple comparisons. Data are shown as mean ± SEM.
In vitro investigation of S1P-derived sPRR in regulation of insulin sensitivity in differentiated 3T3 cells.
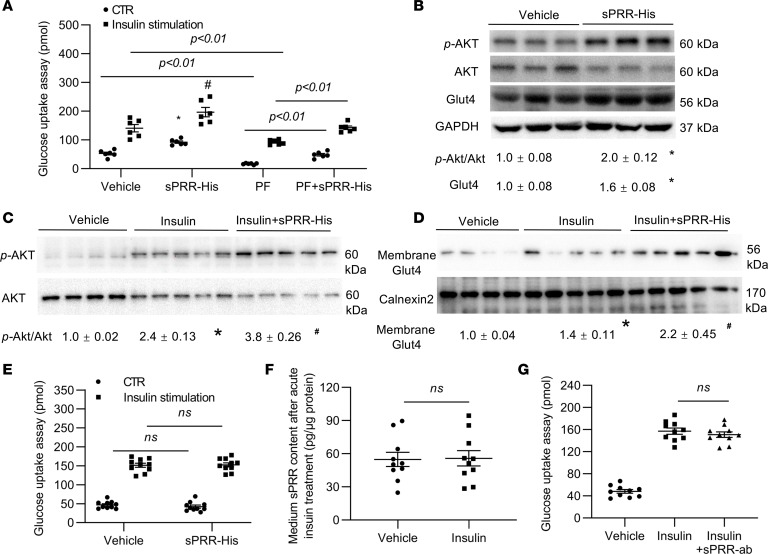
To test the role of sPRR as a direct insulin sensitizer, we examined the acute and chronic effects of sPRR-His on glucose uptake under basal conditions and during insulin treatment in differentiated 3T3 cells. The cells exposed to sPPR-His for 24 hours exhibited increased glucose uptake and response to insulin (Figure 8A). Basal and insulin-stimulated glucose uptake was sensitive to PF and was partially restored after addition of sPRR-His (Figure 8A). Immunoblotting showed that 24-hour sPRR-His treatment increased p-AKT protein abundance, accompanied by reduced total AKT, suggesting enhanced phosphorylation of AKT (Figure 8B). Similar increases were observed for Glut4 protein abundance (Figure 8B). A 20-minute insulin treatment increased protein abundance of p-AKT and Glut4, and this increase was greater in the presence of sPRR-His (Figure 8, C and D). In contrast, the 30-minute sPRR-His treatment had no effect on basal or insulin-stimulated glucose uptake (Figure 8E). Along these lines, the medium sPRR level was unaffected by the acute insulin treatment (Figure 8F). PRR antagonism with a PRR-neutralizing antibody did not affect insulin-induced glucose uptake in this acute setting (Figure 8G). Furthermore, in another insulin-sensitive cell type, vascular smooth muscle cells, sPRR-His did not affect glucose uptake induced by acute insulin treatment (Supplemental Figure 2). These results demonstrate that sPRR was capable of inducing glucose uptake and sensitizing insulin action only if pretreatment with sPRR-His was long enough (24 hours vs. 30 minutes).
Figure 8. The role of S1P-derived sPRR on insulin signaling in differentiated 3T3 cells.
The cells were pretreated for 24 hours with vehicle, sPRR-His, PF, or PF + sPRR-His and treated for 20 minutes with vehicle or insulin, followed by measurement of glucose uptake and examination of p-AKT/AKT and Glut4 protein abundances. (A) Glucose uptake (n = 6, repeated for 3 times). (B) Immunoblotting analysis of p-AKT, AKT, and Glut4 in the whole cell lysates of the cells in A exposed to vehicle or sPRR-His for 24 hours (n = 3, repeated for 3 times). The blot was stripped and reprobed with anti-AKT antibody. The same protein samples were run on a separate gel for detecting GAPDH. (C and D) Immunoblotting analysis of the effect of sPRR-His on insulin-induced activation of p-AKT and Glut4 (n = 5, repeated for 2 times). The blot was stripped and reprobed with anti-AKT antibody or anti-Calnexin2 antibody. The cells were pretreated for 24 hours with vehicle or sPRR-His and then treated for 20 minutes with insulin, followed by immunoblotting analysis of p-AKT, AKT, and Glut4. (E) Effect of short-term sPRR-His treatment on basal and insulin-induced glucose uptake (n = 10). (F) ELISA measurement of medium sPRR in cells treated with vehicle or insulin for 20 minutes (n = 10). (G) Effect of PRR-neutralizing antibody on insulin-induced glucose uptake (n = 10). The cells were pretreated for 1 hour with vehicle or antibody and then treated with insulin for 20 minutes, followed by measurement of glucose uptake. *P < 0.05 vs. vehicle/CTR group in A or vehicle group in B–D, #P < 0.05 vs. vehicle/insulin group in A or insulin group in C and D. Statistical significance was determined by using ANOVA with the Bonferroni test for multiple comparisons. Data are shown as mean ± SEM.
In vitro investigation of PRR as a direct target gene of PPARγ.
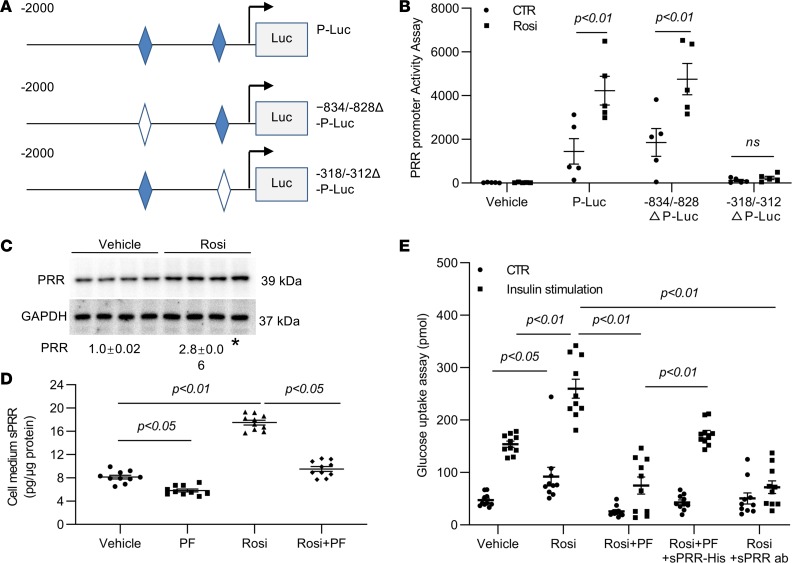
PPARγ plays an essential role in the regulation of glucose metabolism, as highlighted by the well-known insulin-sensitizing action of PPARγ agonists (25, 26). PPARγ typically acts via binding to the PPAR-response element (PPRE) in the promoter region of the target gene. Indeed, the PRR gene promoter contains 2 putative PRREs at positions –834 to –828 bp (AGGTCA) and –318 to –312 bp (GGTGCA). Subsequently, multiple constructs were generated to express luciferase under the control of a 2-kb 5′ flanking region of the PRR gene, with or without mutagenesis of the 2 PPRE sites (Figure 9A). Luciferase activity in differentiated 3T3L1 cells transfected with the 2-kb promoter region of PRR was induced more than 3-fold following rosiglitazone treatment (Figure 9B). The first PPRE at –834 to –828 was mutated from AGGTCA to TTTTCA and the second PPRE at –318 to –312 from GGTGCA to TTTGCA in the 2-kb PRR promoter region. This mutagenesis of the first PPRE was without effect (Figure 9B). In contrast, mutagenesis of the second PPRE abrogated the response to rosiglitazone treatment (Figure 9B), indicating that the second PRRE confers responsiveness to rosiglitazone. In agreement with this finding, immunoblotting analysis detected a significant increase in protein abundance of PRR in the differentiated 3T3 cells following rosiglitazone treatment (Figure 9C). Parallel increases were observed for medium sPRR, as detected by ELISA (Figure 9D). Rosiglitazone-induced sPRR production was blunted by PF, confirming its S1P origin (Figure 9D and Supplemental Figure 3). As a well-defined insulin sensitizer, rosiglitazone increased both baseline and insulin-induced glucose uptake, mimicking the effect of sPRR-His (Figure 9E). Indeed, the rosiglitazone-induced glucose uptake was completely abolished by a sPRR-neutralizing antibody and partially blunted by PF (Figure 9E). The addition of sPRR-His reversed the effect of PF (Figure 9E). Therefore, these in vitro results have established PRR as a direct PPARγ target gene and sPRR as a key mediator of PPARγ-dependent insulin-sensitizing action.
Figure 9. Definition of PRR as a direct target gene of PPARγ and in differentiated 3T3 cells.
(A) Schematic illustration of the mutagenesis of the 2 PPRE sites in the promoter of PRR. (B) Luciferase assay for PRR promoter activity. The 3T3 cells were transfected with empty vector or vectors carrying a 2-kb flanking region of the promoter with or without mutagenesis of either one of the PRRE sites (n = 5, repeat 2 times). (C) The effect of rosiglitazone (Rosi) on PRR protein expression (n = 4, repeat 3 times). The cells were treated for 24 hours with vehicle or Rosi, followed by immunoblotting analysis of PRR. The same samples were run on a separate gel for detecting GAPDH. The densitometry values are shown underneath the blots. (D) The effect of Rosi on sPRR production. The cells were treated for 24 hours with vehicle, PF, Rosi, or Rosi + PF, followed by ELISA measurement of medium sPRR (n = 10). (E) The role of sPRR in mediating Rosi-induced insulin sensitivity (n = 10). The cells were treated for 24 hours with vehicle, Rosi, Rosi + PF, Rosi + PF + sPRR-His, or Rosi + sPRR ab, and then each group was divided to receive vehicle or 20-minute insulin treatment, followed by the assay for glucose uptake. *P < 0.05 vs. vehicle (C). Statistical significance was determined by using ANOVA with the Bonferroni test. Data are shown as mean ± SEM. P-Luc, PRR promoter-luciferase constructor; Δ-P-Luc, PPRE mutation of PRR promoter-luciferase construction; sPRR ab, sPRR antibody.
In vivo investigation of the role of sPRR in PPARγ-dependent insulin-sensitizing action.
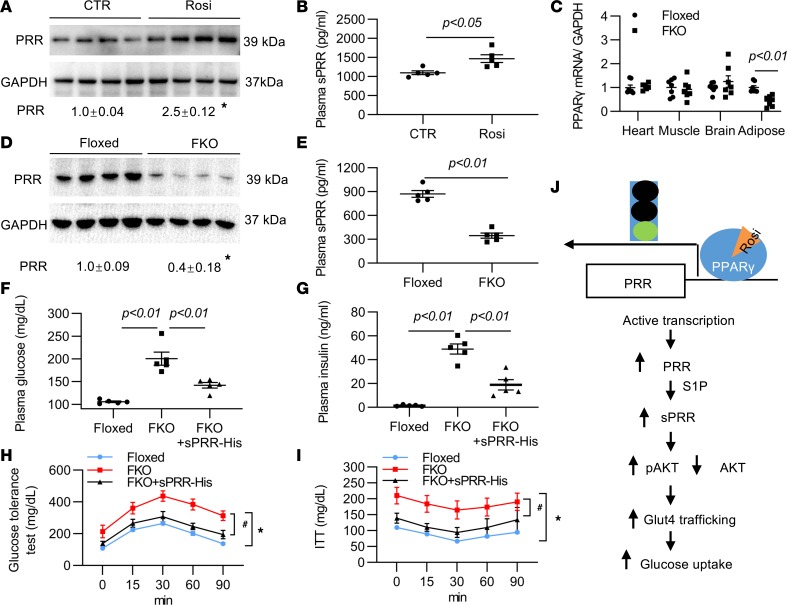
We further explored the in vivo role of sPRR in mediating the metabolic action of PPARγ in white adipose tissue (WAT). We administered rosiglitazone at 20 mg/kg/d to C57/BL6 mice for 4 days and performed immunoblotting analysis to evaluate adipose PRR protein expression and ELISA to detect plasma sPRR. Rosiglitazone treatment consistently increased adipose PRR protein abundance (Figure 10A) and plasma sPRR concentration (Figure 10B). To define the functional relationship between sPRR and PPARγ, we generated a mouse model of fat-specific PPARγ deletion (referred to herein as FKO) by crossing PPAR-floxed mice and adiponectin-Cre mice, as previously described (Figure 10C) (27). Compared with the floxed mice, FKO mice had reduced plasma sPRR levels (Figure 10E) and adipose PPR protein abundance (Figure 10D), suggesting WAT as a predominant source of circulating sPRR.
Figure 10. In vivo role of sPRR in mediating insulin sensitivity action of adipose PPARγ.
(A) Effect of rosiglitazone (Rosi) on adipose PRR protein abundance (n = 5 mice per group). Male C57/BL6 mice were treated with vehicle or Rosi for 4 days, followed by immunoblotting analysis of PRR protein abundance in WAT. The same samples were run on a separate gel for detecting GAPDH. (B) ELISA determination of plasma sPRR in the Rosi-treated mice (n = 5 per group). (C) The expression of PPARγ mRNA in various organs in floxed and adipocyte PPARγ-KO (FKO) mice (n = 5 per group). (D) Adipose PRR protein abundance in floxed and FKO mice (n = 5 per group). The same samples were run on a separate gel for detecting GAPDH. (E) ELISA determination of plasma sPRR in floxed and adipocyte PPARγ-KO mice (n = 5 per group). In the following experiments (F–I), adipocyte PPARγ-KO mice were treated for 2 weeks with vehicle or sPRR-His, followed by measurement of blood glucose (F), plasma insulin (G), GTT (H), and ITT (I). (J) Ischemic illustration of our major findings. Rosi binding to PPARγ transcriptionally regulates PRR, resulting increased S1P-dependent production of sPRR that activates p-AKT/Glut4, ultimately leading to increased glucose uptake. *P < 0.05 vs. CTR group (A) or the floxed mouse group (H and I), #P < 0.05 vs. FKO group (H and I). For H and I, xy analyses with area under curve and unpaired Student’s t test were performed. For the others, statistical significance was determined by using ANOVA with the Bonferroni test for multiple comparisons. Data are shown as mean ± SEM.
FKO mice developed hyperglycemia, hyperinsulinemia, and impaired GTT and ITT results, as previously described (27). We speculated that suppressed sPRR production might contribute to the diabetic phenotype in the null mouse. To address this possibility, we administered sPRR-His to FKO mice for 2 weeks and examined the consequences in metabolism. Despite no obvious differences in body weight in the mice, sPRR-His treatment significantly lowered blood glucose (Figure 10F) and plasma insulin (Figure 10G) and improved GTT (Figure 10H) and ITT results (Figure 10I) in FKO mice. These findings suggest that suppressed sPRR production in WAT may be directly responsible for diabetes and insulin resistance induced by adipose-specific PPARγ deletion.
Discussion
Circulating sPRR has been shown to be elevated in patients with metabolic diseases such as type 2 diabetes or in those with diabetic complications (12, 28–30). However, the functional role of sPRR in general and its role in energy metabolism in particular are poorly characterized. For the first time to our knowledge, here we report that a 2-week administration of sPRR-His in mice that had been fed a HFD for 9 months attenuated DIO and remarkably improved hyperglycemia, insulin resistance, steatosis, and albuminuria without plasma volume expansion or other toxicity, as seen with TZDs. sPRR-His activated the AKT/Glut4 pathway to enhance glucose uptake under basal conditions and during insulin treatment and functioned as an insulin sensitizer. PRR served as a direct target gene of PPARγ in WAT to mediate the insulin-sensitizing action of rosiglitazone. TZDs, including rosiglitazone, have been widely used for glycemic control in patients with type 2 diabetes, but their application has been limited due to the adverse effects of body weight gain and fluid retention, as occurs with other antidiabetic therapies. Therefore, sPRR-His represents a potentially novel class of insulin sensitizer that induces weight loss but not weight gain and does not expand plasma volume. Besides enhancing insulin sensitivity, sPRR-His functions as a negative regulator of renal SGLT2 protein expression, thus making it a highly effective antidiabetic agent. More importantly, sPRR-His is capable of managing multiple components of metabolic syndrome, including obesity, diabetes, steatosis, insulin resistance, and renal disease. In contrast, existing therapies mostly target a single component of metabolic syndrome or are limited by severe side effects. Therefore, from a therapeutic point of view, sPRR holds potential in the treatment of metabolic syndrome.
Despite intensive investigation, the pathophysiology of metabolic syndrome is poorly characterized, imposing a major obstacle in the development of a specific therapy for this disease. In addition to identifying potential therapeutic implications of sPRR, the present study also offers a potential mechanism to explain this pathophysiology. We found that plasma sPRR was elevated in DIO mice compared with that in lean controls and that the administration of exogenous sPRR-His remarkably improved various components of metabolic syndrome, including obesity, hyperglycemia, insulin resistance, steatosis, and renal complications. These results strongly suggest that PRR/sPRR may function as a master regulator of energy metabolism through coordinated action in multiple organs. In this way, activation of the PRR/sPRR system may reprogram multiple metabolic pathways in order to enable adaption to high energy intake. Accordingly, a maladaptive response of the PRR/sPRR system may represent a universal pathway leading to the pathogenesis of metabolic syndrome.
Along with the multiple metabolic effects of sPRR-His, we have extensively characterized its antidiabetic properties. A 2-week administration of sPRR-His in DIO mice remarkably improved hyperglycemia and insulin resistance; this was accompanied by an increase in the p-AKT/AKT ratio and the expression of Glut4. Furthermore, in vitro data provide direct evidence to support sPRR as an insulin sensitizer. Interestingly, chronic but not acute exposure of sPRR-His enhanced glucose uptake in response to acute insulin treatment in differentiated 3T3L1 cells. It is highly possible that sPRR-His primarily targets p-AKT/AKT and Glut4 to control insulin sensitivity. Given the slow mode of action, we speculate that sPRR may act through regulation of target gene expression rather than the protein/enzyme activity. The change in phosphorylation of AKT might be due to a secondary effect of sPRR-His.
TZDs, including pioglitazone and rosiglitazone, are the only current antidiabetic agents that function primarily by increasing insulin sensitivity through the activation of PPARγ (31, 32). However, despite clear benefits in glycemic control, this class of drugs has recently fallen into disuse due to concerns over side effects, including fluid retention, as reflected by body weight gain, edema, and a decrease in Hct levels (6, 32–38). Fluid retention with use of TZDs results from PPARγ-dependent fluid reabsorption in the collecting duct, among other mechanisms (8). It would be highly desirable to develop an alternative insulin-sensitizing agent with an improved safety profile. sPRR-His clearly meets this criterion, as it selectively mediates the insulin-sensitizing action of PPARγ but not that related to the toxicity of TZDs, as shown by the lack of weight gain or decrease in Hct levels following sPRR-His treatment. Therefore, sPRR-His holds great promise as an alternative insulin sensitizer with an improved safety profile.
Multiple lines of in vitro and in vivo evidence presented in the current study have established PPR as a direct target gene of PPARγ in WAT. First, the luciferase assay showed that rosiglitazone-stimulated PRR promoter activity differentiated 3T3L1 cells through a PPRE in the 5′ flanking region. Second, the glucose uptake assay demonstrated that exogenous and endogenous sPRR mediated the insulin-sensitizing activity of rosiglitazone in differentiated 3T3L1 cells. Third, circulating sPRR was reduced by 80% and adipose PRR protein expression was suppressed by adipocyte-specific deletion of PPARγ (FKO), but supplementation of sPRR in null mice significantly improved glycemic control. A better understanding of the adipose origin of circulating sPRR is clinically relevant, because elevated plasma sPRR is associated with early pregnancy (11, 12), preeclampsia (39, 40), gestational diabetes mellitus (12, 14), renal dysfunction in patients with heart failure (13), obstructive sleep apnea syndrome (15, 41, 42), and CKD due to hypertension and type 2 diabetes (43).
Additional evidence supporting the relationship between PRR and PPARγ is revealed by analysis of a mouse model of adipocyte-specific PRR deletion (termed PRRAdi/y) (44). PRRAdi/y mice developed severe lipodystrophy associated with hyperglycemia, hyperinsulinemia, and steatosis, a metabolic phenotype almost analogous to that of FKO mice. The identical phenotype between the 2 null strains supports interaction between the 2 genes. FKO-induced lipodystrophy highlights the well-known adipogenic action of PPARγ. The same lipodystrophy phenotype in PRRAdi/y mice suggests similar adipogenic action of PRR. However, sPRR-His treatment induces a decrease not an increase in fat mass in DIO mice, suggesting action of sPRR in the regulation of adipocyte biology that is distinct from what has been predicted from the phenotype of PRRAdi/y mice.
Despite the similar roles of PPARγ and PRR/sPRR in glycemic control, differences exist in other aspects of metabolism regulated by the 2 pathways. For example, weight gain as a result of fluid retention (7, 8) and/or adipogenesis (45) associated with cardiac hypertrophy represents a major side effect of TZDs. In contrast, as shown in Figure 1A, sPRR-His decreased body weight, likely due to enhanced energy expenditure. Since TZDs do not affect erythropoiesis, a decrease in Hct levels has been widely used as a standard marker of plasma volume expansion induced by TZDs in both humans and animals (46). Although sPRR-His possesses antidiuretic properties due to stimulation of renal aquaporin-2 expression in the collecting duct (17), it did not change Hct levels (Figure 1C), suggesting a lack of plasma volume expansion that is often seen with TZDs. Therefore, sPRR-His has advantages over TZDs in terms of its safety profile. The molecular mechanism responsible for the divergent effects of PPARγ and sPRR on body weight, adipogenesis, and fluid retention remains, however, elusive.
Obesity is also a major risk factor for NAFLD (21). Although multiple factors may contribute to the pathogenesis of NAFLD, insulin resistance is thought to play a major role because of its effect on increases in de novo lipogenesis and because it impairs the release of free fatty acids and triglycerides from the liver (47–49). TZDs and metformin are commonly used to control NAFLD, but their efficacy is limited (50, 51). In the present study, we found a striking effect of sPRR-His on the improvement of NAFLD. While the exact mechanism responsible for the beneficial hepatic effects of sPRR-His is unknown, such an effect can be due to improvement of insulin resistance, a well-known culprit in the pathogenesis of steatosis (52). Dysregulation of lipid metabolism is another important contributor to this disease (52, 53). It seems possible that components of lipid proteins other than triglycerides or cholesterol partially account for the antisteatosis effect of sPRR-His.
Obesity is also a risk factor of CKD (54). The DIO mice had increased urinary albumin excretion, which was attenuated by sPRR-His infusion. This result suggests renoprotective action of sPRR-His during DIO-induced renal injury. Further evidence shows that sPRR-His attenuates glomerular hyperfiltration, as assessed from the measurement of creatinine clearance in DIO mice. Glomerular hyperfiltration occurs in over 50% of patients with either type 1 or type 2 diabetes, representing an important contributor to DKD. The mechanism of diabetic glomerular hyperfiltration is complex, but dysregulation of SGLT2 is likely involved. SGLT2 is responsible for reabsorption of 90% of the filtered glucose, and inhibition of SGLT2-mediated glucose reabsorption is an effective therapy for glycemic control in diabetic patients. In addition, SGLT2 inhibitors are protective against DKD, likely through enhancement of TGF and the subsequent attenuation of glomerular hyperfiltration (55). Interestingly, we found that renal SGLT2 expression was significantly elevated in DIO mice, and this was effectively blocked by sPRR-His treatment. Unlike most of the pharmacological SGLT2 inhibitors, sPRR-His acts via suppression of SGLT2 expression, among other mechanisms, such as sensitization of insulin action, to achieve glycemic control. This phenomenon may also explain the renal beneficial effect of sPRR-His. As a result of SGLT2 inhibition, sodium delivery to the macula densa is enhanced, triggering TGF and thus attenuating glomerular hyperfiltration, ultimately protecting against renal injury due to DIO.
The present study has a number of limitations. For example, sPRR-His exerted broad actions against multiple components of metabolic syndrome, such as hyperglycemia, hepatic steatosis, and renal complications, but the investigation of the underlying mechanism of each of these actions may be insufficient. Although a mechanism to explain the insulin-sensitizing action of sPRR in differentiated 3T3 cells was presented, other cellular mechanisms pertinent to its actions in the liver and kidney remain elusive. In addition, although sPRR serves as a target of PPARγ, there is no explanation for how the 2 pathways exert distinct effects on body weight.
In summary, we examined the effects of sPRR-His on the metabolic profile in a DIO mouse model. sPRR-His exhibited robust multifaceted beneficial effects on obesity, hyperglycemia, insulin resistance, steatosis, albuminuria, and hyperfiltration. Moreover, PRR serves as a direct target gene of PPARγ in WAT, mediating the insulin-sensitizing action of TZDs (Figure 10J), and it also negatively regulates SGLT2, in the absence of fluid retention and weight gain. Overall, sPRR-His exhibits therapeutic potential for simultaneously managing multiple components of metabolic syndrome with an improved safety profile.
Methods
Supplemental Methods are available in the Supplemental Materials.
Animals.
Male 36-week-old DIO C57/BL6 mice and age-matched control diet mice were purchased from Taconic and fed the following diets for 8 months starting at the age of 1 month. After arrival, they received the same control diet, with 10% fat calories (D12450J, Research Diets), or HFD with 60% fat calories (D12492, Research Diets) for another month. All animals were cage housed and maintained in a temperature-controlled room with a 12:12-hour light/dark cycle. For the last 2 weeks, the DIO mice randomly received intravenous infusion of vehicle or sPRR-His at 30 μg/kg/d alone. The infusion was driven by an osmotic mini-pump (Alzet model 1002, Alza) with a catheter placed in the jugular vein. In another experiment, to address the role of endogenous sPRR, the DIO mice randomly received vehicle, PF alone, or PF in combination with sPRR-His for the last 2 weeks. The composition of the solution (20 μM Tris, 150 μM NaCl, 0.01% glycerol, and pH 7.5) in the vehicle group was the same as the solution in sPRR-His group. PF was subcutaneously infused at 20 mg/kg/d via a separate mini-pump. Inclusion and exclusion criteria were developed before the study.
Conditional gene KO mouse experiments.
Mice with conditional deletion of PPARγ in adipose tissue (FKO mice) were generated by genetic crosses between PPARγ-floxed mice and adiponectin-Cre mice, as previously described (27). Male 10- to 12-week-old null mice and their respective littermate floxed control mice were used for all experiments. All animals were acclimatized to metabolic cages for 7 days. After collection of baseline data for 2 days, the PPARγ-null mice were infused with sPRR-His. At the end of the experiment, blood was drawn from the vena cava and epididymal fat and liver were snap-frozen in liquid nitrogen.
GTT and ITT.
After 2 weeks of sPRR-His infusion, an ITT was performed on mice after an 8-hour fast, and blood samples were drawn at different times following insulin injection (0.75 U/kg i.p.). For the GTT, mice were fasted for 8 hours, and blood samples were taken from tail veins after the 1 g/kg glucose injection. Blood glucose concentrations were measured by using a glucometer (OneTouch).
Comprehensive lab animal monitoring system metabolic chamber experiments.
Each mouse was measured individually in a resting state for 24 hours at 23°C in the presence of food and water by using a computer-controlled, comprehensive lab animal monitoring system (Columbus Instruments). Body weight, food intake, water intake, O2 consumption, CO2 production, heat production, and respiration exchange ratio were measured automatically.
Plasma volume determination.
Under general anesthesia with isoflurane (2 mL/min), FITC-dextran 500000-conjugate (FITC-d, 2 mg/100 g 46947–100MG-F, MilliporeSigma) was injected into the jugular vein. Seven minutes later, blood was withdrawn from the vena cava. Plasma was separated by centrifugation of the blood at 2700 g for 10 minutes in the dark. Fluorescence levels were measured at an excitation wavelength of 485 nm and emission wavelength of 520 nm (Synergy Neo2 Hybrid Multi-Mode Reader, BioTek Instruments), and the FITC-d concentration per milliliter of plasma was calculated based on a standard curve generated by serial dilution of the 2 mg/mL FITC-d solution. The standard curve was linear and highly reproducible. The plasma volume data are shown as relative values normalized by body weight.
GFR measurement.
Mice were injected with FITC-sinistrin (Mannheim Pharma and Diagnostics) retro-orbitally (7.5 mg/100 g body weight). The NIC-Kidney (Mannheim Pharma and Diagnostics) was used to detect fluorescence in the skin on the shaved back over 1 hour. GFR was calculated based on the kinetics of fluorescence decay.
Cell culture and differentiation.
Mouse 3T3-L1 preadipocytes (ATCC) were cultured with DMEM containing 10% donor calf serum in an atmosphere of 10% CO2 at 37°C. Two days after the 3T3-L1 fibroblasts had reached confluence, differentiation was induced by treating the cells with DMEM containing 4 μg/mL dexamethasone, 0.5 mM 3-isobutyl1-methylxanthine, 200 nM insulin, and 10% FBS for 48 hours. Cells were fed DMEM supplemented with 10% FBS every other day and used as mature 3T3-L1 adipocytes on day 8 after the induction of differentiation.
2-Deoxyglucose uptake assay.
The mature 3T3-L1 adipocytes were starved for 12 hours and then treated with sPRR-His (10 nM), PF (10 μM), anti-PRR antibody (1.5 μg/mL), and rosiglitazone (1 μM) alone or in combination for 24 hours or 30 minutes. Glucose uptake was then assessed by using a 2-Deoxyglucose (2-DG) Uptake Assay Kit according to the manufacturer’s instructions (Abcam, ab136955). Briefly, adipocytes were starved in serum-free medium overnight and then Krebs-Ringer-Phosphate-HEPES buffer with 2% bovine serum albumin for 40 minutes. After insulin stimulation, the glucose analog 2-DG was added to cells, and the accumulated 2-DG6P was oxidized to generate NADPH, which resulted in oxidation of a substrate. The oxidized substrate could then be detected at optical density = 412 nm.
Preparation of luciferase constructs.
Genomic DNA was extracted from rat tails by using a Tissue DNA Kit (D3396-01, Promega). A 2016-bp fragment of the 5′ flanking region of the PRR gene (GenBank accession NM_001007091; 1941 ± 75 bp) was amplified from the rat genomic DNA by PCR and subcloned to the pGL3-Luc Basic reporter vector (Promega) by using NheI and BgIII restriction sites (termed pGL3-PRR-Luc). The PRR promoter contains 2 putative PRREs at positions –834 to –828 bp (AGGTCA) and –318 to –312 bp (GGTGCA). To mutate these 2 putative PPREs, we performed PCR with the following 2 primer sets: primer set 1, forward primer 5′-CATCTTTCATTTTCATCAGCTGGG-3′ and reverse primer 5′-CCCAGCTGATGAAAATGAAAGATG-3′; primer set 2, forward primer 5′-GGGAGGGATTTGCAAGATCGGG-3′ and reverse primer 5′-CCCGATCTTGCAAATCCCTCCC-3′. After that, in the PRR promoter region, the putative PPRE sites at positions –834 to –828 bp and –318 to –312 bp were mutated to TTTTCA and TTTGCA, respectively. These PCR products were subcloned to the pGL3-Luc Basic reporter vector to generate −834/–828Δ pGL3-PRR-Luc and –318/–312Δ pGL3-PRR-Luc. The identity of these constructs was validated by sequencing.
Luciferase assay.
The mature 3T3-L1 adipocytes were transfected with pGL3-PRR-Luc or –834/–828Δ pGL3-PRR-Luc or –318/–312Δ pGL3-PRR-Luc or empty vector by using HiPerFect Transfection Reagent (301702, Qiagen). After 72 hours, all cells were starved for 12 hours; then the transfected cells were then treated for 24 hours with rosiglitazone (1 μM). The vehicle-treated group served as a control. The luciferase activities were measured by using a luciferase assay system (Promega), and luminescence was detected by using an illuminometer (BMG FLUOstar OPTIMA).
Enzyme immunoassay.
Insulin, triglyceride, cholesterol, HDL, LDL/VLDL, ALT, AST, PDH, and sPRR levels in biological fluids or tissue lysis were determined by using the following commercially available enzyme immunoassay kits according to the manufacturer’s instructions: insulin (90080, Crystal Chem), triglyceride (10010303, Cayman), cholesterol (ab65359, Abcam), HDL and LDL/VLDL (ab65390, Abcam), ALT (MBS2500279, MyBiosource), AST (MBS265501, MyBiosource), PDH (ab109902, Abcam), and sPRR (JP27782, IBL).
Immunoblotting.
Adipose and muscle tissues were lysed and subsequently sonicated. Protein concentrations were determined by using Coomassie reagent (23238, Thermo Fisher). Forty micrograms of protein for each sample was denatured in boiling water, separated by SDS-PAGE gels, and transferred onto nitrocellulose membranes. Blots were blocked for 1 hour with 5% nonfat dry milk in Tris-buffered saline (TBS), followed by incubation overnight with primary antibody. After washing with TBS, blots were incubated with goat anti–rabbit/mouse/goat horseradish peroxidase–conjugated secondary antibody and visualized by using enhanced chemiluminescence. The blots were quantitated by using Image-Pro Plus. The primary antibodies were as follows: rabbit anti-Glut4 (ab654, Abcam), rabbit anti–Phospho-Akt (Ser473) (4060 CST), rabbit anti-S1P (140592, Abcam), and rabbit anti-Akt (9272, CST).
qRT-PCR.
Total RNA was isolated from a variety of organs and reverse transcribed to cDNA. Oligonucleotides were designed using Primer3 software (http://bioinfo.ut.ee/primer3-0.4.0/). Primers for PPARγ were as follows: 5′-TCCAGCATTTCTGCTCCACA-3′ (sense) and 5′-ACAGACTCGGCACTCAATGG-3′ (antisense); primers for GAPDH were as follows: 5′-GTCTTCACTACCATGGAGAAGG-3′ (sense) and 5′-TCATGGATGACCTTGGCCAG-3′ (antisense).
Oil Red O staining.
At the end of treatment, the liver was fixed in freshly prepared 4% paraformaldehyde and stained with Oil Red O (MilliporeSigma). Cells were mounted with Vestashield mounting solution with 4′,6′-diamidino-2-phenylindole (Vector Laboratories) and visualized under a fluorescence microscope (Zeiss Axioplan microscope with Zeiss HRc camera, Zeiss).
Data availability.
All data generated or analyzed during this study are included in this article.
Statistics.
Data are represented as mean ± SEM. All data points and animals were included in the statistical analyses. Sample sizes were determined on the basis of similar previous studies or pilot experiments. For the GTT and ITT assays, xy analyses with the area under the curve and an unpaired 2-tailed Student’s t test were performed. The other animal and cell culture experiments were performed by using 1-way ANOVA with the Bonferroni test for multiple comparisons or by using the paired or unpaired 2-tailed Student’s t test for 2 comparisons. A value of P < 0.05 was considered statistically significant.
Study approval.
Animal protocols were approved by the Animal Care and Use Committee at the University of Utah.
Author contributions
TY planned and supervised the project. TY, FW, and RL designed the research studies, analyzed the data, and wrote the manuscript. FW, RL, SX, KP, LZ, KTY, and CX contributed to conducting experiments and acquiring data. CJZ provided the KO animals.
Supplementary Material
Acknowledgments
We thank Daniel Scoles (University of Utah) for critical reading of this manuscript. This work was supported by NIH grants DK104072, HL135851, and HL139689 and VA Merit Review from the Department of Veterans Affairs. TY is a Research Career Scientist in the Department of Veterans Affairs.
Version 1. 04/09/2020
Electronic publication
Footnotes
Conflict of interest: The authors have declared that no conflict of interest exists.
Copyright: © 2020, American Society for Clinical Investigation.
Reference information: JCI Insight. 2020;5(3):e128061.https://doi.org/10.1172/jci.insight.128061.
Contributor Information
Fei Wang, Email: fei.wang@hsc.utah.edu.
Renfei Luo, Email: 291352349@qq.com.
Chang-Jiang Zou, Email: chang-jiang.zou@hsc.utah.edu.
Shiying Xie, Email: 415345887@qq.com.
Kexin Peng, Email: pengkexin2010@126.com.
Long Zhao, Email: zhaolong0536@126.com.
Chuanming Xu, Email: chuanming.xu@hsc.utah.edu.
Tianxin Yang, Email: tianxin.yang@hsc.utah.edu.
References
- 1.Flegal KM, Carroll MD, Ogden CL, Johnson CL. Prevalence and trends in obesity among US adults, 1999-2000. JAMA. 2002;288(14):1723–1727. doi: 10.1001/jama.288.14.1723. [DOI] [PubMed] [Google Scholar]
- 2.Mokdad AH, et al. Prevalence of obesity, diabetes, and obesity-related health risk factors, 2001. JAMA. 2003;289(1):76–79. doi: 10.1001/jama.289.1.76. [DOI] [PubMed] [Google Scholar]
- 3.Alberti KG, Zimmet P, Shaw J, IDF Epidemiology Task Force Consensus Group The metabolic syndrome--a new worldwide definition. Lancet. 2005;366(9491):1059–1062. doi: 10.1016/S0140-6736(05)67402-8. [DOI] [PubMed] [Google Scholar]
- 4. Canadian Agency for Drugs and Technologies in Health (CADTH). New Drugs for Type 2 Diabetes: Second-Line Therapy — Science Report. Ottawa, Ontario, Canada: CADTH; 2017. CADTH Therapeutic Review, vol 4.1. [PubMed] [Google Scholar]
- 5.Füchtenbusch M, Standl E, Schatz H. Clinical efficacy of new thiazolidinediones and glinides in the treatment of type 2 diabetes mellitus. Exp Clin Endocrinol Diabetes. 2000;108(3):151–163. doi: 10.1055/s-2000-7737. [DOI] [PubMed] [Google Scholar]
- 6.Kung J, Henry RR. Thiazolidinedione safety. Expert Opin Drug Saf. 2012;11(4):565–579. doi: 10.1517/14740338.2012.691963. [DOI] [PubMed] [Google Scholar]
- 7.Guan Y, et al. Thiazolidinediones expand body fluid volume through PPARgamma stimulation of ENaC-mediated renal salt absorption. Nat Med. 2005;11(8):861–866. doi: 10.1038/nm1278. [DOI] [PubMed] [Google Scholar]
- 8.Zhang H, Zhang A, Kohan DE, Nelson RD, Gonzalez FJ, Yang T. Collecting duct-specific deletion of peroxisome proliferator-activated receptor gamma blocks thiazolidinedione-induced fluid retention. Proc Natl Acad Sci USA. 2005;102(26):9406–9411. doi: 10.1073/pnas.0501744102. [DOI] [PMC free article] [PubMed] [Google Scholar]
- 9.Nguyen G, Delarue F, Burcklé C, Bouzhir L, Giller T, Sraer JD. Pivotal role of the renin/prorenin receptor in angiotensin II production and cellular responses to renin. J Clin Invest. 2002;109(11):1417–1427. doi: 10.1172/JCI14276. [DOI] [PMC free article] [PubMed] [Google Scholar]
- 10.Cousin C, Bracquart D, Contrepas A, Corvol P, Muller L, Nguyen G. Soluble form of the (pro)renin receptor generated by intracellular cleavage by furin is secreted in plasma. Hypertension. 2009;53(6):1077–1082. doi: 10.1161/HYPERTENSIONAHA.108.127258. [DOI] [PubMed] [Google Scholar]
- 11.Watanabe N, et al. Soluble (pro)renin receptor and blood pressure during pregnancy: a prospective cohort study. Hypertension. 2012;60(5):1250–1256. doi: 10.1161/HYPERTENSIONAHA.112.197418. [DOI] [PubMed] [Google Scholar]
- 12.Watanabe N, Morimoto S, Fujiwara T, et al. Prediction of gestational diabetes mellitus by soluble (pro)renin receptor during the first trimester. J Clin Endocrinol Metab. 2013;98(6):2528–2535. doi: 10.1210/jc.2012-4139. [DOI] [PubMed] [Google Scholar]
- 13.Fukushima A, et al. Increased plasma soluble (pro)renin receptor levels are correlated with renal dysfunction in patients with heart failure. Int J Cardiol. 2013;168(4):4313–4314. doi: 10.1016/j.ijcard.2013.04.176. [DOI] [PubMed] [Google Scholar]
- 14.Bonakdaran S, Azami G, Tara F, Poorali L. Soluble (pro) renin receptor is a predictor of gestational diabetes mellitus. Curr Diabetes Rev. 2017;13(6):555–559. doi: 10.2174/1573399812666160919100253. [DOI] [PubMed] [Google Scholar]
- 15.Nishijima T, et al. Elevated plasma levels of soluble (pro)renin receptor in patients with obstructive sleep apnea syndrome in parallel with the disease severity. Tohoku J Exp Med. 2016;238(4):325–338. doi: 10.1620/tjem.238.325. [DOI] [PubMed] [Google Scholar]
- 16.Kreienbring K, et al. Predictive and prognostic value of sPRR in patients with primary epithelial ovarian cancer. Anal Cell Pathol (Amst) 2016;2016:6845213. doi: 10.1155/2016/6845213. [DOI] [PMC free article] [PubMed] [Google Scholar]
- 17.Lu X, et al. Soluble (pro)renin receptor via β-catenin enhances urine concentration capability as a target of liver X receptor. Proc Natl Acad Sci USA. 2016;113(13):E1898–E1906. doi: 10.1073/pnas.1602397113. [DOI] [PMC free article] [PubMed] [Google Scholar]
- 18.Yang KT, Wang F, Lu X, Peng K, Yang T, David Symons J. The soluble (Pro) renin receptor does not influence lithium-induced diabetes insipidus but does provoke beiging of white adipose tissue in mice. Physiol Rep. 2017;5(21):e13410. doi: 10.14814/phy2.13410. [DOI] [PMC free article] [PubMed] [Google Scholar]
- 19.Bergman RN, Iyer MS. Indirect regulation of endogenous glucose production by insulin: the single gateway hypothesis revisited. Diabetes. 2017;66(7):1742–1747. doi: 10.2337/db16-1320. [DOI] [PubMed] [Google Scholar]
- 20.Zhang Z, Liu H, Liu J. Akt activation: A potential strategy to ameliorate insulin resistance. Diabetes Res Clin Pract. 2019;156:107092. doi: 10.1016/j.diabres.2017.10.004. [DOI] [PubMed] [Google Scholar]
- 21.Mills EP, Brown KPD, Smith JD, Vang PW, Trotta K. Treating nonalcoholic fatty liver disease in patients with type 2 diabetes mellitus: a review of efficacy and safety. Ther Adv Endocrinol Metab. 2018;9(1):15–28. doi: 10.1177/2042018817741852. [DOI] [PMC free article] [PubMed] [Google Scholar]
- 22.Yoshikawa A, et al. The (pro)renin receptor is cleaved by ADAM19 in the Golgi leading to its secretion into extracellular space. Hypertens Res. 2011;34(5):599–605. doi: 10.1038/hr.2010.284. [DOI] [PubMed] [Google Scholar]
- 23.Nakagawa T, et al. Site-1 protease is required for the generation of soluble (pro)renin receptor. J Biochem. 2017;161(4):369–379. doi: 10.1093/jb/mvw080. [DOI] [PubMed] [Google Scholar]
- 24.Fang H, et al. (Pro)renin receptor mediates albumin-induced cellular responses: role of site-1 protease-derived soluble (pro)renin receptor in renal epithelial cells. Am J Physiol, Cell Physiol. 2017;313(6):C632–C643. doi: 10.1152/ajpcell.00006.2017. [DOI] [PMC free article] [PubMed] [Google Scholar]
- 25.Kaul S, Bolger AF, Herrington D, Giugliano RP, Eckel RH. Thiazolidinedione drugs and cardiovascular risks: a science advisory from the American Heart Association and American College of Cardiology Foundation. Circulation. 2010;121(16):1868–1877. doi: 10.1161/CIR.0b013e3181d34114. [DOI] [PubMed] [Google Scholar]
- 26.Wagstaff AJ, Goa KL. Spotlight on rosiglitazone in the management of type 2 diabetes mellitus. Treat Endocrinol. 2002;1(6):411–414. doi: 10.2165/00024677-200201060-00006. [DOI] [PubMed] [Google Scholar]
- 27.Wang F, Mullican SE, DiSpirito JR, Peed LC, Lazar MA. Lipoatrophy and severe metabolic disturbance in mice with fat-specific deletion of PPARγ. Proc Natl Acad Sci USA. 2013;110(46):18656–18661. doi: 10.1073/pnas.1314863110. [DOI] [PMC free article] [PubMed] [Google Scholar]
- 28.Sugulle M, et al. Soluble (pro)renin receptor in preeclampsia and diabetic pregnancies. J Am Soc Hypertens. 2017;11(10):644–652. doi: 10.1016/j.jash.2017.08.001. [DOI] [PubMed] [Google Scholar]
- 29.Kanda A, Noda K, Saito W, Ishida S. (Pro)renin receptor is associated with angiogenic activity in proliferative diabetic retinopathy. Diabetologia. 2012;55(11):3104–3113. doi: 10.1007/s00125-012-2702-2. [DOI] [PubMed] [Google Scholar]
- 30.Bokuda K, Ichihara A. Possible contribution of (pro)renin receptor to development of gestational diabetes mellitus. World J Diabetes. 2014;5(6):912–916. doi: 10.4239/wjd.v5.i6.912. [DOI] [PMC free article] [PubMed] [Google Scholar]
- 31.Soccio RE, Chen ER, Lazar MA. Thiazolidinediones and the promise of insulin sensitization in type 2 diabetes. Cell Metab. 2014;20(4):573–591. doi: 10.1016/j.cmet.2014.08.005. [DOI] [PMC free article] [PubMed] [Google Scholar]
- 32.Stumvoll M, Häring HU. Glitazones: clinical effects and molecular mechanisms. Ann Med. 2002;34(3):217–224. doi: 10.1080/ann.34.3.217.224. [DOI] [PubMed] [Google Scholar]
- 33.Ruan X, Zheng F, Guan Y. PPARs and the kidney in metabolic syndrome. Am J Physiol Renal Physiol. 2008;294(5):F1032–F1047. doi: 10.1152/ajprenal.00152.2007. [DOI] [PubMed] [Google Scholar]
- 34.Cariou B, Charbonnel B, Staels B. Thiazolidinediones and PPARγ agonists: time for a reassessment. Trends Endocrinol Metab. 2012;23(5):205–215. doi: 10.1016/j.tem.2012.03.001. [DOI] [PubMed] [Google Scholar]
- 35.Patel C, Wyne KL, McGuire DK. Thiazolidinediones, peripheral oedema and congestive heart failure: what is the evidence? Diab Vasc Dis Res. 2005;2(2):61–66. doi: 10.3132/dvdr.2005.010. [DOI] [PubMed] [Google Scholar]
- 36.Bełtowski J, Rachańczyk J, Włodarczyk M. Thiazolidinedione-induced fluid retention: recent insights into the molecular mechanisms. PPAR Res. 2013;2013:628628. doi: 10.1155/2013/628628. [DOI] [PMC free article] [PubMed] [Google Scholar]
- 37.Rubenstrunk A, Hanf R, Hum DW, Fruchart JC, Staels B. Safety issues and prospects for future generations of PPAR modulators. Biochim Biophys Acta. 2007;1771(8):1065–1081. doi: 10.1016/j.bbalip.2007.02.003. [DOI] [PubMed] [Google Scholar]
- 38.Sotiropoulos KB, et al. Adipose-specific effect of rosiglitazone on vascular permeability and protein kinase C activation: novel mechanism for PPARgamma agonist’s effects on edema and weight gain. FASEB J. 2006;20(8):1203–1205. doi: 10.1096/fj.05-4617fje. [DOI] [PubMed] [Google Scholar]
- 39.Thomason J, et al. Elevation of (pro)renin and (pro)renin receptor in preeclampsia. Am J Hypertens. 2015;28(10):1277–1284. doi: 10.1093/ajh/hpv019. [DOI] [PubMed] [Google Scholar]
- 40.Nartita T, et al. Corrigendum to “Placental (pro)renin receptor expression and plasma soluble (pro)renin receptor levels in preeclampsia” [YPLAC 37C (2016) 72-78] Placenta. 2016;47:130. doi: 10.1016/j.placenta.2015.11.007. [DOI] [PubMed] [Google Scholar]
- 41.Nishijima T, Tajima K, Takahashi K, Sakurai S. Elevated plasma levels of soluble (pro)renin receptor in patients with obstructive sleep apnea syndrome: association with polysomnographic parameters. Peptides. 2014;56:14–21. doi: 10.1016/j.peptides.2014.03.008. [DOI] [PubMed] [Google Scholar]
- 42.Takahashi K, Ohba K, Tajima K, Nishijima T, Sakurai S. Soluble (pro)renin receptor and obstructive sleep apnea syndrome: oxidative stress in brain? Int J Mol Sci. 2017;18(6):E1313. doi: 10.3390/ijms18061313. [DOI] [PMC free article] [PubMed] [Google Scholar]
- 43.Hamada K, et al. Serum level of soluble (pro)renin receptor is modulated in chronic kidney disease. Clin Exp Nephrol. 2013;17(6):848–856. doi: 10.1007/s10157-013-0803-y. [DOI] [PubMed] [Google Scholar]
- 44.Wu CH, et al. Adipocyte (pro)renin-receptor deficiency induces lipodystrophy, liver steatosis and increases blood pressure in male mice. Hypertension. 2016;68(1):213–219. doi: 10.1161/HYPERTENSIONAHA.115.06954. [DOI] [PMC free article] [PubMed] [Google Scholar]
- 45.Lowell BB. PPARgamma: an essential regulator of adipogenesis and modulator of fat cell function. Cell. 1999;99(3):239–242. doi: 10.1016/S0092-8674(00)81654-2. [DOI] [PubMed] [Google Scholar]
- 46.Hollenberg NK. Considerations for management of fluid dynamic issues associated with thiazolidinediones. Am J Med. 2003;115 Suppl 8A:111S–115S. doi: 10.1016/j.amjmed.2003.09.018. [DOI] [PubMed] [Google Scholar]
- 47.Buzzetti E, Pinzani M, Tsochatzis EA. The multiple-hit pathogenesis of non-alcoholic fatty liver disease (NAFLD) Metab Clin Exp. 2016;65(8):1038–1048. doi: 10.1016/j.metabol.2015.12.012. [DOI] [PubMed] [Google Scholar]
- 48.Li Y, Liu L, Wang B, Wang J, Chen D. Metformin in non-alcoholic fatty liver disease: A systematic review and meta-analysis. Biomed Rep. 2013;1(1):57–64. doi: 10.3892/br.2012.18. [DOI] [PMC free article] [PubMed] [Google Scholar]
- 49.Loomba R, et al. Clinical trial: pilot study of metformin for the treatment of non-alcoholic steatohepatitis. Aliment Pharmacol Ther. 2009;29(2):172–182. doi: 10.1111/j.1365-2036.2008.03869.x. [DOI] [PMC free article] [PubMed] [Google Scholar]
- 50.Le TA, Loomba R. Management of non-alcoholic fatty liver disease and steatohepatitis. J Clin Exp Hepatol. 2012;2(2):156–173. doi: 10.1016/S0973-6883(12)60104-2. [DOI] [PMC free article] [PubMed] [Google Scholar]
- 51.Trappoliere M, et al. The treatment of NAFLD. Eur Rev Med Pharmacol Sci. 2005;9(5):299–304. [PubMed] [Google Scholar]
- 52.Arab JP, Arrese M, Trauner M. Recent insights into the pathogenesis of nonalcoholic fatty liver disease. Annu Rev Pathol. 2018;13:321–350. doi: 10.1146/annurev-pathol-020117-043617. [DOI] [PubMed] [Google Scholar]
- 53.Luo X, Li R, Yan LJ. Roles of pyruvate, NADH, and mitochondrial complex I in redox balance and imbalance in beta cell function and dysfunction. J Diabetes Res. 2015;2015:512618. doi: 10.1155/2015/512618. [DOI] [PMC free article] [PubMed] [Google Scholar]
- 54.Desai N, Lora CM, Lash JP, Ricardo AC. CKD and ESRD in US Hispanics. Am J Kidney Dis. 2019;73(1):102–111. doi: 10.1053/j.ajkd.2018.02.354. [DOI] [PMC free article] [PubMed] [Google Scholar]
- 55.Vallon V. The mechanisms and therapeutic potential of SGLT2 inhibitors in diabetes mellitus. Annu Rev Med. 2015;66:255–270. doi: 10.1146/annurev-med-051013-110046. [DOI] [PubMed] [Google Scholar]
Associated Data
This section collects any data citations, data availability statements, or supplementary materials included in this article.
Supplementary Materials
Data Availability Statement
All data generated or analyzed during this study are included in this article.


