

Abstract
Background and aims
The present study aims to investigate the role of the prognostic nutritional index (PNI) on survival in patients with advanced hepatocellular carcinoma (HCC) treated with sorafenib.
Methods
This multicentric study included a training cohort of 194 HCC patients and three external validation cohorts of 129, 76 and 265 HCC patients treated with Sorafenib, respectively. The PNI was calculated as follows: 10 × serum albumin (g/dL) + 0.005 × total lymphocyte count (per mm3). Univariate and multivariate analyses were performed to investigate the association between the covariates and the overall survival (OS).
Results
A PNI cut-off value of 31.3 was established using the ROC analysis. In the training cohort, the median OS was 14.8 months (95% CI 12–76.3) and 6.8 months (95% CI 2.7–24.6) for patients with a high (>31.3) and low (<31.3) PNI, respectively. At both the univariate and the multivariate analysis, low PNI value (p = 0.0004), a 1-unit increase of aspartate aminotransferase (p = 0.0001), and age > 70 years (p< 0.0038) were independent prognostic factors for OS. By performing the same multivariate analysis of the training cohort, the PNI <31.3 versus >31.3 was found to be an independent prognostic factor for predicting OS in all the three validation cohorts.
Conclusions
PNI represents a prognostic tool in advanced HCC treated with first-line Sorafenib. It is readily available and low-cost, and it could be implemented in clinical practice in patients with HCC.
1. Introduction
Hepatocellular carcinoma (HCC) is the most common primary malignancy of the liver [1]. It represents the fifth most common cancer worldwide and the second cause of cancer mortality [2]. Sorafenib, an oral multikinase inhibitor (VEGFR- 1/2/3, PDGFR, Flt3, c-Kit, and Raf kinases), has been considered the standard of care for patients with advanced unresectable HCC since 2007 [3,4]. In the literature, several clinical and biochemical factors have been described as predictive or prognostic markers in patients with HCC treated with Sorafenib, such as etiology [5–7], Child-Pugh status [8], Barcelona Clinic Liver Cancer (BCLC) [5], medical drugs [9,10], Body Mass Index (BMI) [11], macroscopic vascular invasion (MVI) [5], Aspartate aminotransferase (AST) [12], Albumin-Bilirubin (ALBI) grade [13], Alpha-fetoprotein (AFP) [5,14,15], Lactate Dehydrogenase (LDH) [15,16], Neutrophil-to-lymphocyte ratio (NLR) [5,16,17], Immune-inflammation index (SII) [17,18], and drug-related adverse events (AE) [19,20]. In addition, the pattern of progression [21] and the reason for Sorafenib discontinuation [22] have been reported to have a significant correlation with survival. Furthermore, biological parameters, as serum and plasma proteins [23], genetic markers [24–26], microRNAs [27], and tissue biomarkers [28] have been investigated. At the moment other potential new biomarkers are under exploration, as the so-called OMICS revolution, Radiomics, and Liquid Biopsy [29].None, of these factors has been validated [30] and they are not usually used in clinical practice to select patients in making clinical decisions.
In this context, the prognostic nutritional index (PNI), is a multiparametric indicator based on serum albumin and peripheral lymphocyte count [31], has shown to reflect both the immune-inflammatory and nutritional status of patients [32], even if in HCC it particularly reflects the liver disfunction underlying this cancer. Interestingly, the PNI has demonstrated to correlate with survival outcomes of patients with several gastrointestinal cancers [33,34], including HCC [35–37] but not in advanced stage. [38].
In the present study, we have investigated the impact of the PNI index on survival outcomes in four independent cohorts of advanced HCC treated with sorafenib.
2. Materials and methods
This multicentric Italian study was conducted on a training cohort of 194 HCC patients consecutively treated at Istituto Scientifico Romagnolo per lo Studio e la Cura dei Tumori from 2007 to 2015. Three validation cohorts of HCC patients were consecutively recruited by the University of Bologna for the first cohort, a multicentric prospective study (INNOVATE study) [39] for the second cohort and from the University of Palermo and IOV Veneto of Padua for the third cohort.
Patients with histologically or radiologically (according to the American Association for the Study of Liver Diseases 2005 guidelines) proven advanced- or intermediate-stage (refractory or unsuitable for loco-regional therapies) HCC treated with sorafenib in real life were eligible for our analysis. Patients who had received previous systemic therapies were excluded. All patients received sorafenib according to standard schedule (400 mg bid continuously); dose reduction was applied as clinically indicated. Follow-up consisted of a CT/MRI scan every 8 weeks or as clinically indicated. Tumor response was evaluated by modified Response Evaluation Criteria in Solid Tumors (mRECIST) [43]. Treatment with sorafenib was continued until disease progression, unacceptable toxicity or death.
The study protocol was reviewed and approved by the local Ethics Committee (CEIIAV: comitato etico IRST IRCCS AVR and CE-AVEC: comitato etico Bologna). Study number IRST B041 protocol number 5482/v.1 intern code: L3P1192. Study number Bologna 098/2014/U/Oss. All patients provided written informed consent.
2.1 Statistical analysis
This analysis aimed to examine the association between baseline PNI index and Overall Survival (OS) in patients with HCC treated with sorafenib.
Information on neutrophil and albumin from hematologic blood tests carried out at baseline (the day before the start of treatment) was collected.
The PNI was calculated as follows: 10 × serum albumin concentration (g/dL) + 0.005 × peripheral lymphocyte count (number/mm2) [34]. The cut-off point of the PNI was determined to be 31.3 by ROC analysis.
Categorical variables were compared with Fisher’s exact test.
OS was defined as the time interval from the first day of treatment to the day of death or last follow-up visit. OS was estimated by the Kaplan-Meier method and curves were compared by the log-rank test. Unadjusted and adjusted hazard ratios (HRs) by baseline characteristics (AST, Age, and Sex) were calculated using the Cox proportional hazards model. The discrimination ability of the final model was assessed with Harrell’s concordance index (C-index).
MedCalc package (MedCalc® version 16.8.4) was used for statistical analysis.
3. Results
Among the 194 Sorafenib-treated HCC patients of the training group, 168 (86.6%) were males and 26 (13.4%) were females, with a median age of 70 years (range 25–87). Seventy-nine patients (40.7%) had an ECOG 0. The underlying etiology of liver disease was hepatitis B virus (HBV) in 45 patients (25.2%), hepatitis C virus (HCV) in 107 patients (55.1%), alcohol in 8 patients (4.1%), metabolic syndrome in 16 patients (8.2%), others in 18 patients (9.3%). The Child-Pugh Class was A in 157 patients (80.9%) and B in 30 patients (15.6%). Other baseline clinicopathologic and laboratory characteristics are summarized in Table 1.
Table 1. Baseline characteristics of the training cohort.
| Parameters | N (%) |
|---|---|
| Age, years (median, range) | 70 (25–87) |
| Gender | |
| Female | 26 (13.4%) |
| Male | 168 (86.6%) |
| ECOG PS | |
| 0–1 | 87 (44.8%) |
| ≥2 | 79 (40.7%) |
| Unknown | 28 (14.5%) |
| Etiology | |
| HCV | 107 (55.2%) |
| HBV | 45 (23.2%) |
| Metabolic syndrome | 16 (8.3%) |
| Alcohol | 8 (4.1%) |
| Others | 18 (9.2%) |
| Child-Pugh | |
| A | 157 (80.9%) |
| B | 30 (15.5%) |
| Unknown | 7 (3.6%) |
| BCLC Stage | |
| B | 39 (20.1%) |
| C | 127 (65.4%) |
| Unknown | 28 (14.5%) |
| “Local” Treatment | |
| Liver transplantation | 4 (2.0%) |
| Radiofrequency | 29 (14.9%) |
| TACE | 73 (37.6%) |
| PNI | |
| Low-group (<31.3) | 20 (10.3%) |
| High-group (≥31.3) | 174 (89.7%) |
| ALBI grade | |
| 0 | 0 |
| 1 | 188 (98.0) |
| 2 | 4 (2.0) |
| Laboratory tests (median, range) | |
| Neutrophils, cells/μl | 3540 (290–11490) |
| Lymphocytes, cells/μl | 1300 (210–3560) |
| Platelets, cells/μl | 137 (44–462) |
| Albumin, gr/dl | 3.6 (2.6–5.0) |
| Alkaline Phosphatase, IU/L | 144.5 (69–698) |
| G-GT, IU/L | 162 (45–1102) |
| AST, IU/L | 56 (13–177) |
| ALT, IU/L | 46 (10–218) |
| Bilirubin, gr/dl | 0.91 (0.3–3.86) |
| AFP, ng/ml | 23 (0.8–50000) |
Abbreviations. ECOG PS, eastern cooperative oncology group performance status; HCV, hepatitis C virus; HBV, hepatitis B virus; BCLC stage, Barcelona clinic liver center staging; Child-Pugh, Child-Turcotte-Pugh score; TACE, transarterial chemoembolization; PNI, prognostic nutritional index; G-GT, gamma-glutamyl transpeptidase; ALT, alanine aminotransaminase; AST, aspartate aminotransaminase; AFP, alpha-fetoprotein.
A total of 20 (10.3%) patients was categorized as the PNI-low group, while the remaining 174 (89.7%) patients as the PNI-high group.
Eighty-one (41.7%) patients had early AE, while 57 (29.4%) patients had late AE. The most frequent drug-related AEs were dermatologic toxicity and diarrhea.
The median progression-free survival (mPFS) was 3,8 months (95% CI, 3.1–6.4) and the median overall survival (mOS) was 12.4 (95% CI, 11.3–24.6).
3.1 Prognostic value of the PNI in the training cohort
At the univariate analysis for OS high PNI was associated with longer mOS (14.8 vs 6.8 months, HR 5.26; 95% CI,2.49–11.10; p<0.0001) (Fig 1). In addition, normal level of AST (<1 ULN) was correlated with better prognosis (HR 0.45; 95% CI, 0.30–0.68; p = 0.0002). No other correlations were found, particularly neither ALBI grade nor Child-Pugh status nor BCLC class were associated with prognosis, maybe due to the small number of patients in the worst classes. Nevertheless, we observed a trend towards a worse prognosis for these patients (ALBI grade: HR 2.47; 95% CI: 0.41–14.8; p = 0.1085; Child-Pugh status: HR 1.45; 95% CI: 0.90–2.32; p = 0.1312; BCLC class: HR 1,37; 95% CI: 0.92–2.03; p = 0.1132).
Fig 1. OS according to PNI (high- vs low-group) in the training cohort.
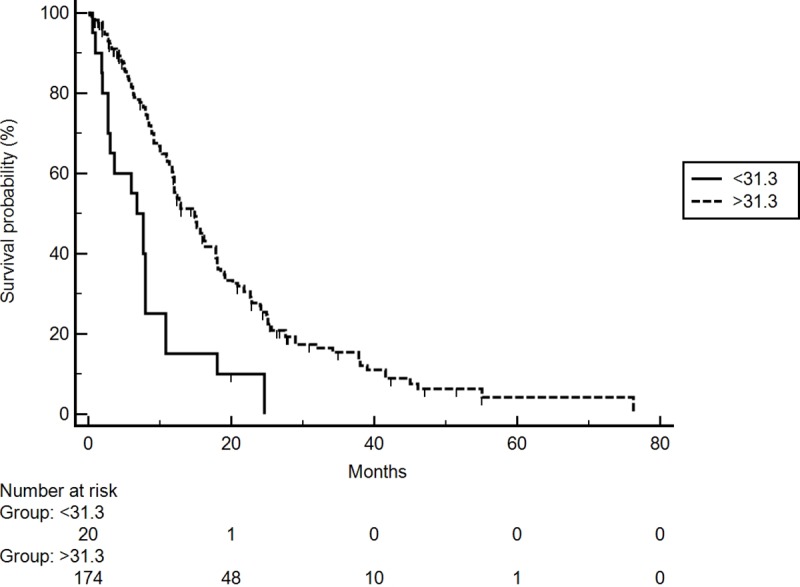
Following adjustment for clinical covariates positive in univariate analysis, multivariate analysis confirmed PNI-low (HR 2.98; 95% CI: 1.63–5.47; p = 0.0004), a normal level of AST (HR 0.33; 95% CI: 0.2–0.5; p = 0.0001), and age >70 years (HR 0.54; 95% CI: 0.36–0.82; p<0.0038) as independent prognostic factors for OS (Table 2).
Table 2. Univariate and multivariate analysis in the training cohort.
| Covariate | Univariate analysis | Multivariate analysis | ||||
|---|---|---|---|---|---|---|
| HR | 95%CI | p-value | HR | 95%CI | p-value | |
| Sex (female vs male) | 1.29 | 0.77–2.16 | 0.3164 | - | - | - |
| Age (>70 vs <70) | 0.98 | 0.71–1.35 | 0,9295 | 0.54 | 0.36–0.82 | 0,0038 |
| ECOG PS (>0 vs 0) | 1.34 | 0.95–1.91 | 0.0985 | |||
| ALBI grade (2 vs 1) | 2.47 | 0.41–14.8 | 0.1085 | |||
| Etiology | - | - | - | |||
| HCV | 1.00 | |||||
| HBV | 1.04 | 0.71–1.51 | ||||
| NASH | 0.93 | 0.53–1.63 | ||||
| Alcool | 0.86 | 0.40–1.83 | ||||
| Others | 1.41 | 0.75–2.65 | 0.7398 | |||
| PNI (<31.3 vs >31.3) | 0,19 | 0,09–0,4 | <0.0001 | 2.98 | 1.63–5.47 | 0,0004 |
| AST (>NV vs NV) | 2.21 | 1.46–3.35 | 0.0002 | 0.33 | 0.20–0.57 | 0,0001 |
| NLR (>3 vs <3) | 1,03 | 0.73–1,44 | 0.8629 | - | - | - |
| BCLC (C vs B) | 1.37 | 0.92–2.03 | 0,1132 | - | - | - |
| Bilirubin (>NV vs NV) | 1,29 | 0,88–1,90 | 0,1873 | |||
| ALT (>NV vs NV) | 1.22 | 0,84–1,87 | 0,2955 | |||
| Child-Pugh (B vs A) | 1.45 | 0.90–2.32 | 0,1213 | |||
| AFP (>400 vs <400) | 1.27 | 0,87–1,87 | 0,2084 | |||
| Reason for sorafenib discontinuation | ||||||
|
Tumor progression vs. AE Clinical decompensation Clinical decompensation |
1.27 | 0.91–1.45 | 0.163 | |||
Abbreviations. PNI, prognostic nutritional index; AST, aspartate aminotransaminase; NV, normal value; NLR, neutrophil-to-lymphocyte ratio; BCLC stage, Barcelona clinic liver center staging; ECOG PS, eastern cooperative oncology group performance status; ALT, alanine aminotransaminase; Child-Pugh, Child-Turcotte-Pugh score; AFP, alpha-fetoprotein; AE, adverse event.
Patients with a low PNI index showed a higher percentage of progression disease (PD) at the first CT re-evaluation respect to patients with a high PNI index (40% vs. 15% respectively, p = 0.04).
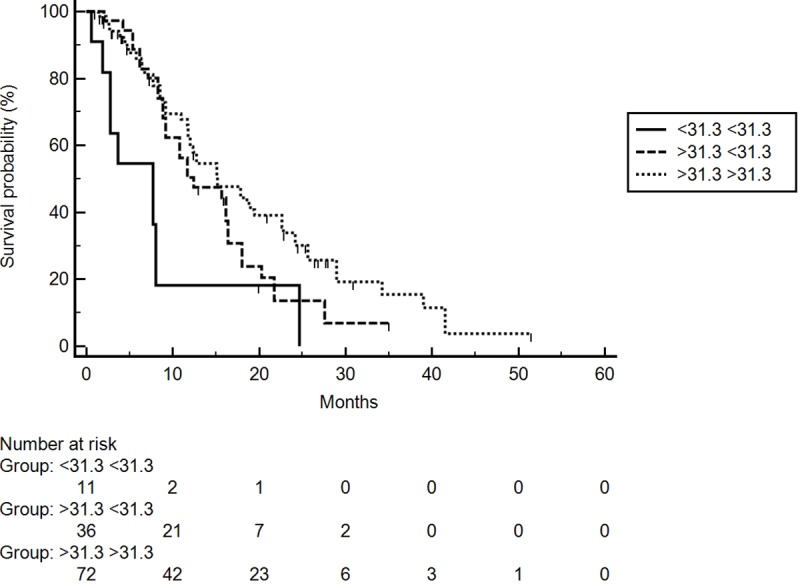
Next, we evaluated PNI index modifications during the early course of treatment. We estimated OS after stratifying patients into 3 groups according to PNI levels at baseline and after one month. The first group included patients with low (<31.3)-low (<31.3) levels of PNI index (11 patients), the second included those with high (>31.3)-low (<31.3) PNI index (36 patients) and the third included those with high (>31.3)-high (>31.3) PNI index (72 patients). No patients were classified as PNI low (<31,3)-PNI high (>31,3). Patients in the first group had a median OS of 7.7 months compared to 12.4 months for those in the second group and 15.1 months for those in the third group (p = 0.0029) (Fig 2).
Fig 2. OS according to PNI value changes after a month of treatment with Sorafenib in the training cohort.
3.2 Validation cohorts
A total of three external validation cohorts were considered for the analysis. 129 patients diagnosed with HCC were taken from the Bologna center database and made up the first validation cohort. Baseline clinical and laboratory characteristics are summarized in Table 3. Globally, 104 (80.6%) patients were categorized as the PNI-high group, while the remaining 25 (19.4%) patients as the PNI-low group. Maintaining the same observations of the training cohort, patients with PNI-low had a mOS of 4.0 months, whereas patients with a PNI-high had a mOS of 10.9 months (HR 0.03; 95% CI 0.01–0.08, p<0.0001). By performing the same multivariate analysis of the training cohort, PNI-low was found to be an independent prognostic factor for OS (HR 6.53; 95% CI 3.79–11.25, p<0.0001) (Fig 3A). The model had a C-index of 0.78.
Table 3. Baseline characteristics of the first, second- and third-validation cohort.
| Parameters | N (%) | ||
|---|---|---|---|
| First validation cohort | Second validation cohort | Third validation cohort | |
| Age, years (median, range) | 67 (37–85) | 67 (24–84) | 66.8 (24–85) |
| Gender | |||
| Female | 17 (13.2%) | 12 (15.8%) | 52 (19.6%) |
| Male | 112 (86.8%) | 64 (84.2%) | 213 (80.4%) |
| ECOG PS | |||
| 0–1 | 94 (72.8%) | 75 (98.7%) | 253 (94.5%) |
| ≥2 | 35 (27.2%) | 1 (1.3%) | 11 (4.1%) |
| Unknown | 0 (0%) | 0 (0%) | 1 (0.4%) |
| Etiology | |||
| HCV | 68 (52.7%) | 26 (34.2%) | 104 (39.2%) |
| HBV | 20 (15.5%) | 8 (10.5%) | 34 (12.8%) |
| Metabolic syndrome | 41 (31.8%) | 6 (7.9%) | 17 (6.4%) |
| Alcol | 0 (0%) | 6 (7.9%) | 37 (13.9%) |
| Other | 0 (0%) | 30 (39.5%) | 73 (27.7%) |
| Child-Pugh | |||
| A | 121 (93.8%) | 65 (85.5%) | 238 (89.8) |
| B | 8 (6.2%) | 11 (14.5%) | 27 (10.2) |
| BCLC Stage | |||
| B | 27 (21.0%) | 20 (26.3%) | 53 (20.0%) |
| C | 102 (79.0%) | 56 (73.7%) | 212 (80.0%) |
| “Local” Treatment | |||
| Liver transplantation | 45 (34.8%) | NA | NA |
| Radiofrequency | 23 (17.8%) | NA | NA |
| TACE | 66 (51.1%) | NA | NA |
| PNI | |||
| Low-group (<31.3) | 25 (19.4%) | 15 (19.7%) | 34 (12.8%) |
| High-group (≥31.3) | 104 (80.6%) | 61 (80.3%) | 231 (87.2%) |
| Laboratory tests (median, range) | |||
| Neutrophils, cells/μl | 3590 (750–10200) | 4100 (730–600000) | 4180 (1100–12740) |
| Lymphocytes, cells/μl | 1130 (250–4800) | 1505 (590–6850) | 1300 (102–4250) |
| Platelets, cells/μl | 138 (26–400) | NA | 123 (13–483) |
| Albumin, gr/dl | 3.6 (2.7–5.0) | NA | 3.7 (2.6–5.3) |
| Alkaline Phosphatase, IU/L | 191 (44–1231) | NA | NA |
| G-GT, IU/L | 108 (17–1043) | NA | NA |
| AST, IU/L | 53 (9–334) | 57 (13–238) | 51 (19–300) |
| ALT, IU/L | 41 (5–300) | 43 (6–348) | NA |
| Bilirubin, gr/dl | 0.94 (0.2–3.04) | 0.81 (0.21–3.15) | NA |
| AFP, ng/ml | 30 (1.0–60500) | 44.1 (0.8->50000) | 72.7 (1.1–457300) |
Abbreviations. ECOG PS, eastern cooperative oncology group performance status; HCV, hepatitis C virus; HBV, hepatitis B virus; BCLC stage, Barcelona clinic liver center staging; Child-Pugh, Child-Turcotte-Pugh score; TACE, transarterial chemoembolization; NA, not available; PNI, prognostic nutritional index; G-GT, gamma-glutamyl transpeptidase; ALT, alanine aminotransaminase; AST, aspartate aminotransaminase; AFP, alpha-fetoprotein;
Fig 3.

OS according to PNI in the first validation cohort (A); second validation cohort (B) and third validation cohort (C).
The participants in a second validation cohort were 76 patients collected in the Innovate STUDY database [42]. Baseline clinical and laboratory characteristics are summarized in Table 3.
Globally, 61 (80.3%) patients were categorized as the PNI-high group, while the remaining 15 (19.7%) patients as the PNI-low group. Patients with PNI-low had a mOS of 3.9 months, whereas patients with a PNI-high had a mOS of 12.4 months (HR 0.1, 95% CI 0.04–0.31, p<0.0001) (Fig 3B). By performing the same multivariate analysis of the training cohort, PNI-low was found to be an independent prognostic factor for OS (HR 2.98, 95% CI 1.25–7.08; p = 0.0135). The model had a C-index of 0.73.
The participants in a third validation cohort were 265 patients taken from Palermo and Padua centers. Baseline clinical and laboratory characteristics are summarized in Table 3.
Overall, 231 (87.2%) patients were categorized as the PNI-high group, while the remaining 34 (12.8%) patients as the PNI-low group. Patients with PNI-low had a mOS of 7.1 months, whereas patients with a PNI-high had a mOS of 13.3 months (HR 0.47, 95% CI 0.28–0.78, p = 0.0037). By performing the same multivariate analysis of the training cohort, PNI-low was found to be an independent prognostic factor for OS (HR 1.94, 95% CI 1.22–4.58; p = 0.001) (Fig 3C). The model had a C-index of 0.77.
Multivariate analyses of the three validation cohorts are summarized in Table 4.
Table 4. Multivariate analysis in the first, second and third validation cohort.
| Covariate | Multivariate analysis | ||||||||
|---|---|---|---|---|---|---|---|---|---|
| First validation cohort | Second validation cohort | Third validation cohort | |||||||
| HR | 95%CI | p-value | HR | 95%CI | p-value | HR | 95%CI | p-value | |
| PNI <31.3 | 6.53 | 3.79–11.25 | <0.0001 | 2.98 | 1.25–7.08 | 0.0135 | 1.94 | 1.22–4.58 | 0.0012 |
| AST | 0.81 | 0.54–1.22 | 0.3326 | 0.91 | 0.44–1.89 | 0.8099 | 1.00 | 0.99–1.01 | 0.2494 |
| Age | 0.77 | 0.51–1.16 | 0.2189 | 1.43 | 0.73–2.80 | 0.2873 | 0.55 | 0.25–1.22 | 0.1435 |
| Sex | 1.13 | 0.63–2.03 | 0.6774 | 2.39 | 0.98–5.78 | 0.0529 | 0.77 | 0.33–1.80 | 0.5529 |
Abbreviations. PNI, prognostic nutritional index; AST, aspartate aminotransaminase.
4. Discussion
In this large retrospective study totalling a number of 660 patients, including three independent validation cohorts of subjects, we demonstrated that the PNI is an independent predictor of survival.
PNI index is composed of only two parameters. This simplification of the index makes it more available and simpler for daily clinical practice respect others index evaluated by our and others groups [5,8,35–38].
The results of our analysis are in line with previous studies evaluating the prognostic role of this index. Particularly, Chan et al reported that the PNI predicts tumor recurrence in early-stage HCC after surgical resection [39]; it is also associated with survival of HCC patients after loco-regional or systemic therapy, as reported by Pinato et al [40]. Furthermore, a meta-analysis of eleven studies also proved that a low PNI is a poor prognostic factor for OS and disease-free survival (DFS) in HCC, whereas a high PNI is a favourable prognostic factor and is associated with better clinical predictors, such as lower AFP, lower recurrence rates, smaller tumor size, and earlier TNM tumor stage [41].
In the Japanese experience of Hatanaka et al [42], the PNI was a significant factor associated with the duration of Sorafenib therapy and the OS among pre-treatment factors in a cohort of patients treated with Sorafenib. No significant differences in terms of Sorafenib efficacy and serious adverse events rate were found between high- and low-PNI groups.
In keeping with the Japanese results, we showed the prognostic role of the PNI in a European population and we validated these results in three independent cohorts of patients with HCC treated with Sorafenib.
Several mechanisms could be put forward to explain how the PNI influences the survival of HCC patients, including those receiving sorafenib. First of all, the PNI, a combination of serum albumin and total lymphocyte count, reflects the link existing between immunity, inflammation, and nutrition in cancer, with their consequent potential prognostic implications. A low PNI may be caused by hypoalbuminemia and/or lymphocytopenia. In connection with the role of lymphocytopenia, it is well-known that T lymphocytes play an essential role in the immune and anti-cancer response and also in the biological behavior of HCC, such as initiation, proliferation, differentiation, and metastasis [43,44]. In previous studies on HCC, it has been reported that the presence of more abundant tumor-infiltrating effector T lymphocytes (TILs) is associated with better outcomes after surgical resection [45] while a reduced number appeared related to higher tumor recurrence rates after liver transplantation [46]. Similar results were observed also in advanced HCC, where the count of CD8+T cells in TILs was lower in patients with metastatic disease than in those without [47] and the ability of specific subsets of T cells in HCC was claimed to be able to predict extrahepatic metastasis and prognosis [48,49].
In connection with the role of hypoalbuminemia, albumin is a known prognostic factor in HCC, specifically included in staging systems like the Cancer of the Liver Italian Program (CLIP) score [50] or the ALBI grade [51] and in many other staging systems.
In this setting, albuminemia may be specifically influenced by three factors: 1) the liver dysfunction, usually related to the common underlying cirrhotic condition; 2) the nutritional status, including cancer cachexia; 3) the cancer-related inflammation. Furthermore, lower albumin levels were shown to be associated with increased risks of developing portal vein thrombosis in cirrhosis [52]. Whether similar effects may take place at a microvascular level leading to accelerated liver dysfunction remains a purely speculative hypothesis [53].
Interestingly, we were able to test and confirm in our training cohort not only that PNI level contributes to predicting survival when tested at baseline, but also when patients were subdivided into three groups according to the changes of PNI value over the first month of Sorafenib treatment, with the best OS observed in patients who could maintain high PNI levels in the first month of treatment.
Limitations of the present study was its retrospective nature and for this reason we didn’t collected all clinical variables and the cohorts of the study were unbalance for clinical variables. Other limitations of the study was the absence of a predefined standard cut-off value of the PNI. However, the cut-off obtained in our training group was validated in all the three external series, but it could strongly be validated by a prospective study. Another important limitation of our study is the absence of a control arm not receiving sorafenib, making not possible to evaluate the predictive role of the index.
In conclusion, we proposed the PNI as an easy-to-use prognostic factor in patients with HCC treated with Sorafenib, including nutritional status, inflammation, and immunity in a single marker. It is also readily available and low-cost, and for these reasons, it could be implemented in clinical practice and useful in trial design in patients with HCC.
Supporting information
(XLSX)
List of Abbreviations
- HCC
Hepatocellular carcinoma
- BCLC
Barcelona Clinic Liver Cancer
- BMI
Body Mass Index
- MVI
macroscopic vascular invasion
- ALBI
Albumin-Bilirubin
- AFP
Alpha-fetoprotein
- LDH
Lactate Dehydrogenase
- NLR
neutrophil-to-lymphocyte ratio
- SII
immune-inflammation index
- AE
adverse events
- PNI
prognostic nutritional index
- ECOG
Eastern Cooperative Oncology Group
- ALT
alanine aminotransferase
- AST
aspartate aminotransferase
- mRECIST
modified Response Evaluation Criteria in Solid Tumors
- OS
Overall Survival
- HBV
hepatitis B virus
- HCV
hepatitis C virus
- mPFS
median progression-free survival
- PD
progression disease
- HRs
Hazard ratios
- DFS
disease-free survival
- CLIP
Cancer of the Liver Italian Program
- TACE
transarterial chemoembolization
- G-GT
gamma-glutamyl transpeptidase
Data Availability
All relevant data are within the paper and its Supporting Information files.
Funding Statement
The author(s) received no specific funding for this work.
References
- 1.Petrick JL, Braunlin M, Laversanne M, Valery PC, Bray F, McGlynn KA. International trends in liver cancer incidence, overall and by histologic subtype, 1978–2007. Int J Cancer. 2016;139(7):1534–1545. 10.1002/ijc.30211 [DOI] [PMC free article] [PubMed] [Google Scholar]
- 2.Global Burden of Disease Liver Cancer Collaboration, Akinyemiju T, Abera S, Ahmed M, Alam N, Alemayohu MA, et al. The Burden of Primary Liver Cancer and Underlying Etiologies From 1990 to 2015 at the Global, Regional, and National Level: Results From the Global Burden of Disease Study 2015. JAMA Oncol 2017;3(12):1683–91. 10.1001/jamaoncol.2017.3055 [DOI] [PMC free article] [PubMed] [Google Scholar]
- 3.Llovet JM, Ricci S, Mazzaferro V, Hilgard P, Gane E, Blanc JF, et al. Sorafenib in advanced hepatocellular carcinoma. N Engl J Med 2008;359(4):378–90. 10.1056/NEJMoa0708857 [DOI] [PubMed] [Google Scholar]
- 4.Cheng AL, Kang YK, Chen Z, Tsao CJ, Qin S, Kim JS, et al. Efficacy and safety of sorafenib in patients in the Asia-Pacific region with advanced hepatocellular carcinoma: a phase III randomised, double-blind, placebo-controlled trial. Lancet Oncol 2009;10(1):25–34. 10.1016/S1470-2045(08)70285-7 [DOI] [PubMed] [Google Scholar]
- 5.Bruix J, Cheng AL, Meinhardt G, Nakajima K, De Sanctis Y, Llovet J. Prognostic factors and predictors of sorafenib benefit in patients with hepatocellular carcinoma: analysis of two phase III studies. J Hepatol 2017;67(5):999–1008. 10.1016/j.jhep.2017.06.026 [DOI] [PubMed] [Google Scholar]
- 6.Casadei-Gardini A, Frassineti GL, Foschi FG, Ercolani G, Ulivi P. Sorafenib and Regorafenib in HBV- or HCV-positive hepatocellular carcinoma patients: Analysis of RESORCE and SHARP trials. Dig Liver Dis 2017;49(8):943–44. 10.1016/j.dld.2017.04.022 [DOI] [PubMed] [Google Scholar]
- 7.Cabibbo G, Cucchetti A, Cammà C, Casadei-Gardini A, Celsa C, Rizzo GEM, et al. Outcomes of hepatocellular carcinoma patients treated with sorafenib: a meta-analysis of Phase III trials. Future Oncol 2019;15(29):3411–22. 10.2217/fon-2019-0287 [DOI] [PubMed] [Google Scholar]
- 8.Hollebecque A, Cattan S, Romano O, Sergent G, Mourad A, Louvet A, et al. Safety and efficacy of sorafenib in hepatocellular carcinoma: the impact of the Child-Pugh score. Aliment Pharmacol Ther 2011;34(10):1193–201. 10.1111/j.1365-2036.2011.04860.x [DOI] [PubMed] [Google Scholar]
- 9.Casadei-Gardini A, Faloppi L, De Matteis S, Foschi FG, Silvestris N, Tovoli F, et al. Metformin and insulin impact on clinical outcome in patients with advanced hepatocellular carcinoma receiving sorafenib: Validation study and biological rationale. Eur J Cancer 2017;86:106–14. 10.1016/j.ejca.2017.09.003 [DOI] [PubMed] [Google Scholar]
- 10.De Matteis S, Scarpi E, Granato AM, Vespasiani-Gentilucci U, La Barba G, Foschi FG, et al. Role of SIRT-3, p-mTOR and HIF-1α in Hepatocellular Carcinoma Patients Affected by Metabolic Dysfunctions and in Chronic Treatment with Metformin. Int J Mol Sci 2019;20(6):1503. [DOI] [PMC free article] [PubMed] [Google Scholar]
- 11.Mir O, Coriat R, Blanchet B, Durand JP, Boudou-Rouquette P, Michels J, et al. Sarcopenia predicts early dose-limiting toxicities and pharmacokinetics of sorafenib in patients with hepatocellular carcinoma. PloS One 2012;7(5):e37563 10.1371/journal.pone.0037563 [DOI] [PMC free article] [PubMed] [Google Scholar]
- 12.Pinter M, Sieghart W, Hucke F, Graziadei I, Vogel W, Maieron A, et al. Prognostic factors in patients with advanced hepatocellular carcinoma treated with sorafenib. Aliment Pharmacol Ther 2011;34(8):949–59. 10.1111/j.1365-2036.2011.04823.x [DOI] [PubMed] [Google Scholar]
- 13.Rovesti G, Orsi G, Kalliopi A, Vivaldi C, Marisi G, Faloppi L, et al. Impact of Baseline Characteristics on the Overall Survival of HCC Patients Treated with Sorafenib: Ten Years of Experience. Gastrointest Tumors 2019;6(3–4):92–107. 10.1159/000502714 [DOI] [PMC free article] [PubMed] [Google Scholar]
- 14.Yau T, Yao TJ, Chan P, Wong H, Pang R, Fan ST, et al. The significance of early alpha-fetoprotein level changes in predicting clinical and survival benefits in advanced hepatocellular carcinoma patients receiving sorafenib. Oncologist 2011;16(9):1270–79. 10.1634/theoncologist.2011-0105 [DOI] [PMC free article] [PubMed] [Google Scholar]
- 15.Faloppi L, Bianconi M, Memeo R, Casadei-Gardini A, Giampieri R, Bittoni A, et al. Lactate Dehydrogenase in Hepatocellular Carcinoma: Something Old, Something New. Biomed Res Int 2016;2016:7196280 10.1155/2016/7196280 [DOI] [PMC free article] [PubMed] [Google Scholar]
- 16.Lué A, Serrano MT, Bustamante FJ, Iñarrairaegui M, Arenas JI, Testillano M, et al. Neutrophil-to-lymphocyte ratio predicts survival in European patients with hepatocellular carcinoma administered sorafenib. Oncotarget 2017;8(61):103077–103086. 10.18632/oncotarget.21528 [DOI] [PMC free article] [PubMed] [Google Scholar]
- 17.Casadei-Gardini A, Scarpi E, Faloppi L, Scartozzi M, Silvestris N, Santini D, et al. Immune inflammation indicators and implication for immune modulation strategies in advanced hepatocellular carcinoma patients receiving sorafenib. Oncotarget 2016;7(41):67142–67149. 10.18632/oncotarget.11565 [DOI] [PMC free article] [PubMed] [Google Scholar]
- 18.Casadei-Gardini A, Scarpi E, Marisi G, Foschi FG, Donati G, Giampalma E, et al. Early onset of hypertension and serum electrolyte changes as potential predictive factors of activity in advanced HCC patients treated with sorafenib: results from a retrospective analysis of the HCC-AVR group. Oncotarget 2016;7(12):15243–51. 10.18632/oncotarget.7444 [DOI] [PMC free article] [PubMed] [Google Scholar]
- 19.Otsuka T, Eguchi Y, Kawazoe S, Yanagita K, Ario K, Kitahara K, et al. Skin toxicities and survival in advanced hepatocellular carcinoma patients treated with sorafenib. Hepatol Res 2012;42(9):879–86. 10.1111/j.1872-034X.2012.00991.x [DOI] [PubMed] [Google Scholar]
- 20.Reig M, Rimola J, Torres F, Darnell A, Rodriguez-Lope C, Forner A, et al. Postprogression survival of patients with advanced hepatocellular carcinoma: rationale for second-line trial design. Hepatology 2013;58(6):2023–31. 10.1002/hep.26586 [DOI] [PubMed] [Google Scholar]
- 21.Iavarone M, Cabibbo G, Biolato M, Della Corte C, Maida M, Barbara M, et al. Predictors of survival in patients with advanced hepatocellular carcinoma who permanently discontinued sorafenib. Hepatology 2015;62(3):784–91. 10.1002/hep.27729 [DOI] [PubMed] [Google Scholar]
- 22.Llovet JM, Peña CE, Lathia CD, Shan M, Meinhardt G, Bruix J; SHARP Investigators Study Group. Plasma biomarkers as predictors of outcome in patients with advanced hepatocellular carcinoma. Clin Cancer Res 2012;18(8):2290–300. 10.1158/1078-0432.CCR-11-2175 [DOI] [PMC free article] [PubMed] [Google Scholar]
- 23.Scartozzi M, Faloppi L, Svegliati Baroni G, Loretelli C, Piscaglia F, Iavarone M, et al. VEGF and VEGFR genotyping in the prediction of clinical outcome for HCC patients receiving sorafenib: the ALICE-1 study. Int J Cancer 2014;135(5):1247–56. 10.1002/ijc.28772 [DOI] [PubMed] [Google Scholar]
- 24.Casadei-Gardini A, Marisi G, Faloppi L, Scarpi E, Foschi FG, Iavarone M, et al. eNOS polymorphisms and clinical outcome in advanced HCC patients receiving sorafenib: final results of the ePHAS study. Oncotarget 2016;7(19):27988–99. 10.18632/oncotarget.8569 [DOI] [PMC free article] [PubMed] [Google Scholar]
- 25.Faloppi L, Casadei-Gardini A, Masi G, Silvestris N, Loretelli C, Ulivi P, et al. Angiogenesis polymorphisms profile in the prediction of clinical outcome of advanced HCC patients receiving sorafenib: Combined analysis of VEGF and HIF-1α. Final results of the ALICE-2 study. J Clin Oncol 2016;34,Suppl 4,280.26552421 [Google Scholar]
- 26.Marisi G, Petracci E, Raimondi F, Faloppi L, Foschi FG, Lauletta G, et al. ANGPT2 and NOS3 Polymorphisms and Clinical Outcome in Advanced Hepatocellular Carcinoma Patients Receiving Sorafenib. Cancers (Basel) 2019;11(7):1023. [DOI] [PMC free article] [PubMed] [Google Scholar]
- 27.Fornari F, Pollutri D, Patrizi C, La Bella T, Marinelli S, Casadei-Gardini A, et al. In Hepatocellular Carcinoma miR-221 Modulates Sorafenib Resistance through Inhibition of Caspase-3-Mediated Apoptosis. Clin Cancer Res 2017;23(14):3953–3965. 10.1158/1078-0432.CCR-16-1464 [DOI] [PubMed] [Google Scholar]
- 28.Hagiwara S, Kudo M, Nagai T, Inoue T, Ueshima K, Nishida N, et al. Activation of JNK and high expression level of CD133 predict a poor response to sorafenib in hepatocellular carcinoma. Br J Cancer 2012;106(12):1997–2003. 10.1038/bjc.2012.145 [DOI] [PMC free article] [PubMed] [Google Scholar]
- 29.Casadei-Gardini A, Orsi G, Caputo F, Ercolani G. Developments in predictive biomarkers for hepatocellular carcinoma therapy. Expert Rev Anticancer Ther 2020;20(1):63–74. 10.1080/14737140.2020.1712198 [DOI] [PubMed] [Google Scholar]
- 30.Marisi G, Cucchetti A, Ulivi P, Canale M, Cabibbo G, Solaini L, et al. Ten years of sorafenib in hepatocellular carcinoma: Are there any predictive and/or prognostic markers? World J Gastroenterol 2018;24(36):4152–4163. 10.3748/wjg.v24.i36.4152 [DOI] [PMC free article] [PubMed] [Google Scholar]
- 31.Onodera T, Goseki N, Kosaki G. Prognostic nutritional index in gastrointestinal surgery of malnourished cancer patients. Nihon Geka Gakkai Zasshi 1984;85(9):1001–5. [PubMed] [Google Scholar]
- 32.Fearon KC, Voss AC, Hustead DS; Cancer Cachexia Study Group. Definition of cancer cachexia: effect of weight loss, reduced food intake, and systemic inflammation on functional status and prognosis. Am J Clin Nutr 2006;83(6):1345–50. 10.1093/ajcn/83.6.1345 [DOI] [PubMed] [Google Scholar]
- 33.Nozoe T, Ninomiya M, Maeda T, Matsukuma A, Nakashima H, Ezaki T. Prognostic nutritional index: a tool to predict the biological aggressiveness of gastric carcinoma. Surg Today 2010;40(5):440–3. 10.1007/s00595-009-4065-y [DOI] [PubMed] [Google Scholar]
- 34.Salati M, Filippi R, Vivaldi C, Caputo F, Leone F, Salani F, et al. The prognostic nutritional index predicts survival and response to first-line chemotherapy in advanced biliary cancer. Liver Int 2019. [DOI] [PubMed] [Google Scholar]
- 35.Diaz-Beveridge R, Bruixola G, Lorente D, et al. An internally validated new clinical and inflammation-based prognostic score for patients with advanced hepatocellular carcinoma treated with sorafenib. Clin Transl Oncol. 2018;20(3):322–329. 10.1007/s12094-017-1720-4 [DOI] [PubMed] [Google Scholar]
- 36.Labeur TA, van Vugt JLA, Ten Cate DWG, et al. Body Composition Is an Independent Predictor of Outcome in Patients with Hepatocellular Carcinoma Treated with Sorafenib. Liver Cancer. 2019;8(4):255–270. 10.1159/000493586 [DOI] [PMC free article] [PubMed] [Google Scholar]
- 37.Labeur TA, Berhane S, Edeline J, et al. Improved survival prediction and comparison of prognostic models for patients with hepatocellular carcinoma treated with sorafenib. Liver Int. 2020;40(1):215–228. 10.1111/liv.14270 [DOI] [PMC free article] [PubMed] [Google Scholar]
- 38.Berhane S, Fox R, García-Fiñana M, Cucchetti A, Johnson P. Using prognostic and predictive clinical features to make personalised survival prediction in advanced hepatocellular carcinoma patients undergoing sorafenib treatment. Br J Cancer. 2019;121(2):117–124. 10.1038/s41416-019-0488-4 [DOI] [PMC free article] [PubMed] [Google Scholar]
- 39.Chan AW, Chan SL, Wong GL, Wong VW, Chong CC, Lai PB, et al. Prognostic nutritional index (PNI) predicts tumor recurrence of very early/early stage hepatocellular carcinoma after surgical resection. Ann Surg Oncol 2015;22(13):4138–48. 10.1245/s10434-015-4516-1 [DOI] [PubMed] [Google Scholar]
- 40.Pinato DJ, North BV, Sharma R. A novel, externally validated inflammation-based prognostic algorithm in hepatocellular carcinoma: the prognostic nutritional index (PNI). Br J Cancer 2012;106(8):1439–45. 10.1038/bjc.2012.92 [DOI] [PMC free article] [PubMed] [Google Scholar]
- 41.Wang Z, Wang J, Wang P. The prognostic value of prognostic nutritional index in hepatocellular carcinoma patients: A meta-analysis of observational studies. PLoS One 2018;13:e0202987 10.1371/journal.pone.0202987 [DOI] [PMC free article] [PubMed] [Google Scholar] [Retracted]
- 42.Hatanaka T, Kakizaki S, Uehara D, Nagashima T, Ueno T, Namikawa M, et al. Impact of the Prognostic Nutritional Index on the Survival of Japanese Patients with Hepatocellular Carcinoma Treated with Sorafenib: A Multicentre Retrospective Study. Intern Med 2019;58(13):1835–1844. 10.2169/internalmedicine.1594-18 [DOI] [PMC free article] [PubMed] [Google Scholar]
- 43.Casadei-Gardini A, Faloppi L, Aprile G, Brunetti O, Caparello C, Corbelli J, et al. Multicenter prospective study of angiogenesis polymorphism validation in HCC patients treated with sorafenib. An INNOVATE study protocol. Tumori 2018;104(6):476–479. 10.5301/tj.5000704 [DOI] [PubMed] [Google Scholar]
- 44.Lencioni R, Llovet JM. Modified RECIST (mRECIST) assessment for hepatocellular carcinoma. Semin Liver Dis 2010;30(1):52–60. 10.1055/s-0030-1247132 [DOI] [PMC free article] [PubMed] [Google Scholar]
- 45.Unitt E, Marshall A, Gelson W, Rushbrook SM, Davies S, Vowler SL, et al. Tumour lymphocytic infiltrate and recurrence of hepatocellular carcinoma following liver transplantation. J Hepatol 2006;45(2):246–53. 10.1016/j.jhep.2005.12.027 [DOI] [PubMed] [Google Scholar]
- 46.Mano Y, Aishima S, Fujita N, Tanaka J, Kubo Y, Motomura T, et al. Tumor-associated macrophage promotes tumor progression via STAT3 signaling in hepatocellular carcinoma. Pathobiology 2013;80(3):146–54. 10.1159/000346196 [DOI] [PubMed] [Google Scholar]
- 47.Wada Y, Nakashima O, Kutami R, Yamamoto O, Kojiro M. Clinicopathological study on hepatocellular carcinoma with lymphocytic infiltration. Hepatol 1998;27(2):407–14. [DOI] [PubMed] [Google Scholar]
- 48.Guo CL, Yang HC, Yang XH, Cheng W, Dong TX, Zhu WJ, et al. Associations between infiltrating lymphocyte subsets and hepatocellular carcinoma. Asian Pac J Cancer Prev 2012;13(11):5909–13. 10.7314/apjcp.2012.13.11.5909 [DOI] [PubMed] [Google Scholar]
- 49.Gao Q, Zhou J, Wang XY, Qiu SJ, Song K, Huang XW, et al. Infiltrating memory/senescent T cell ratio predicts extrahepatic metastasis of hepatocellular carcinoma. Ann Surg Oncol 2012;19(2):455–66. 10.1245/s10434-011-1864-3 [DOI] [PubMed] [Google Scholar]
- 50.Budhu A, Forgues M, Ye QH, Jia HL, He P, Zanetti KA, et al. Prediction of venous metastases, recurrence, and prognosis in hepatocellular carcinoma based on a unique immune response signature of the liver microenvironment. Cancer Cell 2006;10(2):99–111. 10.1016/j.ccr.2006.06.016 [DOI] [PubMed] [Google Scholar]
- 51.The Cancer of the Liver Italian Program (CLIP) investigators. A new prognostic system for hepatocellular carcinoma: a retrospective study of 435 patients: the Cancer of the Liver Italian Program (CLIP) investigators. Hepatol 1998;28(3):751–5. [DOI] [PubMed] [Google Scholar]
- 52.Johnson PJ, Berhane S, Kagebayashi C, Satomura S, Teng M, Reeves HL, et al. Assessment of liver function in patients with hepatocellular carcinoma: a new evidence-based approach-the ALBI grade. J Clin Oncol 2015;33(6):550–8. 10.1200/JCO.2014.57.9151 [DOI] [PMC free article] [PubMed] [Google Scholar]
- 53.Basili S, Carnevale R, Nocella C et al. Serum Albumine Is Inversely Associated With Portal Vein Thrombosis in Cirrhosis. Hepatol Commun 2019; 3(4):504–512. 10.1002/hep4.1317 [DOI] [PMC free article] [PubMed] [Google Scholar]