Abstract
Phonons crucially impact a variety of properties of organic semiconductor materials. For instance, charge- and heat transport depend on low-frequency phonons, while for other properties, such as the free energy, especially high-frequency phonons count. For all these quantities one needs to know the entire phonon band structure, whose simulation becomes exceedingly expensive for more complex systems when using methods like dispersion-corrected density functional theory (DFT). Therefore, in the present contribution we evaluate the performance of more approximate methodologies, including density functional tight binding (DFTB) and a pool of force fields (FF) of varying complexity and sophistication. Beyond merely comparing phonon band structures, we also critically evaluate to what extent derived quantities, like temperature-dependent heat capacities, mean squared thermal displacements, and temperature-dependent free energies are impacted by shortcomings in the description of the phonon bands. As a benchmark system, we choose (deuterated) naphthalene, as the only organic semiconductor material for which to date experimental phonon band structures are available in the literature. Overall, the best performance among the approximate methodologies is observed for a system-specifically parametrized second-generation force field. Interestingly, in the low-frequency regime also force fields with a rather simplistic model for the bonding interactions (like the General Amber Force Field) perform rather well. As far as the tested DFTB parametrization is concerned, we obtain a significant underestimation of the unit-cell volume resulting in a pronounced overestimation of the phonon energies in the low-frequency region. This cannot be mended by relying on the DFT-calculated unit cell, since with this unit cell the DFTB phonon frequencies significantly underestimate the experiments.
1. Introduction
Over the past years, molecular crystals have been the subject of numerous studies aimed at a better understanding of their properties in order to improve their performance in organic-semiconductor-based devices. Many of these properties are crucially influenced by phonons. For example, a strong electron–phonon coupling is one of the main factors hampering charge transport in organic semiconductors.1−6 Phonons are also important for other dynamic processes, such as thermal transport7 or thermoelectricity.8,9 Furthermore, the phonon contribution to the free energy is often found to be crucial for correctly predicting the relative stability of different phases,10−12 especially when dealing with polymorphs that are very close in energy, as is often the case in molecular crystals.13,14 Consequently, a detailed knowledge of the phonon band structure is highly beneficial.
Unfortunately, for materials as complex as molecular crystals, it is difficult to reliably determine phonon bands both in experiments and in simulations: inelastic neutron scattering, which is typically used to measure phonon band structures, requires large single crystals, which are often difficult to grow. Moreover, these crystals ought to consist of deuterated molecules, as this results in higher coherent and lower incoherent scattering cross sections for neutrons.15−17 As a consequence, to the best of our knowledge, the only crystal consisting of π-conjugated molecules for which experimental phonon band structure data are available is deuterated naphthalene.18
Complex molecular crystals relevant in organic devices also pose a significant challenge for simulations. To date, the most common approach is to calculate phonon bands from the dynamical matrix of the system either by density-functional perturbation theory19,20 or by finite displacements in supercells. Since the current work aims at a quantitative comparison of different low-level theories, here the method of choice for calculating phonon band structures is the finite displacement approach in order to consistently apply the same methodology throughout all levels of theory. Within this approach, the dynamical matrix is derived from the forces on each atom in the unit cell which are caused by Cartesian displacements of all other atoms contained in rather large supercells. Such calculations are significantly more costly than, for example, the simulation of infrared (IR) or Raman spectra of the same molecular crystal, as there only Γ-point phonons are relevant. This is a consequence of the small momentum of the incident photons, which (due to momentum conservation) is not sufficient to excite vibrational modes with sizable q-vectors. For obtaining Γ-point phonons, simulations can be restricted to primitive unit cells.
For calculating Γ-point phonons, density functional theory (DFT)21,22 is typically the method of choice. Indeed, as shown recently for a variety of conjugated materials and their polymorphs,23 combining DFT with a suitably chosen van der Waals correction yields an excellent agreement with experimental Raman data even in the range between ∼5 and 100 cm–1. As indicated above, the situation becomes computationally more challenging, as soon as phonons in the entire first Brillouin zone (1BZ) need to be considered. This is, for example, the case for electron scattering processes, thermal transport, or the reliable prediction of the stability of different phases. Nevertheless, free energies are often calculated with Γ-phonons only,24,25 because the entire 1BZ is hardly accessible with ab initio methods like dispersion-corrected DFT. This can, however, lead to severe discrepancies in thermodynamic quantities as discussed in the Supporting Information.
A possible strategy for reducing the computational cost is to resort to lower levels of theory for describing interatomic and intermolecular interactions. This raises the questions, under which circumstances such approaches could be used, and how accurate the calculated phonon dispersion must be to obtain reliable phonon related properties (such as thermodynamic potentials, group velocities, thermal displacements, etc.). Addressing these questions is at the very heart of the present paper, where the phonon properties of (deuterated) naphthalene are analyzed at different levels of theory. The latter comprise dispersion corrected density functional theory, density functional tight binding (DFTB),26−29 and various flavors of classical force fields (FF).
The paper is organized as follows: after a brief description of the studied system, the importance of evaluating the performance of different methods separately in the low-frequency regime and for the entire spectral range is discussed. Subsequently, the reliability of the DFT data as a reference for the further analysis is shown. This is done by comparing the simulated DFT phonon band structure of deuterated naphthalene to the available experimental data.18 As part of this comparison, different a posteriori van der Waals (vdW) corrections within DFT are tested, extending a previous study by Brown-Altvater et al.30 DFTB- and FF-calculated phonon bands are, subsequently, compared to the aforementioned DFT reference results. Finally, as a key aspect of this manuscript, the impact of differences in the calculated band structures on various derived, practically relevant phonon properties is evaluated. The latter comprise thermal atomic motion (i.e., mean squared thermal displacements), heat capacities, group velocities, and vibrational free energies.
1.1. The Studied System
Due to the availability of suitable experimental data (see above), we will focus on crystalline (deuterated) naphthalene. The crystal consists of two molecules per unit cell with 18 atoms each. Therefore, the unit cell has 108 (=36 × 3) degrees of freedom (i.e., phonon bands): 12 of these are dominated by intermolecular (three rotational and three translational degrees of freedom per molecule), and 96 are dominated by intramolecular motions. The system crystallizes in a monoclinic Bravais lattice with space group P21/a. Two orthographic projections of the unit cell are shown in Figure 1. The naphthalene molecules arrange in a herringbone fashion in 2D layers, with the lattice vector b being much shorter than the remaining two lattice vectors (|a|=8.08 Å, |b|=5.93 Å, |c|=8.63 Å). This suggests anisotropic (phonon) properties.
Figure 1.
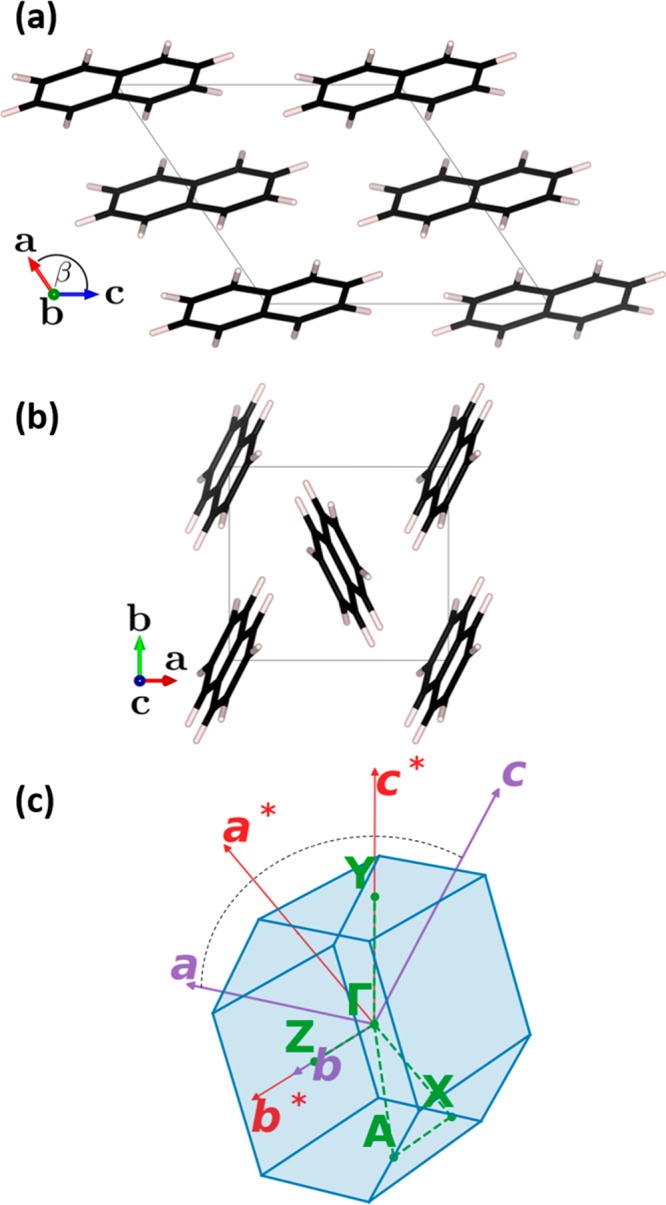
Unit cell of naphthalene seen (a) along lattice vector b and (b) along lattice vector c visualized with VESTA 3.31 Panel (c) shows the first Brillouin zone of the crystal, where the primitive real-space lattice vectors (a,b,c) and the primitive reciprocal lattice vectors (a*,b*,c*) are indicated by purple and red arrows, respectively. The vectors a, a*, c, and c* lie in one plane (indicated by the black dashed arc) perpendicular to b and b*. The path connecting high symmetry points used later in band diagrams is shown as green dashed lines.
Figure 1(c) shows the first Brillouin zone (1BZ) of the crystal and the high-symmetry points used in the band diagrams throughout this paper. Note that b and its reciprocal lattice vector b* are collinear, while all other real space and reciprocal lattice vectors (a, a*, c, and c*) lie in the same plane, which is perpendicular to b and b*. Thus, the ΓZ direction in the band structures corresponds to the direction along the shortest lattice vector, b.
Finally, it should be noted that with one exception, in the following discussion we will focus on ordinary, non-deuterated naphthalene crystals. This exception is the comparison of DFT-calculated phonon band structures with neutron scattering experiments. There, we will discuss simulations on a fully deuterated system (i.e., we changed the mass of the hydrogen atoms in the phonon calculations) in order to be consistent with the experimental situation.
2. Methodology
2.1. Density Functional Theory calculations
DFT calculations were carried out with the VASP code32−35 (version 5.4.1), using the PBE functional36 and employing the recommended standard potentials37 within the projector-augmented wave method.38 The occupation of electronic states was described with a Gaussian smearing of σ = 0.05 eV. For calculations of primitive unit cells, the electronic band structure was sampled with a Γ-centered 2 × 3 × 2 k-mesh, while for supercell calculations (2 × 3 × 2 super cells, see below) only electronic states at the Γ-point were considered. This choice is based on convergence tests for the Γ-point phonons when varying the sampling of the 1BZ in the electronic structure calculations (see the Supporting Information). A plane wave energy cutoff of 900 eV, a SCF energy convergence criterion of 10–8 eV, and the global precision Accurate were used (for details see the VASP manual39). These parameters ensure DFT reference calculations with a high accuracy. A more detailed description of how the specific settings impact the computational time and the accuracy of the results can be found in the Supporting Information. The atomic positions and the lattice parameters were optimized to residual forces below 0.5 meV/Å employing the conjugate gradient algorithm. The final lattice geometry was found by fitting structures optimized with fixed unit-cell volume to a Vinet equation of state.40 This procedure, on the one hand, is more versatile than just optimizing the lattice constants with a suitable algorithm (such as the conjugate gradient algorithm) as it allows for extracting additional information from the fit (such as the bulk modulus). On the other hand, it avoids Pulay stress41 arising from a minor inconsistency between the plane wave basis functions and the changed volumes during optimization. Avoiding that in a full geometry optimization would require a particularly large basis set. To account for van der Waals (vdW) interactions, by default the D3 correction with Becke-Johnson damping (D3-BJ) was used after careful tests (see Section 3.2.1; the used standard parameters are listed in the Supporting Information). This approach employs a r–6 and a r–8 term to describe attractive vdW interaction with the coefficients depending on the chemical environment of each atom by means of geometry-dependent coordination numbers.42,43
The Raman activities for isolated molecules were calculated using the Gaussian 16 package (Revision A.03),44 while the Raman activities of the crystalline phase were calculated by finite (Cartesian) displacements with our own postprocessing tool (relying on the equations described in ref (45)). A detailed description of the employed procedure can be found in the Supporting Information.
2.2. Density Functional Tight Binding calculations
The DFTB+ package46 (version 18.1) was employed to carry out the calculations within the self-consistent charge (SCC-)DFTB approach. The publicly available 3ob-3-1 Slater-Koster files including the 3ob:freq-1-2 extension for obtaining more accurate vibrational properties47 were used throughout all calculations. The third order correction of the DFTB3 functional48 was included, as the used functional-dependent vdW parameters were optimized for this functional. The D3-BJ correction was used to be consistent with the DFT calculations employing the (standard) parameters listed in the Supporting Information. Regarding the sampling of reciprocal space, the same settings as for DFT were chosen. All available angular momentum atomic orbitals for each species were considered, and the SCC convergence criterion was set to 10–10 elementary charges.
The optimization of the primitive unit-cell shapes turned out to be more involved than in the DFT calculations. In order to keep the monoclinic Bravais lattice (independent variables are the lengths of the unit-cell vectors, |a|, |b|, and |c|, and the angle β ≠ 90°), several constraints would have been required during the optimization. These are not implemented in the used version of the code. In order to overcome this problem, the lengths of the lattice vectors were optimized together with the atomic positions for a set of fixed monoclinic angles β, using the conjugate gradient algorithm. To find the optimal monoclinic angle, a second order polynomial was then fitted to the energy-vs-β curve (see the Supporting Information). The resulting angle was subsequently used for a final optimization of the lengths of the lattice vectors and the atomic positions (ensuring residual forces below 10–8 eV/Å).
In this context it is interesting to mention that Brandenburg and Grimme suggested using DFT-optimized unit-cell parameters and optimizing only the atomic coordinates for this unit cell when calculating phonon properties employing DFTB.49 The suitability of this approach for the present problem will also be tested.
Finally, we want to emphasize that our results within DFTB have been obtained in an “off-the-shelf” manner–i.e., we did not reparametrize any Slater-Koster files but rather relied on the publicly available ones.
2.3. Force-Field Calculations
The performance of empirical force fields (FFs) at various levels of sophistication was also assessed. As a starting point, we employed the Generalized AMBER Force Field (GAFF),50 where AMBER stands for “Assisted Model Building with Energy Refinement”. It is a transferable force field frequently used for simulations of organic semiconductors.7,51−53 The GAFF parametrization has been specifically designed for small organic molecules. In GAFF, all bonded interactions are described by harmonic potentials, and no cross terms between different geometric parameters are considered. Electrostatic interactions are described via individual point charges localized at the positions of the nuclei. As GAFF provides no predefined atomic charges, these were determined here from the electrostatic potential of the periodic DFT reference (with the DFT-optimized unit cell and atomic positions) employing the REPEAT(54) method.
The description of interatomic interactions in GAFF is only harmonic–i.e., all nonparabolic potential terms arise from Coulomb and vdW interactions. Therefore, we also tested the performance of a more sophisticated, second-generation force field building on the “condensed-phase optimized molecular potentials for atomistic simulation studies” (COMPASS),55 which has been used in several studies dealing with transport properties of molecular crystals.56−59 The parameters in COMPASS have been specifically developed for aliphatic and aromatic compounds. In contrast to GAFF, COMPASS includes anharmonic bonding interactions and numerous cross terms between bonds, bending angles, and torsions. The inclusion of these terms should lead to significant improvements for vibrational properties. A further difference is the softer 9-6 Lennard-Jones potential in COMPASS (see refs (60 and 61)) compared to the 12-6 term utilized in GAFF.50 Notably, in the COMPASS simulations, standard predefined atomic charges were used.
It should be stressed that all methods discussed so far rely on off-the-shelf implementations–either using standard PAW potentials in DFT, publicly available Slater-Koster files in DFTB, or ready-to-use force fields. This does not (directly) apply to our final option, a nontransferable FF, which has been parametrized based on DFT reference data of the studied system. The functional form of that force field is based on the MOF-FF62 class of force fields, which has originally been developed for metal–organic frameworks (MOFs).63 In fact, to the best of our knowledge, MOF-FF type force fields have not been applied to molecular crystals in the past. Our parametrization of MOF-FF contains the original cross terms from the implementation in ref (62). In analogy to the COMPASS FF, for atoms bonded in a 1-2-3-4 fashion, we also considered cross terms between stretching motions of the atom pair 1 and 2 with the atom pair 3 and 4 (so-called bb13 cross terms; see the Supporting Information). A deviation is the different description of vdW interactions: while COMPASS uses the 9-6 Lennard-Jones potential, in MOF-FF a damped Buckingham potential is used–i.e., MOF-FF relies on an ordinary Buckingham potential (consisting of an exponential repulsive term and an attractive r–6 term), where the attractive part is additionally multiplied with a damping function. The latter eliminates the potential minimum of the undamped version at small distances (for a thorough definition see ref (62)). Additionally, MOF-FF employs spherical Gaussian charge distributions instead of point charges to describe electrostatic interactions. Finally, the number of atom types for which distinct parameters are considered differs in the above-mentioned force fields. For example, for the naphthalene molecules, MOF-FF distinguishes between five different atom types (two hydrogens and three carbons), as opposed to only two (one hydrogen and one carbon) considered in GAFF or COMPASS. The parametrization of MOF-FF was performed by using the software FFgen.62,64 Our fit is based on molecular ab initio reference data comprising interatomic force constants (i.e., the Hessian matrix) and the optimized geometry (bond lengths, angles, dihedrals, etc.) for an isolated naphthalene molecule obtained using the Turbomole(65) software package (version 7.3). Specific simulation details can be found in the Supporting Information together with the fitted force-field parameters. Atomic charges were obtained from a fit of the electrostatic potential of the isolated naphthalene molecule in the gas phase using the Horton(66) package (see the Supporting Information). The vdW parameters used within MOF-FF are derived from the MM3 parameter set67,68 with certain modifications described in detail in ref (62).
Geometry optimizations and calculations of interatomic forces for all FFs were performed with the LAMMPS(69) package. The geometries were minimized to residual forces below 10–7 eV/Å with the conjugate gradient algorithm. A cutoff for both vdW and Coulomb interactions of 12 Å was chosen. To avoid discontinuities at this cutoff, an additional smoothening between 10.8 and 12 Å was applied for MOF-FF and GAFF. For COMPASS we did not apply such a procedure, as such a smoothening is not available without changing the force field.
It should be stressed that in the present paper we are concerned with phonon band structures. Therefore, in contrast to the more typical application of FFs in molecular dynamics simulations at finite temperatures, we restricted our simulations to lattice dynamics performed at 0 K. Here, the force fields are solely employed as a means for obtaining interatomic forces in analogy to our quantum-mechanical simulations.
2.4. Phonon Calculations
The PHONOPY(70) code was used to calculate phonon bands by means of finite displacements in supercells. In the case of DFT and DFTB, 2 × 3 × 2 supercells were found to be large enough for obtaining a converged dynamical matrix. For the FF-based calculations, 3 × 3 × 3 supercells were necessary to reach the desired level of accuracy (see the Supporting Information). The default PHONOPY displacement of 0.01 Å was used for all calculations, as varying the displacement amplitudes between 0.0025 and 0.02 Å resulted in maximum absolute frequency differences below 0.02 THz for DFT. The obtained harmonic force constants were symmetrized a posteriori with PHONOPY’s internal subroutines, in order to correct for possibly lost symmetries caused by numerical inaccuracies. The group velocities of the phonons (i.e., the velocities with which they, for example, transport thermal energy) are defined as the gradients of the angular frequencies with respect to the phonon wavevectors (see eq 1). They were calculated from the analytic gradients of the dynamical matrices with PHONOPY.
| 1 |
For plotting phonon bands, the reciprocal space was sampled at 200 wave vectors, q, between each pair of high-symmetry points in the 1BZ. For comparing quantities in the entire 1BZ, or for obtaining quantities for which a Brillouin zone integration (summation) is required, a 9 × 10 × 9 q-mesh was used to sample the different directions in the anisotropic unit cell as uniformly as possible. This choice of q-mesh yields a q-spacing of ∼0.1 Å–1 in each direction with 810 q-points per band (246 irreducible ones for the given space group symmetry). For several of the comparisons contained below, phonon properties (frequencies or group velocities) are plotted at these discrete q-points. For calculating group velocities and thermal displacements (see below), the q-meshes were shifted such that they do not include the Γ-point. In the case of group velocities, this is necessary to obtain unbiased estimates with respect to the reference because at Γ there is not a single uniquely defined group velocity for the acoustic phonons. The reason for that is that the frequencies of the acoustic bands near Γ are proportional to cq|q|, with cq being the (directionally dependent) speed of sound, which at Γ is a noncontinuously differentiable function. As a consequence, the (nonzero) slope of the band structure switches sign depending on whether the Γ-point is approached from one side (q → 0+) or from the other (q → 0–). Consequently, including Γ-phonons would result in incorrectly estimated errors. For the thermal displacements, shifted meshes were used to avoid divergences at zero frequency (see below).
Smooth curves, like for the densities of states (DOS), are obtained by summing over Lorentzian functions with widths, σ, of 0.05 THz (2σ corresponds to the full width at half-maximum; fwhm) centered at the frequencies of the phonons calculated employing the above-described q-mesh. The resulting DOSs are then normalized such that their integral over the frequency yields 3N, where N is the number of atoms in the primitive unit cell. Thermodynamic quantities were calculated according to the well-known expressions from statistical physics (see below). It should be stressed that the reported temperature dependence of those thermodynamic properties does not account for thermal expansion of the lattice since such anharmonic effects lie beyond the scope of the current work.
3. Results and Discussion
3.1. Relevant Frequency Ranges
In the following discussion we will separately benchmark the performance of the different methodologies for the low-frequency region (up to frequencies of 9 THz, corresponding to ∼300 cm–1, see below) and for the entire spectral range in which vibrations occur. One of the motivations for distinguishing between frequency ranges is that several relevant quantities are primarily impacted by phonons at rather low frequencies.
This, for example, applies to the mean squared thermal displacement (MSTD) ⟨|uiα|2⟩ of atom α in direction i (see eq 2a) with mα being the mass of that atom.
| 2a |
| 2b |
This quantity is a measure for thermal disorder, which, for example, crucially impacts the electrical conductivity of organic semiconductors. Furthermore, the (anisotropic) mean squared thermal displacements play a significant role in X-ray diffraction (XRD), as they enter the Debye–Waller factors,71,72 in this way determining the width of XRD peaks due to atomic motion.
The ⟨|uiα|2⟩ can be decomposed into material-specific quantities, like the absolute values of the phonon eigenvectors (i.e., the polarization vectors ei) and the density of states (DOS), as well as into a material-independent function fD (see eq 2b), which scales the contributions of the individual phonon modes.73fD is determined by the mode occupation n(ω,T) given by the Bose–Einstein distribution and by the angular frequency ω of the mode. As shown in Figure 2(a), fD exclusively “selects” low-frequency modes and at low temperatures converges to the hyperbolic ω–1 function.
Figure 2.
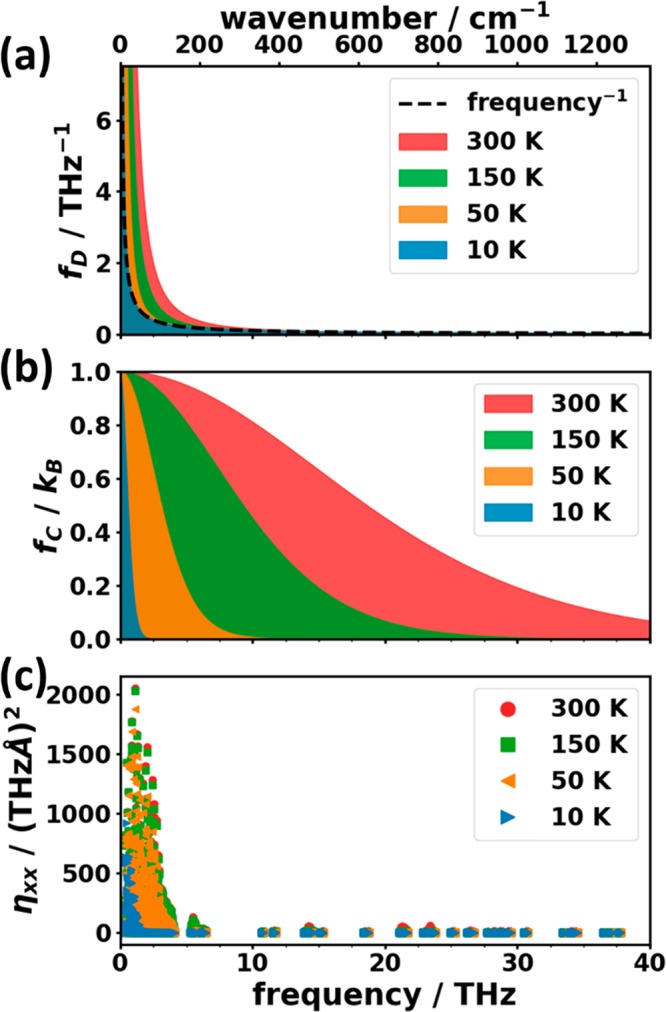
Frequency dependence of the material independent spectral function for (a) the mean squared thermal displacements, fD, and (b) the phonon mode heat capacity, fC. Panel (c) contains the harmonic part of the mode contributions ηxx to the thermal conductivity (xx component). For further details on the plotted quantities see the main text.
Similarly, the phonon contribution to the heat capacity (see eq 3a) can be calculated as an integral over the DOS multiplied with a material-independent spectral function fC (given in eq 3b).
| 3a |
| 3b |
This spectral function acts as a temperature-dependent low-pass filter with a cutoff frequency decreasing with decreasing temperature. Figure 2(b) shows that at low temperatures, fC again “selects” only low-frequency modes (at 150 K, fC drops to half its maximum at ∼9.15 THz). When the temperature rises, e.g., to room temperature, also phonons at intermediate frequencies play a role.
The situation changes, when in addition to phonon occupation also other (potentially material-dependent) factors play a role. In the following, this is exemplarily shown for the thermal conductivity tensor, κ, of naphthalene derived from the linear Boltzmann transport equation. Eq 4a shows how κ can be calculated from the material’s harmonic elastic properties, summarized in the tensorial quantity, ηλ, and from the phonon lifetimes, τ (an intrinsically anharmonic property).
| 4a |
| 4b |
The summation index, λ, is a shortcut notation for band index n and wave vector q. As in the present contribution we are exclusively concerned with harmonic properties, in the following, ηλ shall be discussed in somewhat more detail. It is defined by eq 4b and contains the dyadic product of the group velocities vg as well as the heat capacity weighting function fC (see eq 3b). The xx component of ηλ is plotted in Figure 2(c) for naphthalene (for the DFT reference calculation; see Section 3.2.1). Here one sees that, due to a pronounced decrease of the product of group velocities with frequency, the contributions to the thermal conductivity are more strongly confined to low frequencies than the contributions to the heat capacity.
There are, however, also quantities for which the contributions of all phonon modes are relevant. An example for such a quantity is the free energy, which determines, e.g., the relative stability of polymorphs. Here, as a consequence of the zero-point energy, not only the contributions of occupied modes count. Notably, for the zero-point energy high-frequency modes are even particularly relevant.
An additional aspect that makes a discrimination between a low- and a high-frequency region advisible is that the nature of the vibrations in the two regimes is fundamentally different in organic semiconductors. This can be seen when comparing Raman spectra of naphthalene calculated for an isolated molecule with those of the molecular crystal: the calculated spectrum for the crystal display an excellent overall agreement with the experimental data on polycrystalline naphthalene by Zhao and McCreery74 (see Figure 3). Above ∼10 THz the molecular and crystal spectra agree very well, suggesting that also in the crystalline environment the respective vibrations are primarily of intramolecular nature. Conversely, the pronounced features below ∼5 THz appear only for the molecular crystal, which implies that they are associated with intermolecular motions.
Figure 3.
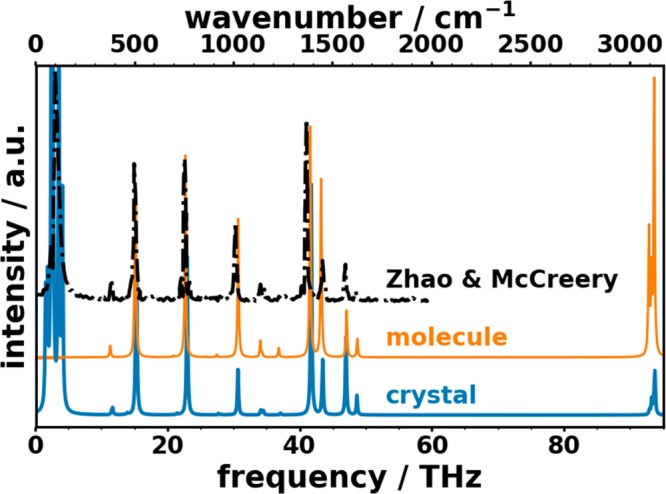
Simulated unpolarized Raman spectra for molecular (calculated with Gaussian16, 6-311G(d,p)++/PBE) and crystalline (VASP, PBE) naphthalene (solid lines) compared with experimental data from Zhao and McCreery.74 For both simulated spectra and the measurement of Zhao and McCreery, an excitation wavelength of 784 nm was used. The nature of the morphology is not specifically described in ref (74) but was privately communicated to us by Richard McCreery.
An analysis of the eigenmodes indeed shows that the 12 lowest-lying bands (up to ∼4.0 THz) correspond to motions in which the two naphthalene molecules in the unit cell essentially rotate or translate relative to each other.
3.2. Phonons in the Low-Frequency Regime (up to 9 THz)
3.2.1. DFT Simulations: Identifying a Suitable Reference Methodology
In view of the discussion in the previous section, we will first analyze the performance of the various methodologies in the low-frequency regime. Since the details of the phonon band structure of naphthalene have already been discussed, e.g., in refs (25, 30, and 75), in the following, we will primarily focus on the impact of different levels of theory on the obtained numerical results. As a first step, we will test to what extent DFT calculations relying on the PBE functional can serve as reference calculations for more approximate approaches. This would be useful, as the available experimental phonon band structures are not sufficient for generating reference data for thermodynamic quantities such as free energies and heat capacities. This is because they were measured only in selected high-symmetry directions and up to 4 THz (i.e., only for the intermolecular modes). Bearing in mind that the low-frequency vibrations are crucially impacted by intermolecular interactions (see above), for identifying the ideal reference methodology it is useful to first assess the performance of different a posteriori vdW correction schemes. In this context, it has been shown recently for Γ-point vibrations (specifically for Raman spectra) that the D3-BJ correction (see the Methodology section) yields highly accurate results for a variety of rather complex organic semiconductors and their polymorphs.23 Essentially the same accuracy has been obtained in ref (23) with the many-body dispersion (MBD) method,76,77 albeit at sharply increased computational costs. Nevertheless, employing the MBD approach would be elegant, as it is based on the expression for the correlation energy in the random phase approximation and, thus, does account not only for two-body but also for many-body dispersion interactions. Notably, also for naphthalene, D3-BJ and MBD van der Waals corrections yield nearly perfect agreement both in terms of lattice parameters (see Table 1) and for Γ-point frequencies (see the Supporting Information). As far as phonon band structures are concerned, we have, however, not been able to complete the MBD simulations, which we, tentatively, attribute to the very large number of atoms in the supercells needed to calculate phonon bands (these contain 432 atoms). In passing we note that Brown-Altvater30 found that, when fixing the unit-cell size to the experimental value, also disregarding van der Waals interactions provides a good agreement between measured and calculated phonon bands, similar to what we have observed for the above-mentioned analysis of low-frequency Raman spectra.23 This approach, however, does not allow a meaningful optimization of the naphthalene unit cell and, thus, will also not be pursued in the following.
Table 1. Comparison of Simulated Lattice Constants of (Nondeuterated) Naphthalene with Experimental Data (Measured at 5 Ka)b.
| |a|/Å | |b|/Å | |c|/Å | β/deg | unit-cell volume/Å3 | |
|---|---|---|---|---|---|
| experimenta | 8.080(5) | 5.933(2) | 8.632(2) | 124.65(4) | 340.41 |
| DFT + D3-BJ | 8.078 | 5.903 | 8.622 | 124.24 | 339.91 |
| DFT + MBD | 8.090 | 5.910 | 8.608 | 124.24 | 340.25 |
| DFT + TS | 8.052 | 5.860 | 8.616 | 123.89 | 337.47 |
| DFT + D2 | 7.822 | 5.821 | 8.485 | 125.34 | 315.09 |
| DFTB | 7.573 | 5.733 | 8.457 | 125.04 | 300.61 |
| COMPASS | 8.002 | 5.771 | 8.500 | 124.64 | 322.96 |
| MOF-FF | 7.998 | 5.884 | 8.635 | 123.18 | 340.18 |
| GAFF | 7.850 | 5.979 | 8.610 | 124.05 | 334.88 |
The experimental data were taken from ref (75).
The digits in brackets in the experimental data imply the measurement uncertainty.
Consequently, Figure 4(a) contains only a comparison between the phonon bands calculated employing the D3-BJ approach and the experimental results measured at 6 K for deuterated naphthalene.18 The overall agreement between theory and experiment is excellent, with a root-mean-square deviation (RMSD) between the measured data points and the calculated ones amounting to ∼0.13 THz (∼4.3 cm–1). This is true for the entire frequency range for which experimental data are available (i.e., up to 4 THz). In this context it should be noted that an analysis of the associated displacement patterns reveals that this frequency range also comprises all 12 bands dominated by intermolecular vibrations. In the following comparison we will, however, also include the largely intramolecular bands between ∼5 THz and 6 THz as a first benchmark for the performance of the employed methodology for describing the relative energetics of inter- vs intramolecular phonons.
Figure 4.
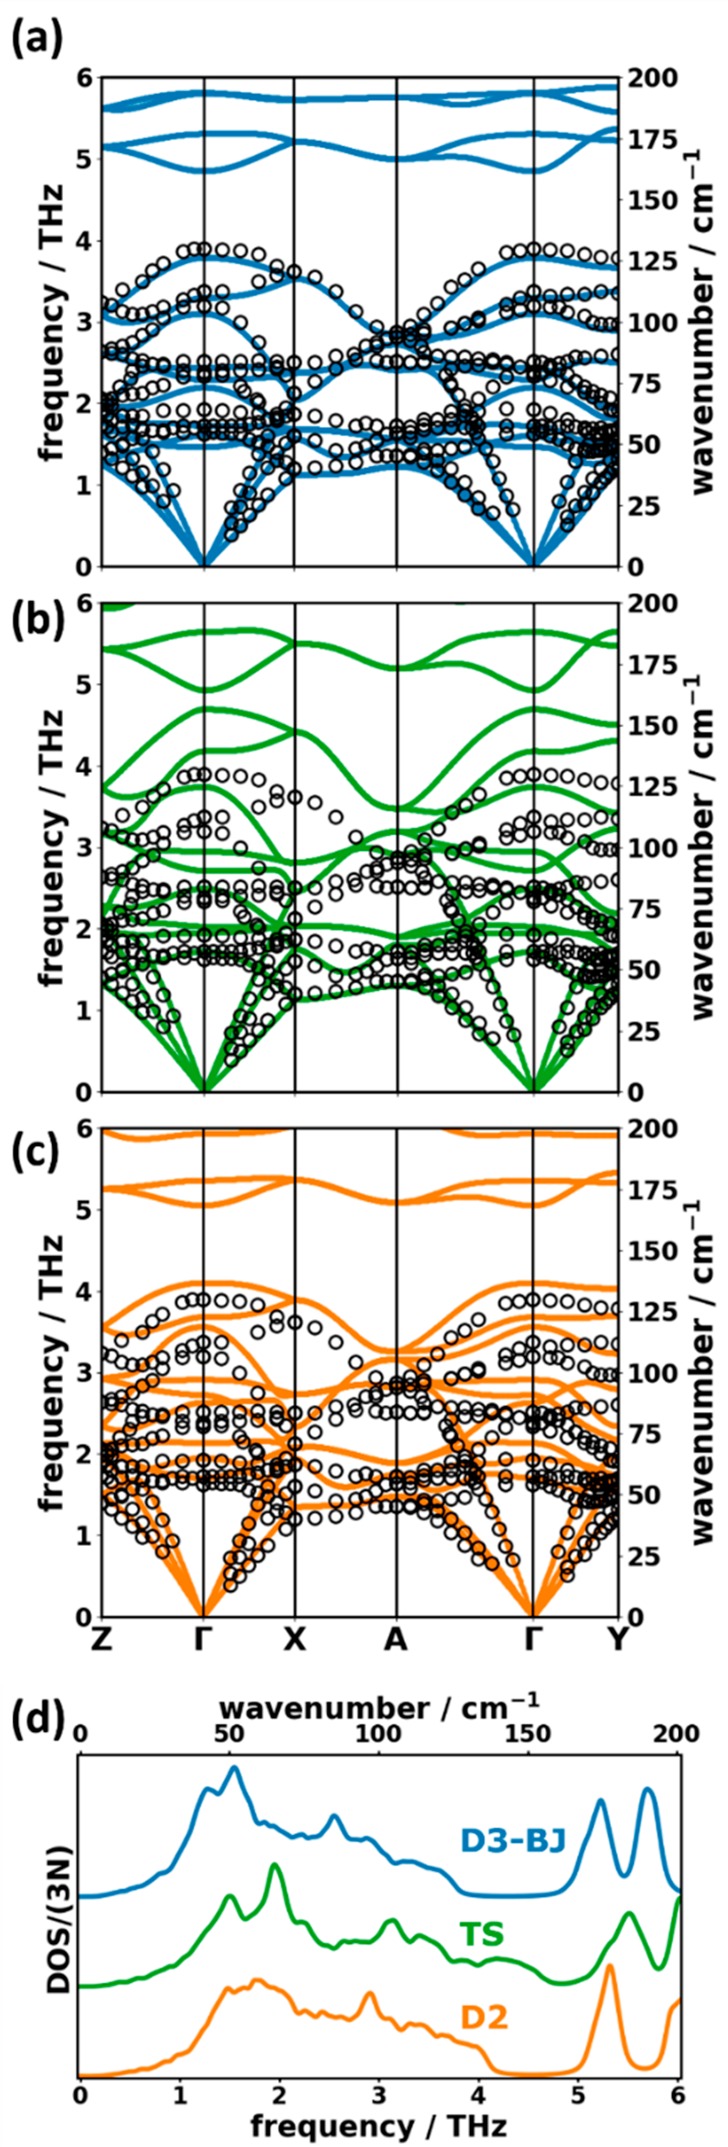
DFT calculated phonon band structure of deuterated naphthalene simulated with the (a) D3-BJ, (b) TS, and (c) D2 vdW corrections compared to data measured by inelastic neutron scattering at 6 K (open circles).18 Panel (d) compares the normalized DOSs for the three theoretical methodologies. The frequency range contained in the plots does not cover the entire low-frequency region defined earlier. This is because there are no experimental data above 4 THz, and the deuteration of naphthalene shifts all calculated frequencies to lower values compared to the nondeuterated molecules. We note that a comparison of the experimental phonon dispersion of deuterated naphthalene with simulations based on DFT employing different functionals can also be found in ref (30).
The two other a posteriori vdW corrections that have been tested in ref (23) in terms of reliably reproducing Raman spectra are the Grimme D2 approach78 and the Tkatchenko-Scheffler (TS) method.79 In contrast to the D3-BJ method, the D2 vdW correction does neither include an attractive r–8 term in addition to the r–6 term, nor do the coefficients depend on the atoms’ local coordination. Additionally, the Fermi-type damping function in the D2 method is less smooth than the Becke-Johnson damping in D3-BJ. The TS approach is similar to the D2 method in terms of the functional form of the vdW interaction. It differs, however, in the way the vdW coefficients are calculated: while D2 uses tabulated values, the TS method calculates them based on the atomic polarizabilities derived from a Hirschfeld partitioning of the system’s charge density. The phonon band structures obtained with those two vdW corrections are compared to the low-temperature (6 K) experimental data18 in Figure 4(b) and (c). The respective optimized unit-cell parameters are contained in Table 1. Interestingly, the unit-cell parameters from the TS calculation still agree rather favorably with the experiments. This also applies to the acoustic phonon bands. For the optical bands, we, however, obtain significant deviations between the TS simulations and the experiments, which increase with phonon frequency. The D2 approach underestimates the unit-cell volume by ∼10% with lattice vectors underestimated by ∼0.1–0.2 Å. In spite of this apparent overestimation of the van der Waals attraction, for the phonon band structure the agreement with experiments [Figure 4(c)] is significantly better than in the TS case (but at the same time significantly worse than for the D3-BJ approach).
The methodology-dependent shifts of the bands are also reflected in the low-frequency DOSs [see Figure 4(d)], which represent the situation in the entire 1BZ rather than along the high-symmetry paths in the band structures. Comparing the DOSs, one can again see that the TS approach shifts many spectral features to too high frequencies. This also applies to the lower edge of the band gap occurring between the highest intermolecular and lowest intramolecular modes (at ∼4 THz in the D3-BJ results). This results in a nearly complete closure of the gap. In the D2 simulations, this shift is less pronounced, and the band gap is reproduced relatively well. However, the peaks in the D3-BJ DOS below 2 THz are entirely washed out in the D2 calculation, suggesting that the bands are more “homogeneously” distributed than in D3-BJ.
These comparisons show that DFT/D3-BJ is clearly the best suited “high-level” theoretical methodology that can be applied to benchmark the other more approximate approaches considered in this work. Thus, DFT/D3-BJ results will be referred to as “DFT ref” in the following.
Up to this point, we have considered deuterated naphthalene in order to validate the DFT reference data by comparing them to the neutron scattering data. In the following it is no longer necessary to maintain the deuteration. Thus, from now on all displayed data describe the practically more relevant nondeuterated species.
3.2.2. Obtaining Phonon Band Structures with Density Functional Tight-Binding Theory
A significant speedup of the computations can be achieved by switching to a more approximate methodology, like density functional tight-binding (DFTB). This, however, comes at a cost: as can be seen in Table 1, the DFTB-calculated lattice parameters differ quite significantly from the experiments and from the DFT reference calculations. Notably, |b| and |c| are slightly shorter by approximately the same amount (∼2–3%), but |a| is shorter by ∼6%. This results in a much denser herringbone packing. As the intermolecular vibrations are particularly sensitive to the packing structure, one can expect deviations for the low-frequency modes. These are indeed observed in the calculated band structure and the DOS in Figure 5(a): the band widths and slopes of the acoustic bands in DFTB are significantly overestimated compared to the DFT reference, which results in a more gradual onset of the associated DOS together with a shift of its peaks to higher energies. This can be understood as a direct consequence of the denser packing, resulting in an increased mechanical stiffness of the system. Also for the optical bands massive differences are observed. Some of the bands are primarily shifted to higher frequencies, which results in a shift of the DOS peaks. In many cases also the band shapes change dramatically. Most significantly, the band gap between the highest intermolecular and the lowest intramolecular modes observed in the DFT calculations between ∼4.1–5.3 THz disappears for DFTB (similar to the above-described DFT/TS case). The closing of the gap in DFTB is mostly a consequence of an upward shift of the two intermolecular bands at the lower edge of the gap (∼3.56 THz and 4.11 THz in DFT and ∼5.14 THZ and 5.56 THz in DFTB at Γ). An analysis of the associated displacement patterns shows that these vibrations correspond to molecules essentially twisting around their long axes either out of phase (lower band) or in phase (higher band). Not surprisingly, the increased packing density for the DFTB geometry affects these modes particularly strongly.
Figure 5.
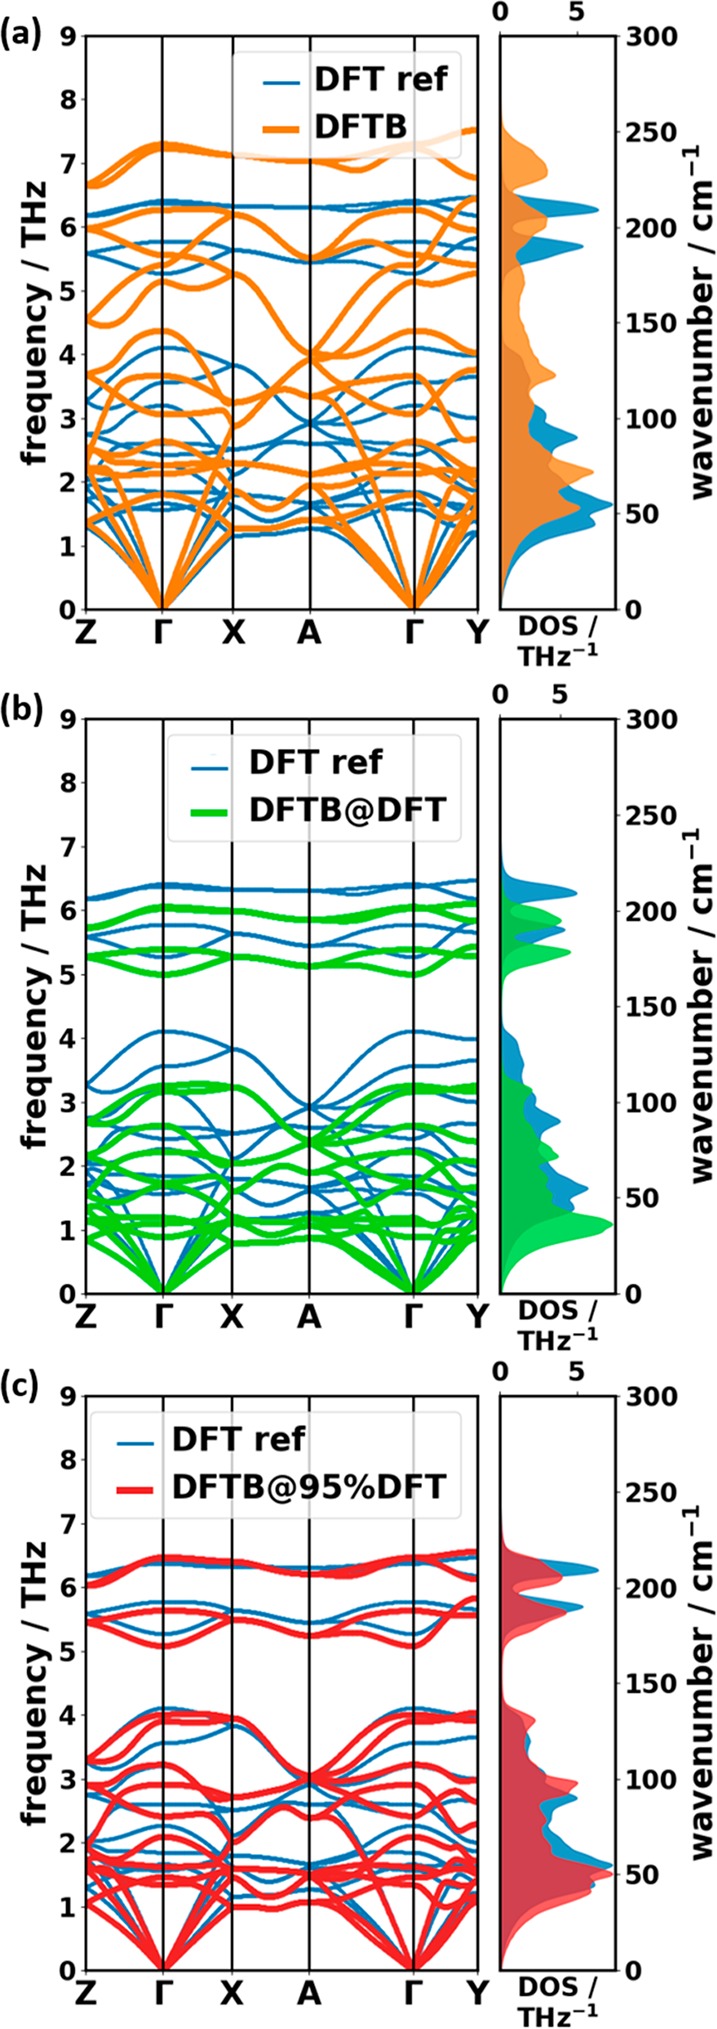
Comparison of phonon band structures and DOSs of the reference DFT/D3-BJ calculation (DFT ref) with DFTB/D3-BJ simulations based on (a) a structure with the DFTB-optimized unit cell, (b) a structure with the DFT/D3-BJ unit cell, and (c) a structure calculated for the DFT/D3-BJ unit cell isotropically rescaled by a factor of 0.95. Notably, for all these approaches the atomic positions within the unit cells have been optimized at the DFTB/D3-BJ level (i.e., at the same level of theory used for the phonon calculations).
This raises the question whether the deviations between the DFT and the DFTB bands could be fixed by using more realistic unit-cell parameters. In fact, Brandenburg and Grimme49 suggested that for calculations of phonon bands employing DFTB, one should rely on geometries in which the lattice parameters obtained in a DFT optimization are used and where only the atomic positions are optimized at the DFTB level. Note that keeping the unit cell fixed to a size and shape that do not correspond to the optimum values within the used level of theory is technically equivalent to applying external stress to the crystal. In spite of this stress, an energetic minimum structure (for which phonons can be calculated) can still be found when optimizing the atomic positions within this “strained” unit cell. The low-frequency bands obtained with this approach (referred to as “DFTB@DFT”) are compared to the DFT reference data in Figure 5(b).
Indeed, certain aspects of the phonon bands are improved. For example, the first band gap and the shape of the DFTB@DFT DOS are more similar to the DFT reference. The quantitative agreement is, however, still far from satisfactory. Compared to the DFT reference, the energy scale is now compressed rather than expanded; i.e., phonons are shifted to too low frequencies. Like for most materials, the mode Grüneisen parameters in naphthalene have a positive sign25,80,81 (i.e., phonon frequencies increase upon decreasing the unit-cell volume). This suggests that a solution to too low frequencies would be decreasing the volume of the primitive unit cell. Indeed, the best result for a DFTB-calculated phonon DOS and band structure is found when rescaling the unit-cell volume to 95% of the DFT value [“DFTB@95%DFT”, Figure 5(c)]. This rescaling minimizes the RMS deviation (RMSD) of frequencies with respect to the DFT reference regardless of whether modes from the entire 1BZ or only at Γ are considered (see the Supporting Information). This suggests that a possible strategy for obtaining quantitatively more accurate DFTB bands could be to determine the optimum unit-cell rescaling factor based on Γ-point frequencies (where DFT/D3-BJ calculations are affordable also for more complex molecular crystals). This “optimized” unit cell could then potentially be used as the basis for DFTB calculations of the phonon bands, but before generally applying that approach, tests on alternative systems would be advisible. Moreover, at finite temperature one would have to find the scaling factor that matches the phonons at the thermally expanded volume, as anharmonicities are not necessarily equally described in DFTB and DFT. Thus, a general application of this procedure is far from straightforward, and a reparametrization of Slater-Koster files considering phonon properties might well be a more promising and potentially better transferrable approach.
3.2.3. Obtaining Phonon Band Structures with Classical Force Fields
The largest speed-up of the calculation of phonon bands can be achieved by describing interatomic interactions with parametrized force fields (FFs). Interestingly, independent of their level of sophistication all used force fields (COMPASS, MOF-FF, and GAFF) yield optimized unit cells, whose lattice parameters are in close agreement with the DFT reference data and the experiments (see Table 1). In particular for MOF-FF, the unit-cell volume is essentially identical to the experimental and theoretical references, in spite of the fact that the naphthalene force-field parametrization has been performed on an isolated molecule. Moreover, dispersion interactions, which are particularly relevant for intermolecular interactions, are not part of the system-specific parametrization process at all. Using MOF-FF and GAFF, a maximum relative deviation of ∼−2% and ∼−3% is observed for |a|. Notably, this unit-cell vector primarily determines the distance between the two inequivalent molecules in the unit cell. In contrast, in the COMPASS optimizations the largest deviations (∼−2%) are found for the |b| lattice parameter–i.e., the shortest distance between one molecule and its periodic image. The use of force fields in the geometry optimization also results in a less symmetric geometry (COMPASS and GAFF: space group P1, MOF-FF: space group P1̅) compared to the one obtained in the reference calculation and in the experiments (space group P21/a).
The comparison of the band structures and DOSs of the FFs with the DFT reference data is shown Figure 6. The strength of the COMPASS force field lies in an accurate description of the acoustic bands. The DOS up to ∼1.2 THz shows the best agreement with the reference for all cases discussed so far, which results in an onset of the DOS perfectly matching the DFT reference. At higher frequencies, however, the agreement deteriorates. The edges of the band gap are relatively far from the reference, and the higher bands (∼4.0–6.5 THz) not only are shifted but also show significant changes in their dispersion. This particularly applies to the intramolecular bands, where the parametrization of the bonding interactions of the force field is expected to play a crucial role.
Figure 6.
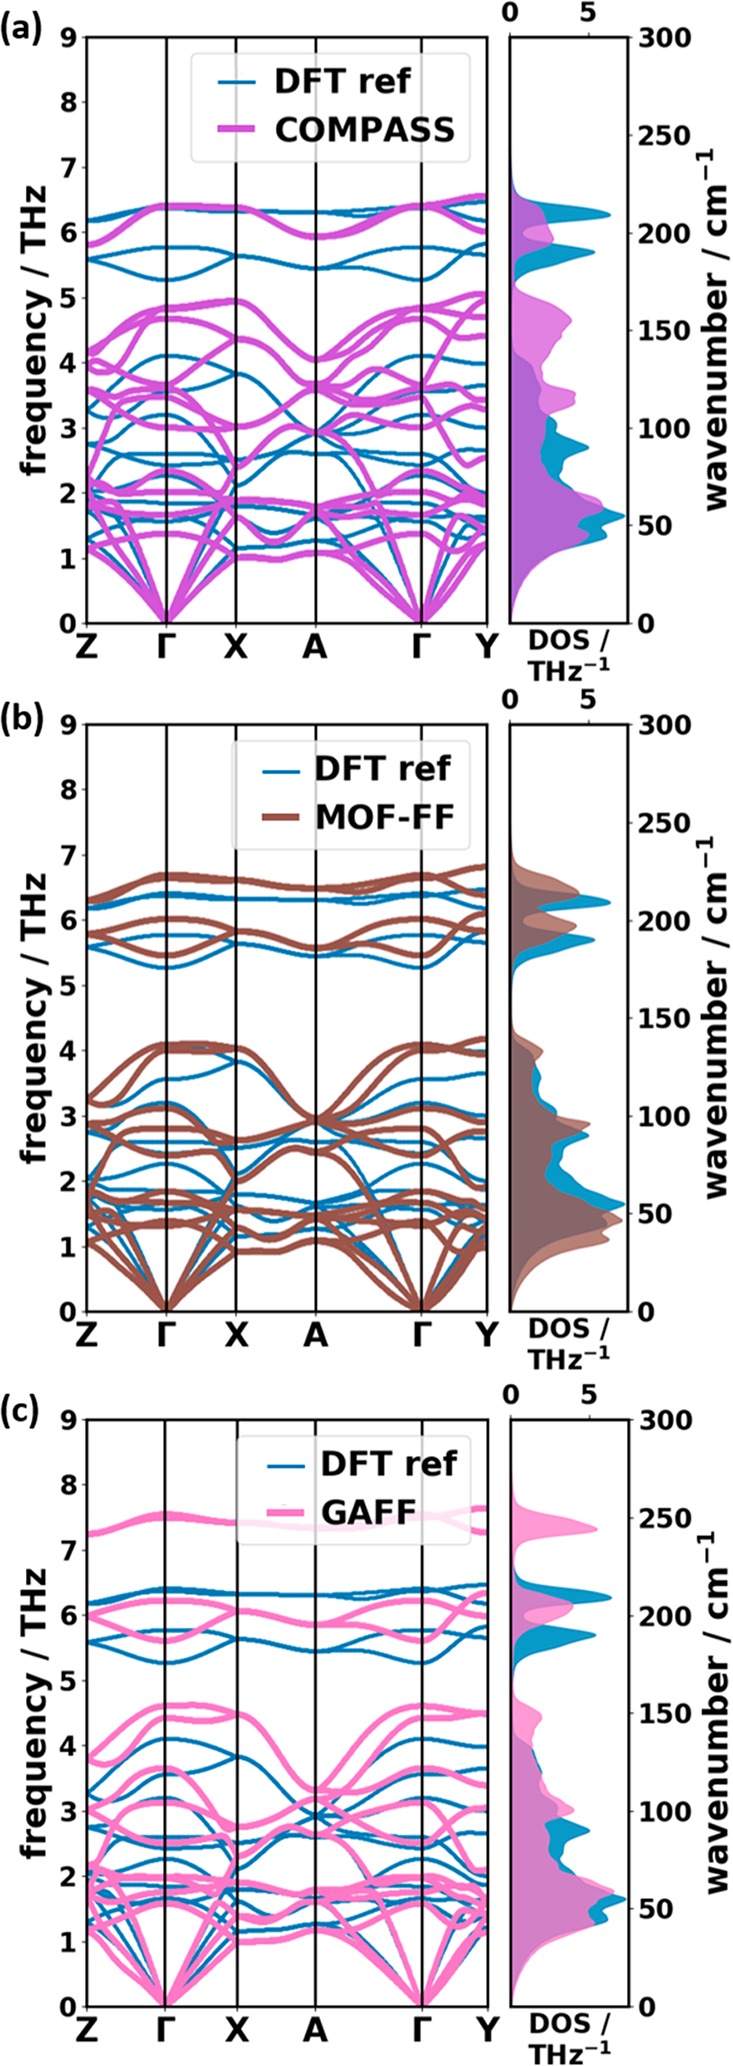
Comparison of phonon band structures and DOSs of the reference calculation (DFT ref) with the results obtained using the following force fields for both the unit-cell optimization and the frequency calculation: (a) COMPASS,55 (b) our own parametrization of the MOF-FF,62 and (c) GAFF.50
The overall agreement with the reference data is clearly improved for our MOF-FF parametrization of naphthalene [see Figure 6(b)], with a satisfactory reproduction of most of the characteristic features of the reference DOS and band structure. Only the bands below ∼2 THz are slightly shifted to lower frequencies resulting in a premature rise of the phonon DOS. The better performance of MOF-FF compared to COMPASS for the intramolecular bands is not unexpected, considering that especially the bonding part of MOF-FF (together with the atomic charges) has been parametrized/fitted based on a DFT calculation of a naphthalene molecule, while the COMPASS potential is not system-specific.
Interestingly, GAFF provides an excellent agreement with the reference for the low-frequency band structure and DOS in spite of its very simple structure. Most of the characteristic features in the band dispersion are reproduced, although some bands experience shifts to (typically higher) frequencies. In fact, up to 4.5 THz the agreement with the reference is nearly as good as for the MOF-FF calculations. For the acoustic bands, GAFF even outperforms MOF-FF. This supports the notion that the nonbonding interactions (vdW and Coulomb) are most relevant for the intermolecular modes in this spectral range and that their description in GAFF occurs at an acceptable level of accuracy. As far as the intramolecular bands above ∼5 THz are concerned, the agreement between the GAFF results and the DFT reference clearly deteriorates, which can be attributed to the purely harmonic bonding interactions in GAFF and the omission of any cross terms.
Concluding this section on the simulation of band structures, it should be remarked that the same trends described above for the comparison relative to the DFT reference are also found, when comparing bands for deuterated naphthalene to the neutron scattering experiments. This is explicitly shown in the Supporting Information.
3.2.4. Quantitative Benchmark of Phonon Properties in the Low-Frequency Region
In order to obtain more quantitative insights into the performance of the different methods, it is useful to analyze bands not only along high-symmetry directions but rather to sample the entire 1BZ. As described in Section 2.4, this is done by employing a 9 × 10 × 9 q-mesh. Figure 7(a) shows the deviations of the calculated phonon frequencies between the more approximate methods and the DFT/D3-BJ reference data obtained in this way. In passing, we note that to make such a comparison it is necessary to identify equivalent phonon modes calculated with different approaches. For that, we relied on the respective phonon eigenvectors (polarization vectors) and made use of the algorithm of Kuhn82 as described in more detail in the Supporting Information.
Figure 7.
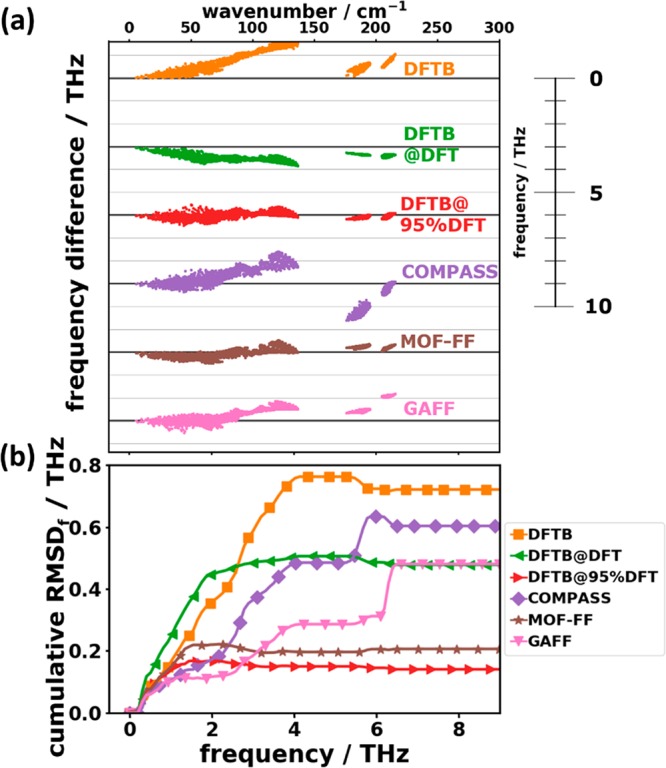
(a) Frequency differences with respect to the reference (DFT/D3-BJ) for the tested approaches as a function of the reference frequency in the low-frequency region. Each approach has its own zero line (thick black horizontal lines). (b) Cumulative root-mean-square deviations of frequencies up to a certain cutoff frequency as a function of that cutoff frequency.
To obtain quantitative descriptors for the performance of a specific method for calculating a quantity x, we calculated the corresponding root-mean-square deviations (RMSDx), as defined in eq 5a.
| 5a |
Unfortunately, the RMSDx values cannot tell whether a method typically under- or overestimates a given quantity. Moreover, large values of the RMSDs for quantities associated with the phonon band structure (like frequencies or group velocities) do not necessarily mean that derived quantities (such as heat capacities) are poorly described. For those, one might encounter fortuitous error compensations between frequency ranges in which frequencies are overestimated and regions in which they are underestimated. To assess, whether a method is prone to that, we will compare root-mean-square deviations (RMSD) to average deviations, ADx, defined in eq 5b.
| 5b |
As far as the phonon frequencies are concerned, Figure 7(a) shows the calculated deviations relative to the DFT/D3-BJ reference data. Figure 7(b) contains the evolution of the cumulative RMSDf, i.e., the RMSDf as a function of the frequency up to which the summation in eq 5a has been performed. The “final” values for the entire low-frequency range (i.e., the values obtained when summing up to 9 THz) are shown in Table 2 together with the corresponding average deviations ADf. Consistent with the conclusions drawn from the band structures, in DFTB most modes experience shifts to higher energies by up to ∼1.5 THz, with the error increasing roughly linearly with frequency up to ∼4 THz. This causes a sharp rise of the associated RMSDf in that frequency region and a rather large positive value of the ADf. Conversely, the DFTB@DFT frequencies are generally too small (by up to ∼0.9 THz) resulting in a negative ADf. Below 2 THz, the corresponding cumulative RMSDf is even larger than for DFTB. The frequency differences of associated modes are significantly decreased by rescaling the unit cell (DFTB@95%DFT).
Table 2. Average Differences (ADx) and Root-Mean-Square Deviations (RMSDx of Phonon-Related Quantities) with Respect to the DFT Referencea.
| DFTB | DFTB@DFT | DFTB@95% DFT | COMPASS | MOF-FF | GAFF | ||
|---|---|---|---|---|---|---|---|
| frequencies | RMSDf/THz | 0.72 | 0.48 | 0.14 | 0.60 | 0.20 | 0.48 |
| (≤9 THz) | ADf/THz | 0.62 | –0.46 | –0.05 | 0.07 | –0.03 | 0.31 |
| frequencies | RMSDf/THz | 1.43 | 1.50 | 1.46 | 2.10 | 0.76 | 4.14 |
| (entire range) | ADf/THz | –0.55 | –0.84 | –0.73 | 0.17 | 0.06 | 1.10 |
| group velocities | RMSDvg/THzÅ | 5.2 | 3.3 | 3.8 | 5.8 | 3.6 | 4.1 |
| (≤9 THz) | ADvg/THzÅ | 3.8 | –0.9 | 1.2 | 3.3 | 1.6 | 1.7 |
| MSTD | RMSDu2/Å2 | 0.024 | 0.076 | 0.019 | 0.005 | 0.033 | 0.002 |
| (150 K) | ADu2/Å2 | –0.023 | 0.074 | –0.019 | –0.002 | 0.033 | 0.001 |
| MSTD | RMSDu2/Å2 | 0.048 | 0.152 | 0.039 | 0.009 | 0.066 | 0.004 |
| (300 K) | ADu2/Å2 | –0.046 | 0.147 | 0.037 | –0.004 | 0.066 | 0.003 |
x refers to frequencies (f), norm of the group velocity vectors (vg), and mean squared thermal displacements (MSTD). The listed values for frequencies and group velocities have been calculated from phonon modes sampled on a q-mesh in the 1BZ, as described in Section 2.4. The parameters for MSTDs are compared atom-wise to the reference.
Using the COMPASS FF, one tends to overestimate the intermolecular frequencies up to 4 THz and underestimates the frequencies of the two intramolecular bands around ∼6 THz. The majority of the modes can be found within ∼±1.5 THz around the reference. The RMSDf value continuously increases for the intermolecular modes and then experiences a step for the intramolecular vibrations due to their particularly bad description. The comparably small value of the ADf for the COMPASS force field is a clear indication for an error compensation between inter- and intramolecular modes (see below). With MOF-FF, the frequency spread can be reduced significantly to a level comparable to DFTB@95%DFT. This is also manifested in the evolution of the RMSDf (Figure 7(b)). Consistent with a particularly small value of the ADf, there is no systematic over- or underestimation of frequencies. In line with the observations for the band structures, phonon frequencies from the GAFF calculations perfectly fit the reference data up to ∼2.5 THz. This is also visible in Figure 7(b), where one sees that as far as the value of the RMSDf is concerned, GAFF outperforms MOF-FF in a spectral region of up to ∼3 THz. However, at higher frequencies, the evolution of the cumulative RMSDf suffers from an overestimation of phonon energies (between ∼3.0 THz and 4 THz and around 6 THz).
As a next step, we will analyze the phonon group velocities, where we will only consider their norms, disregarding the q-dependent directions of the vg vectors. Here, first insights can be gained from the density of group velocities (DOGV), i.e., the number of phonons with a given group velocity per unit vg interval. The DOGVs are shown in Figure 8. Although the overall trend in the DOGV is similar for all approximate methods and the DFT reference, the relative deviations are quite sizable especially for large group velocities. Their densities are massively overestimated by all methods apart from DFTB@DFT. Concomitantly, the densities at small group velocities are typically underestimated. A disadvantage of such a “density of group velocities” analysis is that it does not take into account for which mode a specific group velocity is calculated.
Figure 8.
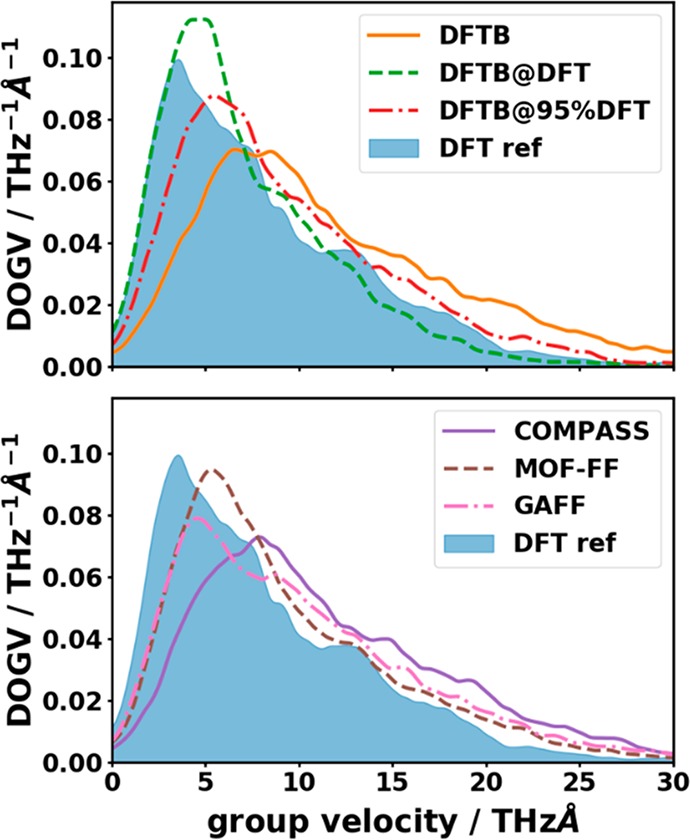
Density of group velocities (DOGV) as a function of the norms of the group velocity vectors. The DOGV has been calculated as a sum of Lorentzian peaks (fwhm = 1 THzÅ) centered at the group velocity of each low-frequency (≤9 THz) phonon mode on a discrete mesh normalized by the total number of considered modes. The shaded area represents the DFT reference.
Thus, we applied a similar statistical analysis as for the frequencies to the norms of the group velocities. This allows for quantitatively assessing the agreement in the band dispersions. The cumulative RMSDvg in the low-frequency regime is shown in Figure 9 together with the associated mode group velocities.
Figure 9.
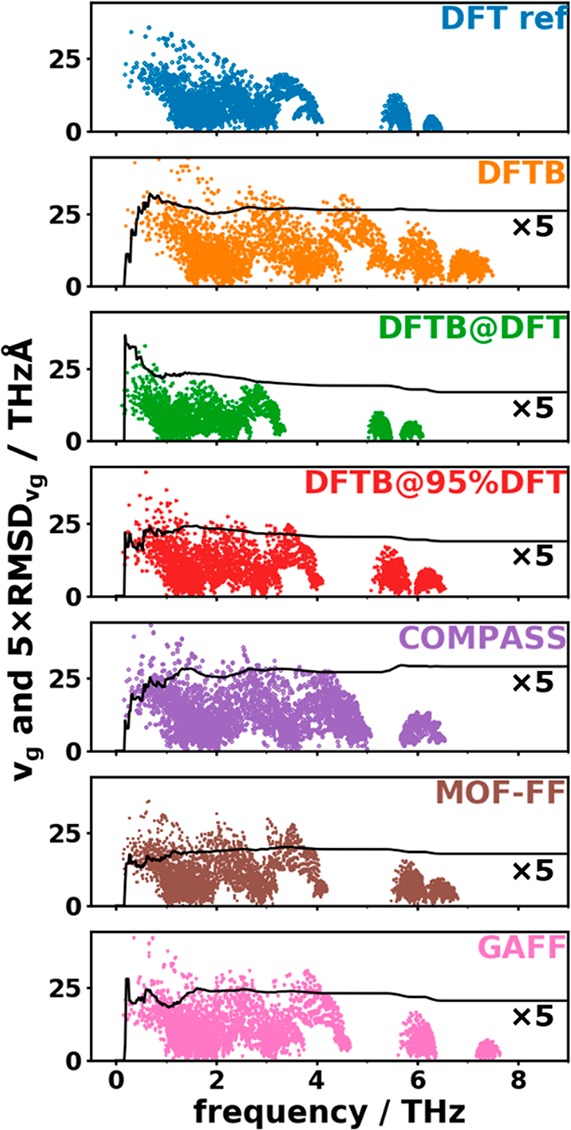
Group velocities of phonon modes on the discrete mesh described in section 2.4 as a function of its frequency. The solid black lines show the cumulative RMSDvg as a function of frequency. Note that, for the sake of comparison, the values of the RMSDvg have been multiplied by a factor of 5.
Here, the best agreement with the reference data for the entire low-frequency region is obtained for the DFTB@DFT calculations (lowest value of the cumulative RMSDvg at 9 THz–see also Table 2–consistent with the best matching DOGV in Figure 8). However, for this method the cumulative RMSDvg is particularly high in the region of the acoustic bands up to ∼2 THz, and this is the region most relevant when studying thermal transport. In that frequency region, MOF-FF displays the smallest deviations.
Overall, with the exception of the DFTB and DFTB@DFT approaches, the values of the RMSDvg do not change significantly between 1 THz and 9 THz indicating that there is no significant variation in the performance for the different optical bands. Moreover, with the exception of DFTB@DFT all methods have the tendency to overestimate the group velocities, as already inferred from the DOGVs. The comparison of the RMSDvg values and the absolute values of the group velocities in Figure 9 reveals that both quantities are of the same order of magnitude. Consequently, as far as group velocities are concerned, none of the approximate methodologies display a fully satisfactory performance.
3.2.5. Analyzing the Performance of Approximate Methods for Describing Observables Derived from the Phonon Band Structures
As indicated in Figure 2 in Section 3.1, several physical observables nearly exclusively depend on the low-frequency modes. Therefore, in the following we will analyze how these observables are impacted by the deviations in the phonon band structures between approximate methods and the DFT/D3-BJ reference data. The first of these observables is the mean squared thermal displacement (MSTD) of the atoms (see eq 2a in Section 3.1). It provides a measure of the average fluctuation in the atomic positions due to the thermal motion of the atoms. The good ability of the DFT/D3-BJ approach to reproduce the experimentally observed thermal displacements for several organic crystals including naphthalene has already been pointed out by George et al.83Figure 10(a) shows that the values of ⟨||uj||2⟩ somewhat vary for the chemically inequivalent carbon atoms. The same occurs for inequivalent hydrogens, for which due to their smaller mass the ⟨||uj||2⟩ are on average larger by ∼70%.
Figure 10.
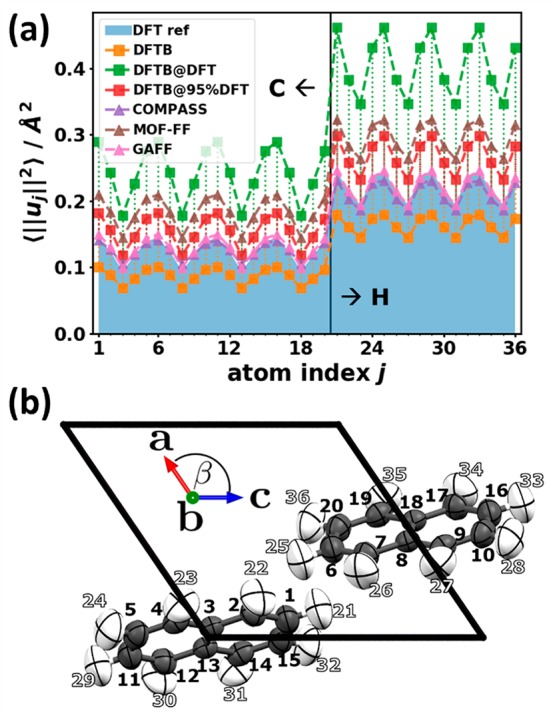
(a) Atom-resolved mean squared thermal displacements (MSTDs) ⟨||uj||2⟩ at 300 K. The shaded area represents the DFT reference. Vertical dashed lines and the lines connecting the MSTDs are guides to the eye to emphasize the difference with respect to the reference. (b) Atom labeling scheme in the naphthalene unit cell. In order to be able to graphically represent the thermal atomic motion, in crystallography one uses spatial Gaussian probability distributions with the MSTD being related to the covariance matrices. One then connects the points in space that lie on a chosen probability level to draw the thermal ellipsoids.85 Here, the thermal ellipsoids are plotted with Mercury(86) for the 75% probability level (i.e., the probability for finding the atoms within the ellipsoids is 75%).
As far as the performance of the approximate methods is concerned, Figure 10(a) shows that by far the best agreement with the DFT/D3-BJ reference is obtained for the COMPASS and GAFF force fields. This is confirmed by the particularly small values for the RMSDu2 listed in Table 2. The DFTB approach underestimates the mean squared thermal displacements (resulting in a negative value of the ADu2), while DFTB@95%DFT, MOF-FF, and DFTB@DFT increasingly overestimate them (in line with an increasingly positive value of the ADu2). This overestimation can become rather large such that the ⟨||uj||2⟩ values for DFTB@DFT become roughly twice as large as the DFT/D3-BJ values. To understand that, one has to realize that the quality of the description of the ⟨||uj||2⟩ directly correlates with the quality of the description of the acoustic phonons: One reason for that is that at a given temperature these phonons display the highest occupation numbers n(ω,T). Additionally, the contributions of individual phonon modes to the ⟨||uj||2⟩ are scaled with a factor of 1/ω (cf. eqs 2a and 2b in Section 3.1). That scaling can be rationalized based on a comparison between a classic and a quantum-mechanical harmonic oscillator, as detailed, for example, in ref (84).
Thus, the excellent performance of the COMPASS and GAFF force fields (Figure 10a) can be traced back to the perfect match of the corresponding onsets of the DOSs in the region of the acoustic phonons with the reference data (see Figure 6). The significant underestimation of the DOS in the acoustic region for DFTB (due to an overestimation of the frequencies of the acoustic phonons; see Figure 5) results in a significant drop in the equilibrium occupation of the acoustic phonons. This causes the significant decrease of ⟨||uj||2⟩. Conversely, for DFTB@95%DFT, MOF-FF, and DFTB@DFT, the frequencies of the acoustic phonons are underestimated such that their equilibrium occupation becomes too high, causing the overestimation of the thermal displacements. As far as the temperature dependence of the absolute deviations in the ⟨||uj||2⟩ is concerned, one sees that they approximately double upon increasing the temperature from 150 to 300 K (Table 2), while the relative deviations stay approximately the same.
Another relevant thermodynamic quantity that can be directly calculated from the phonon bands is the phonon heat capacity CV. As described in eq 3a in Section 3.1, CV can be calculated by integrating the DOS multiplied by a temperature-dependent low pass-like envelope function fC. Thus, for very low temperatures only the low-frequency part of the DOS is considered in the determination of the heat capacity. In fact, as discussed in Section 3.1, at a temperature of ∼150 K, the envelope function reaches half the value of its maximum for a frequency of 9 THz. Thus, Figure 11(a), shows the temperature dependence of the heat capacity (per unit cell) up to that temperature, normalized by its value in the classical limit given by the Dulong Petit law (3NkB, with 3N being the number of degrees of freedom per unit cell). To more easily judge the performance of the different approaches, Figure 11(b) explicitly shows the deviations from the DFT-calculated reference values.
Figure 11.
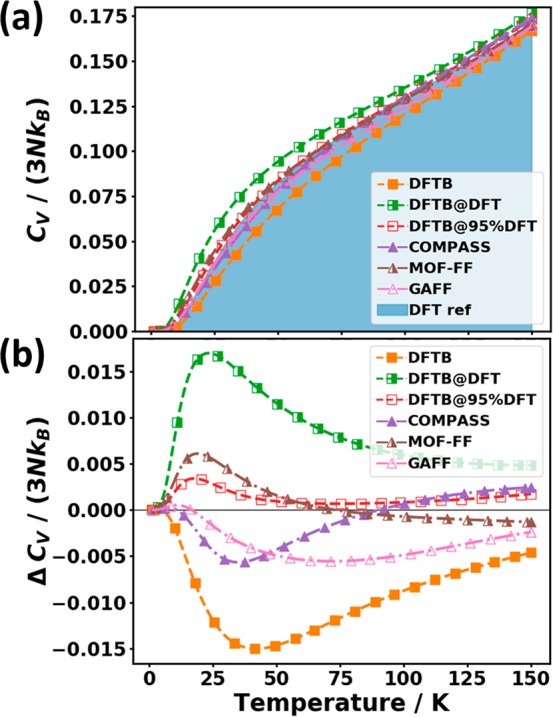
(a) Phonon heat capacity CV normalized by the number of degrees of freedom 3N and the Boltzmann constant kB as a function of temperature for the tested approaches. The shaded area represents the DFT reference. (b) Difference in heat capacity relative to the reference data. The symbols do not represent the actually calculated data points (these lie much more densely) but rather serve as guides to the eye.
In all approaches, the deviations are largest for temperatures below ∼75 K. Consistent with the trends already observed for the ⟨||uj||2⟩, DFTB underestimates the heat capacity in the entire displayed temperature range. Similarly, GAFF and COMPASS, which displayed the best performance for the ⟨||uj||2⟩, show also the smallest deviations for CV but only up to temperatures around 15 K. The reason why for CV (in contrast to ⟨||uj||2⟩) the performance of these force fields deteriorates already at rather small temperatures lies in the different shapes of the “low-pass filters” fC (determining the heat capacity; cf. eq 3b) and fD (determining the mean squared thermal displacements; cf. eq 2b). As shown in Figure 2, for a given temperature, fC extends to much higher frequencies than fD. This can be rationalized by higher-energy phonons carrying more energy and, thus, also contributing more strongly to the heat capacity provided that the corresponding states are occupied. At even higher temperatures, the trend in the error of CV is reversed, especially in the case of COMPASS, due to the severe underestimation of the frequencies of the lowest lying intramolecular phonons (see Figure 7). This results in a partial error compensation, which is also apparent from the very small value of the ADf for COMPASS (see Table 2). Consequently, that force field displays a rather good apparent performance in the entire considered temperature range.
For DFTB@95%DFT and MOF-FF the comparably small differences in CV relative to the reference can be traced back to the generally rather accurate description of the phonon frequencies in the entire low-frequency range, again with some error cancellations between overestimated and underestimated phonon frequencies. The strongest deviations from the reference are observed for DFTB and DFTB@DFT, where DFTB seriously underestimates CV, while DFTB@DFT overestimates it. This is consistent with the above-discussed rather severe overestimation (underestimation) of the phonon frequencies by DFTB (DFTB@DFT). Overall, the maximum relative errors of CV reach up to 20% at ∼45 K in DFTB and even up to 43% at ∼25 K in DFTB@DFT. The absolute errors are, however, still rather small (∼1.6% of the saturation value) because at 150 K the heat capacity has reached only ∼17% of its saturation value. Note that the latter is (hypothetically) approached only above ∼3500 K (i.e., far above the melting temperature of naphthalene at 353 K87). This can be explained by the high-frequency C–H stretching vibrations (above 90 THz) requiring high temperatures to be covered by the envelope function fC (see the Supporting Information).
3.3. Phonons in the High-Frequency Regime (Vibrations above 9 THz)
The above discussion of the heat capacity already suggests that for certain thermodynamic quantities also higher frequency vibrations are particularly relevant. This, for example, applies to heat capacities at elevated temperatures or to the relative stability of different phases (i.e., the corresponding free energies). Also the nature of the modes at higher frequencies changes fundamentally, as the modes above ∼4.1 THz (in the DFT/D3-BJ reference) are mostly intramolecular in nature. Thus, for their description an accurate modeling of bonding interatomic interactions is crucial, while for the lowest-frequency vibrations primarily nonbonding intermolecular interactions counted (see above). Thus, the trends discussed in the following as well as the relative performance of the different methods will not necessarily correlate with the observations discussed in Section 3.2.
3.3.1. Comparison to Experiment
Unfortunately, no experimental data on the phonon band structures are available for frequencies above 4 THz. Therefore, for benchmarking the theoretical methodology in the high-frequency region, we have to resort to a comparison with results from vibrational spectroscopy (i.e., restrict the comparison to Γ-point frequencies only). Figure 3 compares the simulated and measured Raman spectra of naphthalene for frequencies up to 60 THz. The excellent agreement suggests that the DFT/D3-BJ calculations can serve as a viable reference for the entire frequency region. Notably, the very good agreement is observed not only for the simulations of the crystal but also for the isolated molecules provided that the same functional is employed. This is another indication for the mostly intramolecular character of the vibrations at higher frequencies. Consequently, the impact of the type of applied van der Waals correction is only minor (see the Supporting Information). In passing we note that in contrast to that the used functional plays a more significant role, where tests employing the hybrid functional B3LYP88,89 (instead of PBE) yield an overestimation of the frequencies and, thus, a worse agreement with experiments (see the Supporting Information).
3.3.2. Comparison of Phonon Properties at Higher Frequencies
A plot comparing the DOSs calculated with all applied methods is shown in Figure 12 for the entire frequency range. In that figure, several observations can be made: (i) the DFTB-based approaches yield rather similar phonon DOSs above 9 THz independent of the choice of the unit-cell size. This is again consistent with the intramolecular nature of the higher-frequency vibrations. (ii) The lower edge of the large band gap (∼49–92 THz) in the DFTB approaches agrees very well with the DFT/D3-BJ reference. Conversely, COMPASS overestimates the frequencies of these vibrations with the effect being even intensified in GAFF. In contrast, MOF-FF somewhat underestimates the corresponding frequencies. (iii) The C–H stretching modes (high-frequency modes above 90 THz) are described rather poorly in most approaches: DFTB and GAFF significantly underestimate those frequencies. The error decreases for COMPASS. Notably, MOF-FF is the only approximate approach that yields a satisfactory agreement with the reference for these modes, albeit with a somewhat increased frequency-splitting of the symmetry-inequivalent vibrations.
Figure 12.
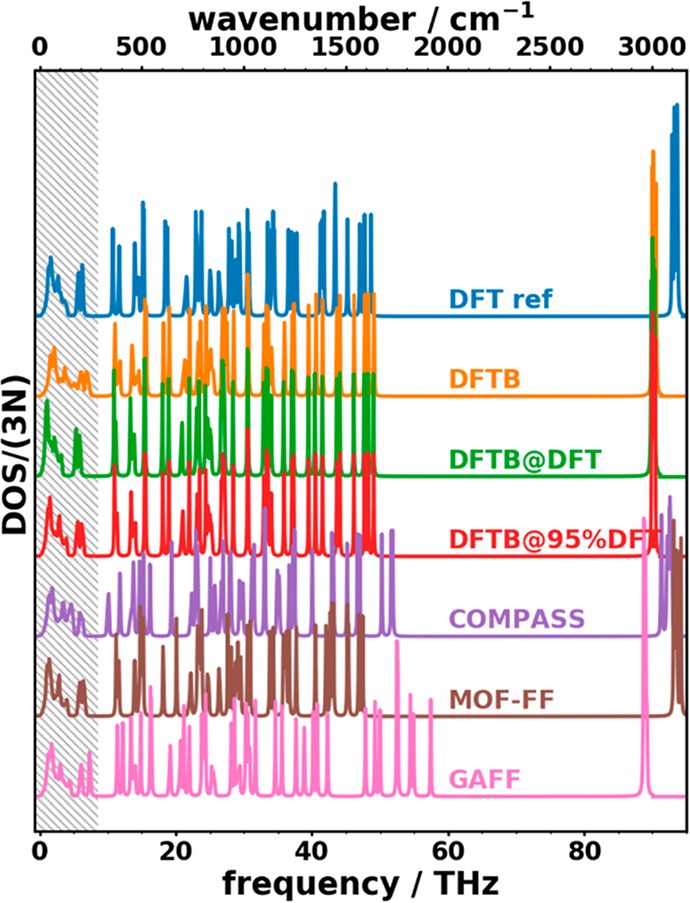
Phonon densities of states as a function of phonon frequency of crystalline naphthalene for the approaches tested in the current study. The hatched area highlights the low-frequency regime discussed in Section 3.2.
A shortcoming of comparing DOSs is that it provides only information on the frequency ranges in which vibrations exist but fails in assessing the actual nature of these vibrations. To account for that, we again use the (complex) dot product between phonon eigenvectors of different simulation approaches to identify the most similar pairs of phonon modes employing the algorithm of Kuhn82 (see Section 3.2.4 and the Supporting Information).
A typical outcome of such an analysis is shown in Figure 13 for (a) MOF-FF and (b) GAFF. In MOF-FF the result is rather encouraging, with the eigenvectors of the ith mode in MOF-FF mostly corresponding to the ith mode in the DFT/D3-BJ reference. I.e., especially for the first ∼70 modes the order of the phonon energies is largely preserved, and most MOF-FF modes can be unambiguously associated with a DFT/D3-BJ reference mode. Also the DFTB-based approaches perform rather well in this comparison (see the Supporting Information). The good correspondence between approximate modes and reference modes is lost especially for GAFF [see Figure 13(b); with a similar result also for COMPASS; see the Supporting Information], where starting from the ∼20th band, a number of off-diagonal elements of significant magnitude occur. Finally, it should be mentioned that we observe even more significant off-diagonal overlap matrix elements for wavevectors different from Γ, but a detailed analysis of this goes beyond the scope of the current article.
Figure 13.
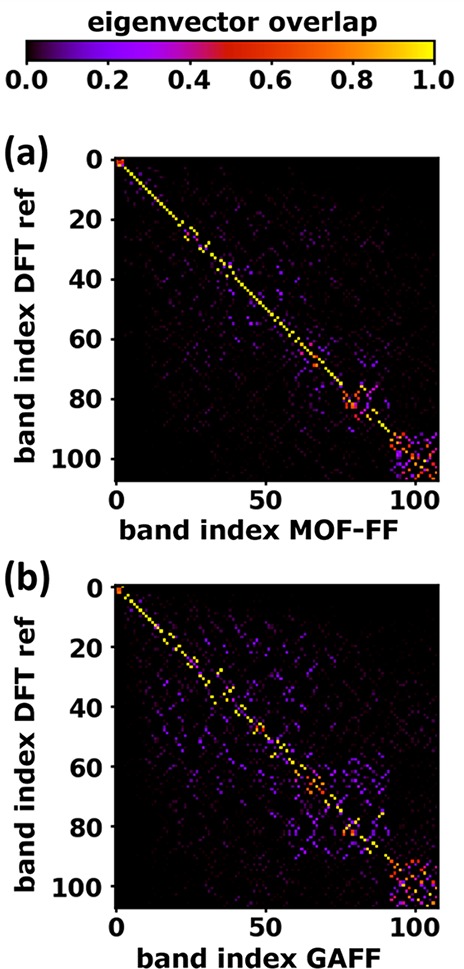
Overlap matrix of Γ-point eigenvectors of the reference calculation (DFT/D3-BJ) with (a) MOF-FF and (b) GAFF. The overlap matrix Sij is defined as the complex dot product of the ith eigenvector of the reference calculation and the jth eigenvector of the compared calculation.
Based on this mode assignment, it is again useful to analyze frequency differences (in analogy to Figure 7) in terms of the RMSDf values and average frequency differences ADf. The frequency differences with respect to DFT/D3-BJ and the cumulative RMSDf values are shown in Figure 14. Additionally, Table 2 contains the root-mean-square deviations and the average deviations calculated over the entire frequency range.
Figure 14.
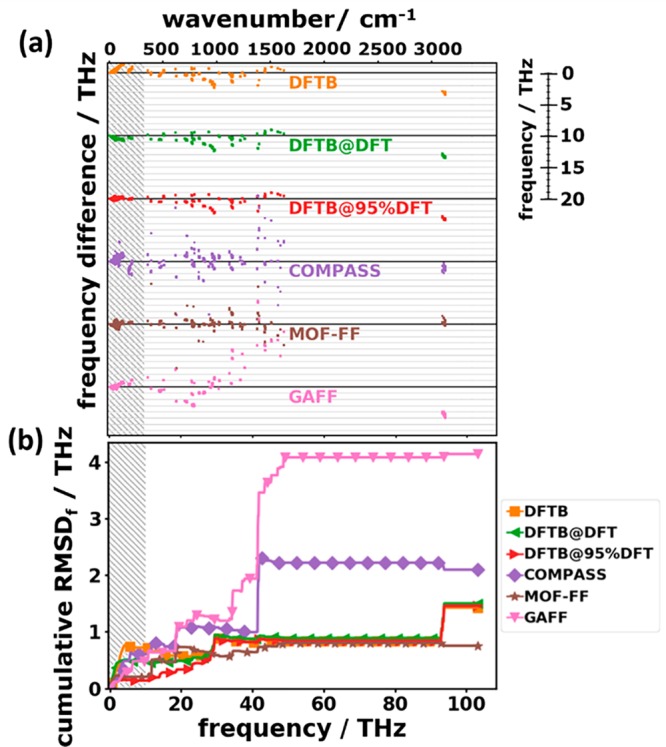
(a) Frequency differences with respect to the reference data (DFT/D3-BJ) for the tested approaches as a function of the reference frequency for the entire phonon spectrum. Each approach has its own zero line (thick black horizontal lines). (b) Cumulative RMSDf of frequencies up to a certain cutoff frequency as a function of that cutoff frequency. The hatched area highlights the low-frequency regime discussed in Section 3.2. The symbols in (b) do not represent the actually calculated data points (these lie much more densely) but rather serve as guides to the eye.
Figure 14(a) shows that in all cases the observed frequency differences of equivalent modes are much larger than in the low-frequency region. Especially COMPASS and GAFF have massive problems above ∼20 THz with large frequency deviations of varying sign, which for some modes amount to more than 10 THz. This results in a steep increase in the RMSDf for these methods at ∼20 THz. The situation deteriorates further for frequencies higher than ∼40 THz, where GAFF yields a pronounced overestimation of most phonon frequencies, especially between 35 THz and 50 THz. This can be attributed to harmonic force constants for C–C interactions that are much larger in GAFF than in the DFT/D3-BJ reference (see the Supporting Information). Part of the deviations can also be attributed to the neglect of cross terms in the force field. For COMPASS, too high and too low frequencies are rather equally distributed, resulting in a comparably small value of the ADf, as listed in Table 2. An analysis of the displacement patterns reveals that the most affected modes correspond to C–C stretching and C–H in-plane bending motions, whose frequencies often show differences of more than 5 THz, sometimes up to 15 THz. A possible explanation for the poor performance of COMPASS despite the rather complex nature of the force field could be the fact that in this approach all atoms of a given chemical species are treated equally, which does not very well reflect the actual situation.
MOF-FF outperforms the other force-field-based approaches in essentially the entire frequency range with the lowest cumulative RMSDf values of all tested approaches for frequencies above 30 THz. This is not entirely unexpected, considering that MOF-FF has been specifically parametrized to describe the bonding-type interactions of naphthalene (see Section 2.3), which results in harmonic force constants for the C–C interactions that compare well with the DFT/D3-BJ data (see the Supporting Information). Similar to the COMPASS case, there is no systematic over- or underestimation of phonon frequencies.
Outside the low-frequency region, all DFTB-based approaches display a tendency to under- rather than to overestimate vibrational frequencies, resulting in negative values of the ADf. For a rather wide spectral range, the DFTB-based results feature an agreement to the reference data as good as MOF-FF. Only around 90 THz the situation deteriorates resulting in nearly twice as high overall RMSDf values. This is a consequence of the particularly poor description of the C–H stretching vibrations with errors as large as −3 THz, which can be traced back to a pronounced underestimation of the C–H harmonic force constants (see the Supporting Information).
3.3.3. Analyzing the Performance of Approximate Methods for Describing Observables Derived from the Entire Phonon Spectrum
Base on the above-discussed trends for the calculated phonon frequencies, an analysis of derived thermodynamic properties can be performed. Regarding the evolution of the heat capacity at temperatures beyond those considered already in Section 3.2.5, Figure 2(b) reveals that at 300 K, the width at half-maximum of the low-pass envelope function fC approaches 20 THz [f1/2(300 K) ≈ 18.3 THz], while its tail reaches well beyond 40 THz. Therefore, the frequency differences at higher frequencies that have been discussed in the previous section become increasingly important for CV at higher temperatures: for GAFF, the overestimation of the phonon frequencies between 30 THz and 50 THz results in a distinct underestimation of the heat capacity beyond 200 K, as shown by the negative values of the errors in the heat capacity, ΔCV, in Figure 15. In contrast, ΔCV remains rather small for COMPASS owing to the fortuitous cancellation of errors that also leads to the virtually vanishing value of the ADf (see above). MOF-FF displays an excellent performance over essentially the entire frequency range, as here both the RMSDf as well as the ADf adopt very small values. For the DFTB-based approaches, the tendency to mostly underestimate phonon frequencies above ∼10 THz results in values of ΔCV becoming increasingly positive, where the absolute value of the deviation depends on whether the low-frequency modes have been over- (DFTB) or also underestimated (DFTB@DFT). Consequently, for DFTB the errors partially cancel, while for DFTB@DFT they add up.
Figure 15.
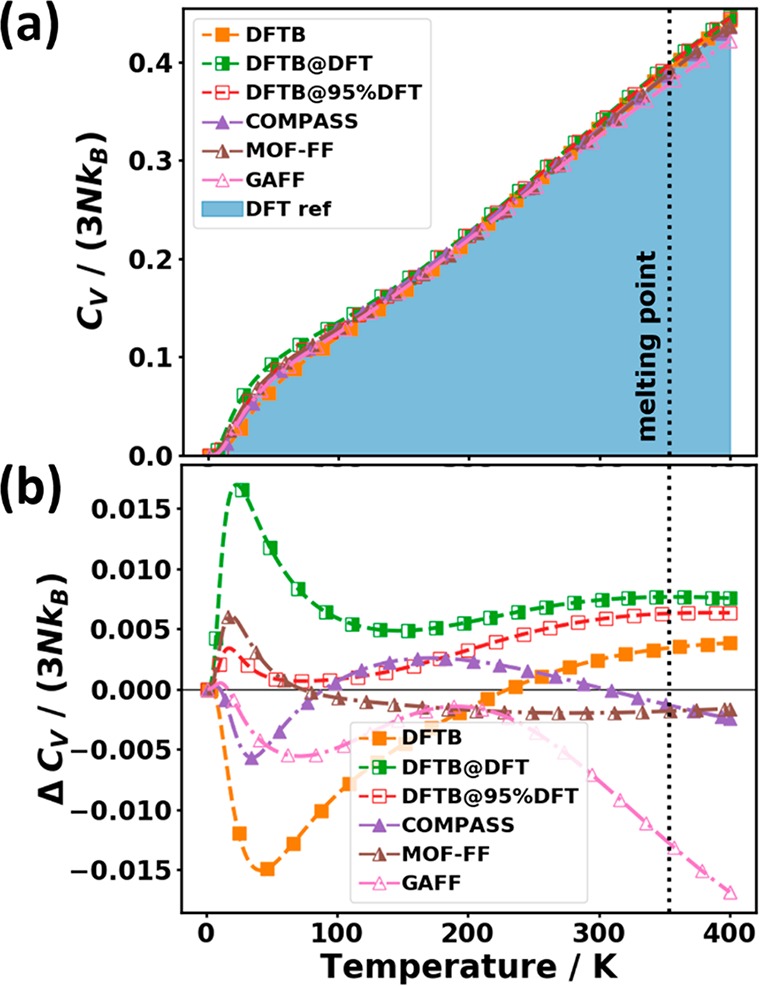
(a) Phonon heat capacity CV normalized by the number of degrees of freedom 3N and the Boltzmann constant kB as a function of temperature for the tested approaches over a wider temperature range. The shaded area represents the DFT reference. (b) Difference in heat capacity relative to the reference data. The melting point of the system is indicated by the vertical dotted line.87 The symbols do not represent the actually calculated data points (these lie much more densely) but rather serve as guides to the eye.
In spite of the deviations discussed above, it should be mentioned that overall the heat capacity is a rather robust quantity with the relative error at 300 K in none of the cases exceeding 0.5%.
Another important thermodynamic quantity impacted by all phonons is the Helmholtz free energy. It is the thermodynamic potential for canonical ensembles and is, thus, relevant for thermodynamic stability considerations. The analytic expression73 for the vibrational free energy, F, per unit cell is shown in eq 6
| 6 |
where the first term is a sum over free energy contributions per mode λ (characterized by the band index n and the sampled wave vectors q), and the second term is the zero-point energy of the harmonic oscillators, defining the free energy at 0 K. Nq denotes the number of wavevectors over which the sampling of the Brillouin zone is carried out. As the zero-point energy contains all harmonic oscillator energies independent of their occupation, the errors in all frequency ranges equally contribute to that quantity. This implies that for the free energy an accurate description of phonons with high frequencies is of distinct relevance, especially at low temperatures, where the zero-point energy dominates. When the temperature increases, the occupation of modes becomes increasingly important, such that then low-frequency modes more strongly impact the temperature dependence of F.
Figure 16(a) compares the temperature-dependence of the free energy for all tested approaches. The differences in free energy with respect to the reference calculation are plotted in Figure 16(b). Close to 0 K, one can see that MOF-FF and COMPASS are in closest agreement with the reference. All the DFTB-based approaches yield too small and GAFF too large zero-point energies. This is in agreement with the ADf values listed in Table 2. COMPASS fares rather well due to the compensation of errors discussed already in the context of the heat capacity. As far as the absolute magnitude of the error of the free energy is concerned, it can increase beyond 0.25 eV. This value is sizable (amounting to ∼10 kBT at room temperature) and can exceed the energetic differences between different polymorphs typically described in the literature.14
Figure 16.
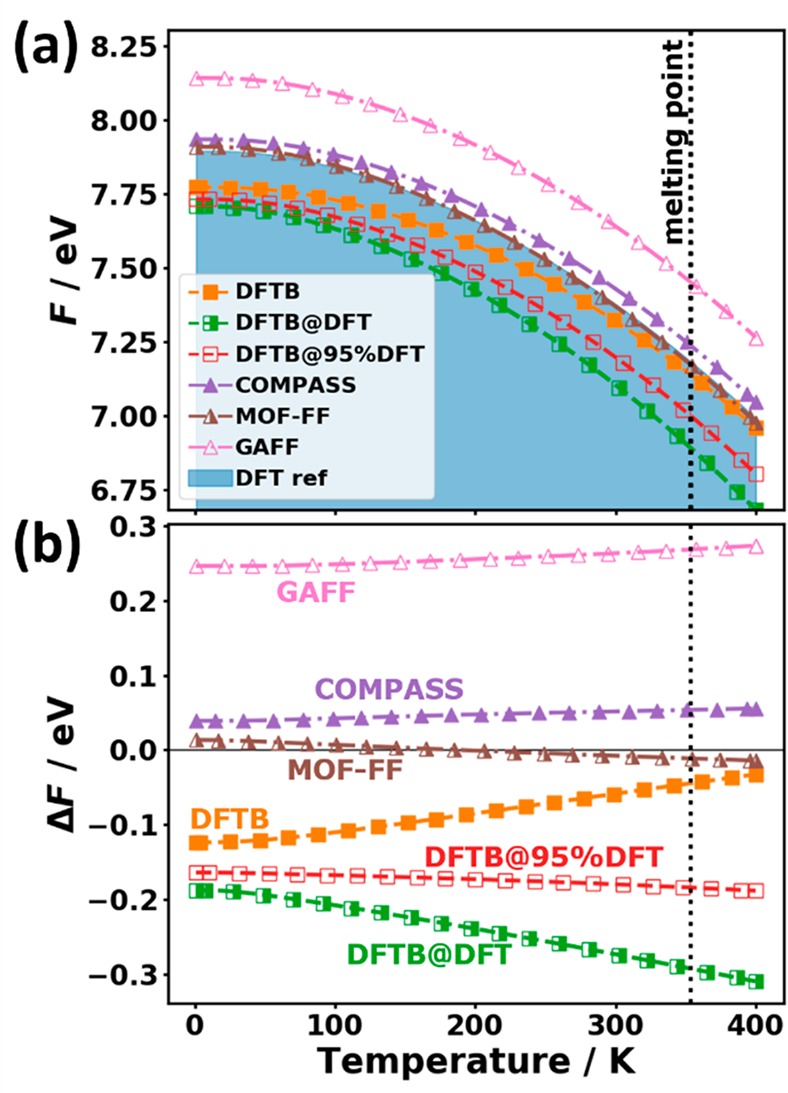
(a) Vibrational free energy and (b) difference of free energy relative to the reference calculations as a function of temperature. The melting point of the system is indicated by the vertical dotted line.87 The symbols do not represent the actually calculated data points (these lie much more densely) but rather serve as guides to the eye.
Interestingly, for all force fields the deviations from the reference rather weakly depend on temperature. This also applies to DFTB@95%DFT, which can be attributed to the rather favorable description of the low-frequency modes by this approach (see Section 3.2.2). The situation changes for DFTB and DFTB@DFT. In the former case, the absolute magnitude of the deviation decreases with temperature. This can be explained by the fact that the error in the zero-point energy arises from the predominant underestimation of phonon frequencies when considering the entire frequency range. At higher temperatures, this is increasingly compensated by the overestimation of the energy of the then occupied low-frequency phonons. In contrast, for DFTB@DFT the errors due to the zero-point energy and due to the contribution of low-frequency phonons add up.
4. Summary and Conclusion
To provide a concise summary of the many aspects discussed above, Figure 17 compares the relative performance of the different approaches for the main quantities of interest. These comprise the frequencies, the group velocities, the mean squared thermal displacements, the heat capacities, and the free energies. For the quantities for which a statistical analysis is useful, the comparison primarily relies on the root-mean-square deviations. Only for the frequencies, as the “basic quantities”, it also considers the average deviations to get an impression for which methods cancellations of errors could occur (especially when calculating heat capacities or free energies). The comparison of computational methods comprises density-functional tight-binding-based and force-field-type approaches, which are benchmarked against dispersion-corrected DFT results. For the latter an excellent agreement with measured phonon band structures and Raman spectra can be obtained, provided that a suitable a posteriori van der Waals correction is used. As far as that correction is concerned, we observe that the D3-BJ correction clearly outperforms the TS and D2 approaches.
Figure 17.
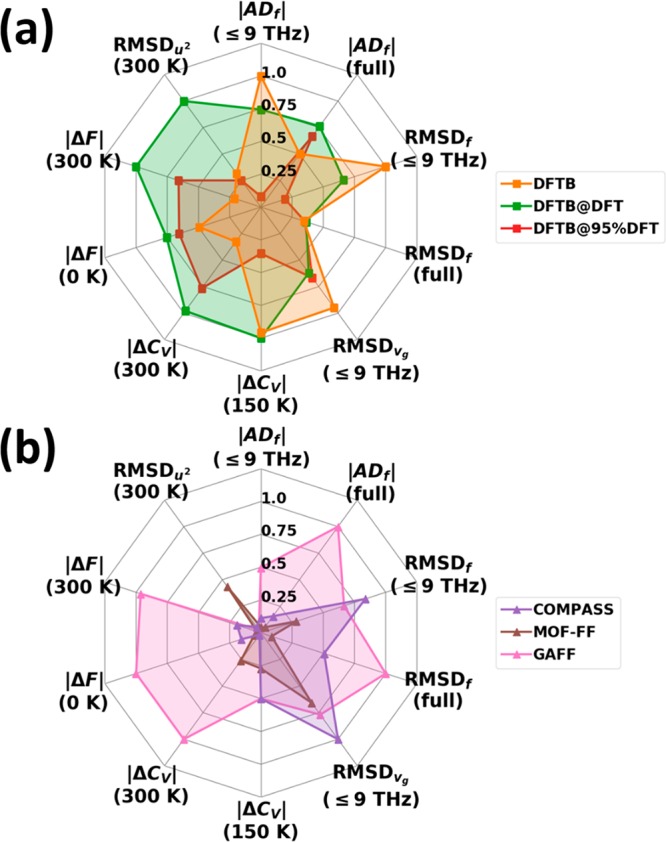
Radar charts summarizing the performance of (a) DFTB- and (b) FF-based methodologies with respect to the reference calculations. The category axes are normalized such that 1 corresponds to the maximum observed error indicator among all approaches. The compared quantities comprise the average deviations in the calculated frequencies with respect to the DFT/D3-BJ reference, ADf, for the low-frequency region (≤9 THz) and the full spectral range (full) and the root-mean-square deviations of frequencies (RMSDf) for the low-frequency region (≤9 THz) and the full spectral range (full). Additionally, the graphs show the RMSD value of norms of group velocity vectors stemming from phonon modes in the low-frequency region (RMSDvg) and the absolute differences in thermodynamic properties (vibrational free energy F and heat capacity CV) at various temperatures. Finally, the root-mean-square deviations of mean squared thermal displacements (RMSDu2) are shown, which are calculated as the average (quadratic) deviation of thermal displacements summed over all atoms in the unit cell.
Among the approximate methodologies, the tested system-specifically parametrized second-generation force field (MOF-FF) displays clearly the best overall performance. Only in terms of the accuracy of the mean squared thermal displacements it is outperformed by the GAFF and COMPASS force fields, owing to their particularly accurate description of the acoustic phonons. This suggests that a strategy for the further improvement of MOF-FF could lie in modifying the way van der Waals interactions are described in that force field (see Section 2.3). The COMPASS force field fares rather well also in the calculation of heat capacities and free energies in spite of the rather large root-mean-square deviations for the calculated frequencies. This is a consequence of error cancellations, as COMPASS does not yield a general trend regarding an over- or underestimation of frequencies. In contrast, GAFF rather overestimates frequencies with the effect being particularly pronounced in the intermediate frequency range for intramolecular vibrations (see Figure 14). This results in the tendency to underestimate the heat capacity (as modes become occupied only at higher temperatures). Consistently, GAFF overestimates free energies in the entire spectral range. The DFTB-based approaches (relying on “off-the-shelf” Slater-Koster files), despite the considerably increased computational cost, typically perform worse than the force fields, especially worse than MOF-FF. The only exception is the rather accurate description of phonon frequencies in the low-frequency region in the case of DFTB@95%DFT, which can be attributed to the tuning of the unit-cell size in this approach. The tendency of the DFTB-based approaches to rather underestimate frequencies of intramolecular vibrations results in a distinct underestimation of the zero-point energy. For the free energy at room temperature, DFTB benefits from error cancellations due to an overestimation of the frequencies of the increasingly occupied phonons in the low-frequency region.
Notably, Figure 17 shows relative deviations, i.e., deviations compared to the worst performing methodology. Thus, it is also worthwhile to separately address the general performance of the approximate methodologies for the different phonon-related quantities of interest: for example, the description of the heat capacity is rather satisfactory for all approaches, not exceeding 0.5% at room temperature even for the worst performing method. The errors for the free energy are larger, reaching ∼3% for several of the applied methodologies. At room temperature, they can reach up to ∼10 kBT per unit cell, exceeding commonly observed energy differences between different organic polymorphs.10,12−14 In this context it should be noted that especially MOF-FF with its comparably accurate description of phonon frequencies does not show this problem and yields free energies within ∼±0.01 eV compared to the PBE/D3-BJ values over a wide temperature range. The observables most sensitive to the applied methodology are the mean squared thermal displacements, which are overestimated by a factor of 2 by the DFTB@DFT calculations and for which only the COMPASS and GAFF force fields display a satisfactory performance. This quantity is primarily determined by the properties of the acoustic phonons, whose frequencies are so low that even minor absolute errors of the calculated frequencies result in major relative errors and, thus, an incorrect description of the thermal motion of the atoms.
These considerations show that approximate methodologies for describing phonon bands in organic semiconductors are promising for the description of phonon-related properties in molecular crystals at affordable computational cost. Especially, system-specifically parametrized force fields have a high potential. Nevertheless, there is still quite some room for improvements, where our results suggest that especially advancing the description of the van der Waals interactions in the tested system-specific force field should be a promising avenue. As far as DFTB-based approaches are concerned, the presented data indicate that for an accurate description of phonon properties, a dedicated reparametrization of Slater-Koster files might be advisible.
Acknowledgments
T.K., S.W., and E.Z. acknowledge the Graz University of Technology for financial support through the Lead Project (LP-03) and the use of HPC resources provided by the ZID. The computational results have been in part achieved using the Vienna Scientific Cluster (VSC3). H.K. acknowledges the financial support through the JST CREST (Grant Number JPMJCR18I3), Japan, and the kind support by Prof. M. Nakamura at the Nara Institute of Science and Technology (NAIST), Japan. N.B. gratefully acknowledges financial support under the COMET program within the K2 Center “Integrated Computational Material, Process, and Product Engineering (IC-MPPE)” (Project No. 859480). This program is supported by the Austrian Federal Ministries for Transport, Innovation, and Technology (BMVIT) and for Digital and Economic Affairs (BMDW), represented by the Austrian research funding association (FFG), and the federal states of Styria, Upper Austria, and Tyrol. This work has been partially funded by the Austrian Climate and Energy Fund (KLIEN) and the Austrian Research Promotion Agency (FFG) in the course through the “ThermOLED” project (FFG No. 848905). J.P.D. and R.S. acknowledge financial support from the Deutsche Forschungsgemeinschaft (DFG, Grants: SCHM 1389/10-1 within FOR 2433 and SCHM 1389/8-1).
Glossary
Abbreviations
- 1BZ
first Brillouin zone
- RMSD
root-mean-square deviation
- AD
average difference
- DFT
density functional theory
- DFTB
density functional tight binding
- FF
force field
- MBD
many-body dispersion
- DOS
density of states
- DOGV
density of group velocities
- vdW
van der Waals
- MSTD
mean squared thermal displacement
- fwhm
full width at half-maximum
Supporting Information Available
The Supporting Information is available free of charge at https://pubs.acs.org/doi/10.1021/acs.jctc.0c00119.
Further computational details including link to input files and raw data, effect of numerical parameters, methodology to simulate Raman spectra, FF parameters for our parametrization of MOF-FF, further comparisons to experimental data including tests employing MBD correction for Γ-phonons, assignment procedure of phonon modes, analysis of harmonic force constants, and thermodynamic properties at very high temperatures (PDF)
The authors declare no competing financial interest.
Supplementary Material
References
- Coropceanu V.; Cornil J.; da Silva Filho D. A.; Olivier Y.; Silbey R.; Brédas J.-L. Charge Transport in Organic Semiconductors. Chem. Rev. 2007, 107, 926–952. 10.1021/cr050140x. [DOI] [PubMed] [Google Scholar]
- Karl N. Charge Carrier Transport in Organic Semiconductors. Synth. Met. 2003, 133-134, 649–657. 10.1016/S0379-6779(02)00398-3. [DOI] [Google Scholar]
- Schweicher G.; D’Avino G.; Ruggiero M. T.; Harkin D. J.; Broch K.; Venkateshvaran D.; Liu G.; Richard A.; Ruzie C.; Armstrong J.; et al. Chasing the “killer” Phonon Mode for the Rational Design of Low Disorder, High Mobility Molecular Semiconductors. Adv. Mater. 2019, 31, 1902407. 10.1002/adma.201902407. [DOI] [PubMed] [Google Scholar]
- Tessler N.; Preezant Y.; Rappaport N.; Roichman Y. Charge Transport in Disordered Organic Materials and Its Relevance to Thin-Film Devices: A Tutorial Review. Adv. Mater. 2009, 21, 2741–2761. 10.1002/adma.200803541. [DOI] [Google Scholar]
- Fratini S.; Mayou D.; Ciuchi S. The Transient Localization Scenario for Charge Transport in Crystalline Organic Materials. Adv. Funct. Mater. 2016, 26, 2292–2315. 10.1002/adfm.201502386. [DOI] [Google Scholar]
- Oberhofer H.; Reuter K.; Blumberger J. Charge Transport in Molecular Materials: An Assessment of Computational Methods. Chem. Rev. 2017, 117, 10319–10357. 10.1021/acs.chemrev.7b00086. [DOI] [PubMed] [Google Scholar]
- Wang D.; Tang L.; Long M.; Shuai Z. Anisotropic Thermal Transport in Organic Molecular Crystals from Nonequilibrium Molecular Dynamics Simulations. J. Phys. Chem. C 2011, 115, 5940–5946. 10.1021/jp108739c. [DOI] [Google Scholar]
- Zhang Y.; Heo Y. J.; Park M.; Park S. J. Recent Advances in Organic Thermoelectric Materials: Principle Mechanisms and Emerging Carbon-Based Green Energy Materials. Polymers (Basel, Switz.) 2019, 11, 167. 10.3390/polym11010167. [DOI] [PMC free article] [PubMed] [Google Scholar]
- Russ B.; Glaudell A.; Urban J. J.; Chabinyc M. L.; Segalman R. A. Organic Thermoelectric Materials for Energy Harvesting and Temperature Control. Nat. Rev. Mater. 2016, 1, 16050. 10.1038/natrevmats.2016.50. [DOI] [Google Scholar]
- Nyman J.; Day G. M. Static and Lattice Vibrational Energy Differences between Polymorphs. CrystEngComm 2015, 17, 5154–5165. 10.1039/C5CE00045A. [DOI] [Google Scholar]
- Butler K. T.; Svane K.; Kieslich G.; Cheetham A. K.; Walsh A. Microscopic Origin of Entropy-Driven Polymorphism in Hybrid Organic-Inorganic Perovskite Materials. Phys. Rev. B: Condens. Matter Mater. Phys. 2016, 94, 180103R. 10.1103/PhysRevB.94.180103. [DOI] [Google Scholar]
- Nyman J.; Pundyke O. S.; Day G. M. Accurate Force Fields and Methods for Modelling Organic Molecular Crystals at Finite Temperatures. Phys. Chem. Chem. Phys. 2016, 18, 15828–15837. 10.1039/C6CP02261H. [DOI] [PubMed] [Google Scholar]
- van Eijck B. P. Ab Initio Crystal Structure Predictions for Flexible Hydrogen-Bonded Molecules. Part III. Effect of Lattice Vibrations. J. Comput. Chem. 2001, 22, 816–826. 10.1002/jcc.1047. [DOI] [Google Scholar]
- Cruz-Cabeza A. J.; Reutzel-Edens S. M.; Bernstein J. Facts and Fictions about Polymorphism. Chem. Soc. Rev. 2015, 44, 8619–8635. 10.1039/C5CS00227C. [DOI] [PubMed] [Google Scholar]
- Sears V. F. Neutron Scattering Lengths and Cross Sections. Neutron News 1992, 3, 26–37. 10.1080/10448639208218770. [DOI] [Google Scholar]
- Fisher S. J.; Blakeley M. P.; Howard E. I.; Petit-Haertlein I.; Haertlein M.; Mitschler A.; Cousido-Siah A.; Salvay A. G.; Popov A.; Muller-Dieckmann C.; et al. Perdeuteration: Improved Visualization of Solvent Structure in Neutron Macromolecular Crystallography. Acta Crystallogr., Sect. D: Biol. Crystallogr. 2014, 70, 3266–3272. 10.1107/S1399004714021610. [DOI] [PubMed] [Google Scholar]
- Yee A. W.; Blakeley M. P.; Moulin M.; Haertlein M.; Mitchell E.; Trevor Forsyth V. Back-Exchange of Deuterium in Neutron Crystallography: Characterization by IR Spectroscopy. J. Appl. Crystallogr. 2017, 50, 660–664. 10.1107/S1600576717003624. [DOI] [PMC free article] [PubMed] [Google Scholar]
- Natkaniec I.; Bokhenkov E. L.; Dorner B.; Kalus J.; MacKenzie G. A.; Pawley G. S.; Schmelzer U.; Sheka E. F. Phonon Dispersion in D8-Naphthalene Crystal at 6K. J. Phys. C: Solid State Phys. 1980, 13, 4265–4283. 10.1088/0022-3719/13/23/014. [DOI] [Google Scholar]
- Gonze X.; Lee C. Dynamical Matrices, Born Effective Charges, Dielectric Permittivity Tensors, and Interatomic Force Constants from Density-Functional Perturbation Theory. Phys. Rev. B: Condens. Matter Mater. Phys. 1997, 55, 10355–10368. 10.1103/PhysRevB.55.10355. [DOI] [Google Scholar]
- Baroni S.; de Gironcoli S.; Dal Corso A.; Giannozzi P. Phonons and Related Crystal Properties from Density-Functional Perturbation Theory. Rev. Mod. Phys. 2001, 73, 515–562. 10.1103/RevModPhys.73.515. [DOI] [Google Scholar]
- Hohenberg P.; Kohn W. Inhomogeneous Electron Gas. Phys. Rev. 1964, 136, B864–B871. 10.1103/PhysRev.136.B864. [DOI] [Google Scholar]
- Kohn W.; Sham L. J. Self-Consistent Equations Including Exchange and Correlation Effects. Phys. Rev. 1965, 140, A1133–A1138. 10.1103/PhysRev.140.A1133. [DOI] [Google Scholar]
- Bedoya-Martínez N.; Giunchi A.; Salzillo T.; Venuti E.; Della Valle R. G.; Zojer E. Toward a Reliable Description of the Lattice Vibrations in Organic Molecular Crystals: The Impact of van Der Waals Interactions. J. Chem. Theory Comput. 2018, 14, 4380–4390. 10.1021/acs.jctc.8b00484. [DOI] [PubMed] [Google Scholar]
- Reilly A. M.; Tkatchenko A. Role of Dispersion Interactions in the Polymorphism and Entropic Stabilization of the Aspirin Crystal. Phys. Rev. Lett. 2014, 113, 055701. 10.1103/PhysRevLett.113.055701. [DOI] [PubMed] [Google Scholar]
- Likhacheva A. Y.; Rashchenko S. V.; Chanyshev A. D.; Inerbaev T. M.; Litasov K. D.; Kilin D. S. Thermal Equation of State of Solid Naphthalene to 13 GPa and 773 K: In Situ X-Ray Diffraction Study and First Principles Calculations. J. Chem. Phys. 2014, 140, 164508. 10.1063/1.4871741. [DOI] [PubMed] [Google Scholar]
- Seifert G.; Porezag D.; Frauenheim T. Calculations of Molecules, Clusters, and Solids with a Simplified LCAO-DFT-LDA Scheme. Int. J. Quantum Chem. 1996, 58, 185–192. . [DOI] [Google Scholar]
- Oliveira A. F.; Seifert G.; Heine T.; Duarte H. A. Density-Functional Based Tight-Binding: An Approximate DFT Method. J. Braz. Chem. Soc. 2009, 20, 1193–1205. 10.1590/S0103-50532009000700002. [DOI] [Google Scholar]
- Porezag D.; Frauenheim T.; Köhler T.; Seifert G.; Kaschner R. Construction of Tight-Binding-like Potentials on the Basis of Density-Functional Theory: Application to Carbon. Phys. Rev. B: Condens. Matter Mater. Phys. 1995, 51, 12947–12957. 10.1103/PhysRevB.51.12947. [DOI] [PubMed] [Google Scholar]
- Frauenheim T.; Seifert G.; Elsterner M.; Hajnal Z.; Jungnickel G.; Porezag D.; Suhai S.; Scholz R. A Self-Consistent Charge Density-Functional Based Tight-Binding Method for Predictive Materials Simulations in Physics, Chemistry and Biology. Phys. Status Solidi B 2000, 217, 41–62. . [DOI] [Google Scholar]
- Brown-Altvater F.; Rangel T.; Neaton J. B. Ab Initio Phonon Dispersion in Crystalline Naphthalene Using van Der Waals Density Functionals. Phys. Rev. B: Condens. Matter Mater. Phys. 2016, 93, 195206. 10.1103/PhysRevB.93.195206. [DOI] [Google Scholar]
- Momma K.; Izumi F. VESTA 3 for Three-Dimensional Visualization of Crystal, Volumetric and Morphology Data. J. Appl. Crystallogr. 2011, 44, 1272–1276. 10.1107/S0021889811038970. [DOI] [Google Scholar]
- Kresse G.; Hafner J. Ab Initio Molecular Dynamics for Liquid Metals. Phys. Rev. B: Condens. Matter Mater. Phys. 1993, 47, 558–561. 10.1103/PhysRevB.47.558. [DOI] [PubMed] [Google Scholar]
- Kresse G.; Hafner J. Ab Initio Molecular-Dynamics Simulation of the Liquid-Metal--Amorphous-Semiconductor Transition in Germanium. Phys. Rev. B: Condens. Matter Mater. Phys. 1994, 49, 14251–14269. 10.1103/PhysRevB.49.14251. [DOI] [PubMed] [Google Scholar]
- Kresse G.; Furthmüller J. Efficiency of Ab-Initio Total Energy Calculations for Metals and Semiconductors Using a Plane-Wave Basis Set. Comput. Mater. Sci. 1996, 6, 15–50. 10.1016/0927-0256(96)00008-0. [DOI] [PubMed] [Google Scholar]
- Kresse G.; Furthmüller J. Efficient Iterative Schemes for Ab Initio Total-Energy Calculations Using a Plane-Wave Basis Set. Phys. Rev. B: Condens. Matter Mater. Phys. 1996, 54, 11169–11186. 10.1103/PhysRevB.54.11169. [DOI] [PubMed] [Google Scholar]
- Perdew J. P.; Burke K.; Ernzerhof M. Generalized Gradient Approximation Made Simple. Phys. Rev. Lett. 1996, 77, 3865–3868. 10.1103/PhysRevLett.77.3865. [DOI] [PubMed] [Google Scholar]
- Kresse G.; Joubert D. From Ultrasoft Pseudopotentials to the Projector Augmented-Wave Method. Phys. Rev. B: Condens. Matter Mater. Phys. 1999, 59, 1758–1775. 10.1103/PhysRevB.59.1758. [DOI] [Google Scholar]
- Blöchl P. E. Projector Augmented-Wave Method. Phys. Rev. B: Condens. Matter Mater. Phys. 1994, 50, 17953–17979. 10.1103/PhysRevB.50.17953. [DOI] [PubMed] [Google Scholar]
- Kresse G.; Marsman M.; Furthmüller J.. VASP the Guide. https://cms.mpi.univie.ac.at/vasp/vasp.pdf (accessed 2019-04-03).
- Vinet P.; Smith J. R.; Ferrante J.; Rose J. H. Temperature Effects on the Universal Equation of State of Solids. Phys. Rev. B: Condens. Matter Mater. Phys. 1987, 35, 1945–1953. 10.1103/PhysRevB.35.1945. [DOI] [PubMed] [Google Scholar]
- Francis G. P.; Payne M. C. Finite Basis Set Corrections to Total Energy Pseudopotential Calculations. J. Phys.: Condens. Matter 1990, 2, 4395–4404. 10.1088/0953-8984/2/19/007. [DOI] [Google Scholar]
- Grimme S.; Antony J.; Ehrlich S.; Krieg H. A Consistent and Accurate Ab Initio Parametrization of Density Functional Dispersion Correction (DFT-D) for the 94 Elements H-Pu. J. Chem. Phys. 2010, 132, 154104. 10.1063/1.3382344. [DOI] [PubMed] [Google Scholar]
- Grimme S.; Ehrlich S.; Goerigk L. Effect of the Damping Function in Dispersion Corrected Density Functional Theory. J. Comput. Chem. 2011, 32, 1456–1465. 10.1002/jcc.21759. [DOI] [PubMed] [Google Scholar]
- Frisch M. J.; Trucks G. W.; Schlegel H. B.; Scuseria G. E.; Robb M. A.; Cheeseman J. R.; Scalmani G.; Barone V.; Petersson G. A.; Nakatsuji H.; et al. Gaussian 16, Revision 16.A.03; Gaussian Inc.: Wallingford, CT, 2016.
- Kuzmany H.Festkörperspektroskopie: Eine Einführung; Springer: 1990. [Google Scholar]
- Aradi B.; Hourahine B.; Frauenheim T. DFTB+, a Sparse Matrix-Based Implementation of the DFTB Method. J. Phys. Chem. A 2007, 111, 5678–5684. 10.1021/jp070186p. [DOI] [PubMed] [Google Scholar]
- Gaus M.; Goez A.; Elstner M. Parametrization and Benchmark of DFTB3 for Organic Molecules. J. Chem. Theory Comput. 2013, 9, 338–354. 10.1021/ct300849w. [DOI] [PubMed] [Google Scholar]
- Gaus M.; Cui Q.; Elstner M. DFTB3: Extension of the Self-Consistent-Charge Density-Functional Tight-Binding Method (SCC-DFTB). J. Chem. Theory Comput. 2011, 7, 931–948. 10.1021/ct100684s. [DOI] [PMC free article] [PubMed] [Google Scholar]
- Brandenburg J. G.; Grimme S. Accurate Modeling of Organic Molecular Crystals by Dispersion-Corrected Density Functional Tight Binding (DFTB). J. Phys. Chem. Lett. 2014, 5, 1785–1789. 10.1021/jz500755u. [DOI] [PubMed] [Google Scholar]
- Case D. A.; Cheatham T. E.; Darden T.; Gohlke H.; Luo R.; Merz K. M.; Onufriev A.; Simmerling C.; Wang B.; Woods R. J. The Amber Biomolecular Simulation Programs. J. Comput. Chem. 2005, 26, 1668–1688. 10.1002/jcc.20290. [DOI] [PMC free article] [PubMed] [Google Scholar]
- Wang X.; Zhang J.; Chen Y.; Chan P. K. L. Molecular Dynamics Study of Thermal Transport in a Dinaphtho[2,3-b:2′,3′-f]Thieno[3,2-b]Thiophene (DNTT) Organic Semiconductor. Nanoscale 2017, 9, 2262–2271. 10.1039/C6NR08682A. [DOI] [PubMed] [Google Scholar]
- Zheng X.; Geng H.; Yi Y.; Li Q.; Jiang Y.; Wang D.; Shuai Z. Understanding Lattice Strain-Controlled Charge Transport in Organic Semiconductors: A Computational Study. Adv. Funct. Mater. 2014, 24, 5531–5540. 10.1002/adfm.201400261. [DOI] [Google Scholar]
- Leitherer S.; Jäger C. M.; Krause A.; Halik M.; Clark T.; Thoss M. Simulation of Charge Transport in Organic Semiconductors: A Time-Dependent Multiscale Method Based on Nonequilibrium Green’s Functions. Phys. Rev. Mater. 2017, 1, 064601. 10.1103/PhysRevMaterials.1.064601. [DOI] [Google Scholar]
- Campañá C.; Mussard B.; Woo T. K. Electrostatic Potential Derived Atomic Charges for Periodic Systems Using a Modified Error Functional. J. Chem. Theory Comput. 2009, 5, 2866–2878. 10.1021/ct9003405. [DOI] [PubMed] [Google Scholar]
- Sun H. COMPASS: An Ab Initio Force-Field Optimized for Condensed-Phase ApplicationsOverview with Details on Alkane and Benzene Compounds. J. Phys. Chem. B 1998, 102, 7338–7364. 10.1021/jp980939v. [DOI] [Google Scholar]
- Shuai Z.; Geng H.; Xu W.; Liao Y.; André J. M. From Charge Transport Parameters to Charge Mobility in Organic Semiconductors through Multiscale Simulation. Chem. Soc. Rev. 2014, 43, 2662–2679. 10.1039/c3cs60319a. [DOI] [PubMed] [Google Scholar]
- Wang L.; Li Q.; Shuai Z.; Chen L.; Shi Q. Multiscale Study of Charge Mobility of Organic Semiconductor with Dynamic Disorders. Phys. Chem. Chem. Phys. 2010, 12, 3309–3314. 10.1039/b913183c. [DOI] [PubMed] [Google Scholar]
- Martinelli N. G.; Olivier Y.; Athanasopoulos S.; Delgado M. R.; Pigg K. R.; Da Silva Filho D. A.; Sánchezcarrera R. S.; Venuti E.; Delia Valle R. G.; Brédas J. L.; et al. Influence of Intermolecular Vibrations on the Electronic Coupling in Organic Semiconductors: The Case of Anthracene and Perfluoropentacene. ChemPhysChem 2009, 10, 2265–2273. 10.1002/cphc.200900298. [DOI] [PubMed] [Google Scholar]
- Geng H.; Peng Q.; Wang L.; Li H.; Liao Y.; Ma Z.; Shuai Z. Toward Quantitative Prediction of Charge Mobility in Organic Semiconductors: Tunneling Enabled Hopping Model. Adv. Mater. 2012, 24, 3568–3572. 10.1002/adma.201104454. [DOI] [PubMed] [Google Scholar]
- Hagler A. T.; Lifson S.; Dauber P. Consistent Force Field Studies of Intermolecular Forces in Hydrogen-Bonded Crystals. 2. A Benchmark for the Objective Comparison of Alternative Force Fields. J. Am. Chem. Soc. 1979, 101, 5122–5130. 10.1021/ja00512a002. [DOI] [Google Scholar]
- Halgren T. A. The Representation of van Der Waals (VdW) Interactions in Molecular Mechanics Force Fields: Potential Form, Combination Rules, and VdW Parameters. J. Am. Chem. Soc. 1992, 114, 7827–7843. 10.1021/ja00046a032. [DOI] [Google Scholar]
- Bureekaew S.; Amirjalayer S.; Tafipolsky M.; Spickermann C.; Roy T. K.; Schmid R. MOF-FF - A Flexible First-Principles Derived Force Field for Metal-Organic Frameworks. Phys. Status Solidi B 2013, 250, 1128–1141. 10.1002/pssb.201248460. [DOI] [Google Scholar]
- Furukawa H.; Cordova K. E.; O’Keeffe M.; Yaghi O. M. The Chemistry and Applications of Metal-Organic Frameworks. Science (Washington, DC, U. S.) 2013, 341, 1230444. 10.1126/science.1230444. [DOI] [PubMed] [Google Scholar]
- Dürholt J. P.; Fraux G.; Coudert F. X.; Schmid R. Ab Initio Derived Force Fields for Zeolitic Imidazolate Frameworks: MOF-FF for ZIFs. J. Chem. Theory Comput. 2019, 15, 2420–2432. 10.1021/acs.jctc.8b01041. [DOI] [PubMed] [Google Scholar]
- Ahlrichs R.; Bär M.; Häser M.; Horn H.; Kölmel C. Electronic Structure Calculations on Workstation Computers: The Program System Turbomole. Chem. Phys. Lett. 1989, 162, 165–169. 10.1016/0009-2614(89)85118-8. [DOI] [Google Scholar]
- Heidar-Zadeh F.; Richer M.; Fias S.; Miranda-Quintana R. A.; Chan M.; Franco-Pérez M.; González-Espinoza C. E.; Kim T. D.; Lanssens C.; Patel A. H. G.; et al. An Explicit Approach to Conceptual Density Functional Theory Descriptors of Arbitrary Order. Chem. Phys. Lett. 2016, 660, 307–312. 10.1016/j.cplett.2016.07.039. [DOI] [Google Scholar]
- Allinger N. L.; Yuh Y. H.; Lii J. H. Molecular Mechanics. The MM3 Force Field for Hydrocarbons. 1. J. Am. Chem. Soc. 1989, 111, 8551–8566. 10.1021/ja00205a001. [DOI] [Google Scholar]
- Allinger N. L.; Li F.; Yan L.; Tai J. C. Molecular Mechanics (MM3) Calculations on Conjugated Hydrocarbons. J. Comput. Chem. 1990, 11, 868–895. 10.1002/jcc.540110709. [DOI] [Google Scholar]
- Plimpton S. Fast Parallel Algorithms for Short-Range Molecular Dynamics. J. Comput. Phys. 1995, 117, 1–19. 10.1006/jcph.1995.1039. [DOI] [Google Scholar]
- Togo A.; Tanaka I. First Principles Phonon Calculations in Materials Science. Scr. Mater. 2015, 108, 1–5. 10.1016/j.scriptamat.2015.07.021. [DOI] [Google Scholar]
- Trueblood K. N.; Bürgi H.-B.; Burzlaff H.; Dunitz J. D.; Gramaccioli C. M.; Schulz H. H.; Shmueli U.; Abrahams S. C. Atomic Dispacement Parameter Nomenclature. Report of a Subcommittee on Atomic Displacement Parameter Nomenclature. Acta Crystallogr., Sect. A: Found. Crystallogr. 1996, 52, 770–781. 10.1107/S0108767396005697. [DOI] [Google Scholar]
- Grosse-Kunstleve R. W.; Adams P. D. On the Handling of Atomic Anisotropic Displacement Parameters. J. Appl. Crystallogr. 2002, 35, 477–480. 10.1107/S0021889802008580. [DOI] [Google Scholar]
- Wallace D. C.; Callen H. Thermodynamics of Crystals. Am. J. Phys. 1972, 40, 1718–1719. 10.1119/1.1987046. [DOI] [Google Scholar]
- Zhao J.; Mccreery R. Multichannel FT-Raman Spectroscopy: Noise Analysis and Performance Assessment. Appl. Spectrosc. 1997, 51, 1687–1697. 10.1366/0003702971939361. [DOI] [Google Scholar]
- Capelli S. C.; Albinati A.; Mason S. A.; Willis B. T. M. Molecular Motion in Crystalline Naphthalene: Analysis of Multi-Temperature X-Ray and Neutron Diffraction Data. J. Phys. Chem. A 2006, 110, 11695–11703. 10.1021/jp062953a. [DOI] [PubMed] [Google Scholar]
- Tkatchenko A.; Distasio R. A.; Car R.; Scheffler M. Accurate and Efficient Method for Many-Body van Der Waals Interactions. Phys. Rev. Lett. 2012, 108, 236402. 10.1103/PhysRevLett.108.236402. [DOI] [PubMed] [Google Scholar]
- Ambrosetti A.; Reilly A. M.; Distasio R. A.; Tkatchenko A. Long-Range Correlation Energy Calculated from Coupled Atomic Response Functions. J. Chem. Phys. 2014, 140, 18A508. 10.1063/1.4865104. [DOI] [PubMed] [Google Scholar]
- Grimme S. Semiempirical GGA-Type Density Functional Constructed with a Long-Range Dispersion Correction. J. Comput. Chem. 2006, 27, 1787–1799. 10.1002/jcc.20495. [DOI] [PubMed] [Google Scholar]
- Tkatchenko A.; Scheffler M. Accurate Molecular van Der Waals Interactions from Ground-State Electron Density and Free-Atom Reference Data. Phys. Rev. Lett. 2009, 102, 073005. 10.1103/PhysRevLett.102.073005. [DOI] [PubMed] [Google Scholar]
- Meletov K. P. Phonon Spectrum of a Naphthalene Crystal at a High Pressure: Influence of Shortened Distances on the Lattice and Intramolecular Vibrations. Phys. Solid State 2013, 55, 581–588. 10.1134/S1063783413030207. [DOI] [Google Scholar]
- Bhandari R.; Jindal V. K. Calculation of Thermal Expansion and Implicit Phonon Frequency Shift in Deuterated Anthracene. J. Phys.: Condens. Matter 1991, 3, 899–907. 10.1088/0953-8984/3/8/002. [DOI] [Google Scholar]
- Kuhn H. W. The Hungarian Method for the Assignment Problem. Nav. Res. Logist. Q. 1955, 2, 83–97. 10.1002/nav.3800020109. [DOI] [Google Scholar]
- George J.; Wang R.; Englert U.; Dronskowski R. Lattice Thermal Expansion and Anisotropic Displacements in Urea, Bromomalonic Aldehyde, Pentachloropyridine, and Naphthalene. J. Chem. Phys. 2017, 147, 074112. 10.1063/1.4985886. [DOI] [PubMed] [Google Scholar]
- Kittel C.Introduction to Solid State Physics; Wiley: 2004. [Google Scholar]
- Prince E.Mathematical Techniques in Crystallography and Materials Science; Springer: Berlin Heidelberg, 1994; 10.1007/978-3-642-18711-7. [DOI] [Google Scholar]
- Macrae C. F.; Sovago I.; Cottrell S. J.; Galek P. T. A.; McCabe P.; Pidcock E.; Platings M.; Shields G. P.; Stevens J. S.; Towler M.; et al. Mercury 4.0: From Visualization to Analysis, Design and Prediction. J. Appl. Crystallogr. 2020, 53, 226. 10.1107/S1600576719014092. [DOI] [PMC free article] [PubMed] [Google Scholar]
- Lide D. R.CRC Handbook of Chemistry and Physics, 90th ed.; Taylor & Francis: Boca Raton, FL, 2009. [Google Scholar]
- Becke A. D. Density-functional Thermochemistry. III. The Role of Exact Exchange. J. Chem. Phys. 1993, 98, 5648–5652. 10.1063/1.464913. [DOI] [Google Scholar]
- Stephens P. J.; Devlin F. J.; Chabalowski C. F.; Frisch M. J. Ab Initio Calculation of Vibrational Absorption and Circular Dichroism Spectra Using Density Functional Force Fields. J. Phys. Chem. 1994, 98, 11623–11627. 10.1021/j100096a001. [DOI] [Google Scholar]
Associated Data
This section collects any data citations, data availability statements, or supplementary materials included in this article.


