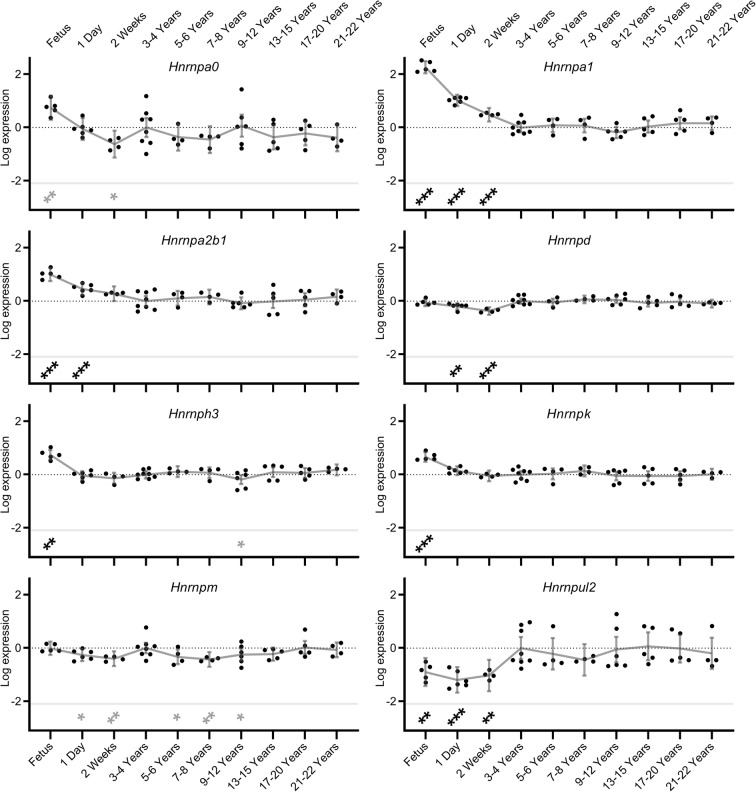
Fig. 2.
Splicing inhibitor expression levels in naked mole-rat (NMR) brain during development and ageing. Transcript expression levels of Hnrnp splicing inhibitors in NMR brain from foetus through to 20–22 years old are shown. Data points represent β-coefficients of log fold-change in expression levels for each transcript in each animal relative to the mean expression in the 3–4 year old animals. The null point for each transcript is shown as a light dotted line. Grey lines denote the mean values with error bars at the 95% confidence intervals. Transcripts showing significant differences from the 3–4 year old comparator group are denoted with stars: * = p < 0.05, ** = p < 0.01, *** = p < 0.001. Associations which remain significant after FDR correction (p < 0.002) are indicated in black, while those in grey represent nominal associations (p < 0.05).

