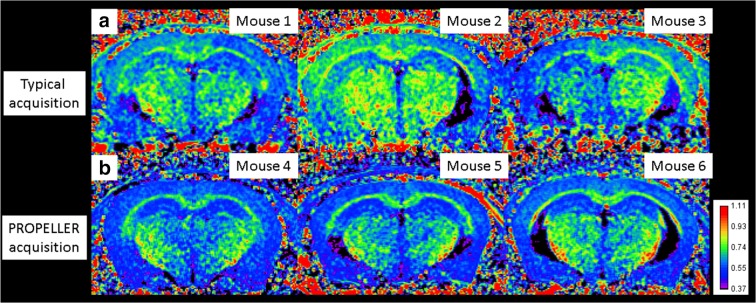
Fig. 2.
Representative images showing R1 maps from data collected with a a typical acquisition sequence or b a periodically rotated overlapping parallel lines with enhanced reconstruction (PROPELLER) sequence (called BLADE on the system used in this study). In all cases, post-processing normalization to the TR 150-ms image was performed to suppress B1 inhomogeneity artifacts, and coil and slice bias (Berkowitz et al. 2019). Calibration bar indicates the range of R1s shown

