

Abstract
We introduce GAIM, a deep-learning analytical framework that enables benchmarking and profiling of players, from the perspective of how the players react to the game state and evolution of games. In particular, we focus on multi-player, skill-based card games, and use Rummy as a case study. GAIM framework provides a novel and extensible encapsulation of the game state as an image, and uses Convolutional Neural Networks (CNN) to learn these images to calibrate the goodness of the state, in such a way that the challenges arising from multiple players, chance factors and large state space, are all abstracted. We show that our model out-performs well-known image classification models, and also learns the nuances of the game without explicitly training with game-specific features, resulting in a true state model, wherein most of the misclassifications can be attributed to user mistakes or genuinely confusing hands. We show that GAIM helps gather fine-grained insights about player behavior, skill, tendencies, and business implications, that were otherwise not possible, thereby enabling targeted services and personalized player journeys.
Electronic supplementary material
The online version of this chapter (10.1007/978-3-030-47436-2_33) contains supplementary material, which is available to authorized users.
Keywords: Game intelligence, Game action mining, Convolutional Neural Network, Player behavior model
Introduction
With the proliferation of digital platforms, and low-cost availability of mobile devices and data, online multi-player card games, are becoming increasingly popular among adults and teenagers, with a market value of $4 billion in 2019 [1, 2]. Much of this popularity can be attributed to the unique blend of recreational and intellectual entertainment offered by such chanced-based and strategy-oriented card games as Rummy, Poker, etc. Such games greatly test a player’s ability to navigate through the enormous state space, recall the moves of other players, and probabilistically estimate the missing information arising from imperfect and asymmetric knowledge (since a player’s cards are usually hidden from others). Artificial intelligence and machine learning research in gaming have typically focused on bots exceeding human expertise in several games, e.g., Go, chess, backgammon, checkers, Jeopardy! and Atari games [4, 6, 14, 20, 22, 25]. However, in real cash card games, it is required to consciously ensure that there is no interference during the game play via any kind of automated decision making (beyond the random dealing of cards), to ensure fairness. Therefore, this work primarily focuses on leveraging machine learning to understand, benchmark, and profile the individual players with respect to their playing behavior, strategies and longitudinal evolution of game play.
Mining the game states in multi-player, skill-based card games yields valuable information about the game and players, their intentions and root causes, for example, whether a player is conservative, skilled, or a risk-taker, or has become aggressive or disengaged. Another important use case for this analysis is to evaluate game prudence, i.e., detect and preempt addictive and gambling tendencies, which is especially important in cash games. However, player behavioral profiling via game state mining is challenging because of factors such as large state space and subjective reactions conditional to chance factors. This makes this effort fundamentally different from various player rating systems in other games (e.g., ELO rating in chess [5]), which are objective. For example, in Rummy (Sect. 3), one important decision for a player is whether to play or drop the game based on the cards he was dealt. For a clearly very good or bad set of cards the decision is straight forward to play or drop, respectively. However, most of the hands typically fall in intermediate category (over  ). While a conservative player may drop such hands, a more aggressive player may play and possibly end up winning depending on the cards of his opponents, and how the game evolves by chance. Both kinds of players may end up with very similar ratings, based on any established schemes which look at their overall standing in the scoreboard across all players and games in the system. However, we strive for more fine-grained observation of player behaviors.
In this work, we present Game Action Information Miner (GAIM), a Convolutional Neural Network based framework for card game analytics. The contributions of this work are: (i) A novel representation of the card game state as an image, which encapsulates all pertinent information in a generic and extensible manner. (ii) An efficient CNN model that out-performs other well-known methods to predict critical game decision, (iii) Calibrate the goodness of the state in a chance-independent, continuous and deterministic manner using the model. This is then leveraged to benchmark players, with respect to their response to a game state. (iv) Our model and derived metrics are remarkably valuable for end-to-end player behavioral analyses and gethering insights across game dynamics, that were not possible before due to the close coupling of chance and strategy.
Although the GAIM framework is applicable to any skill-based card game, we describe its utility within the context of one particular game, Rummy.
Related Work
Deep Learning in Multi-player Games: Most of the literature in the space of deterministic games focuses on building agents that can learn and predict next moves and effectively play the game as skillfully as or better than a human, using techniques such as Monte Carlo Tree Search and deep reinforcement learning [10, 21, 22]. Unlike Chess or Go, multi player cards games are mostly partially observable markov decision processes or stochastic games (POMDP or POSG), where the game tree is not known fully. [8] uses neural fictitious self-play agent to approximate Nash equilibrium in poker. [17] generates probable subsets of true states prior to performing a tree search for decision making in games like Rack-O and Game of Pure Strategy. Other works include [27] which employs computer vision techniques to recognize Poker players’ intentions and predict their actions based on their face expressions. [15] estimates the value of holding any possible private cards in any poker situation, using recursive reasoning, decomposition and a form of intuition that is learned from self-play using deep learning. [9] builds a convolution neural network model to predict the discarded tile in Mahjong using a data structure, which is a function of only a single game state, namely, the tile type, and is not generic or extensible like ours. The scope and objective of this work is not to develop a game playing agent, but rather to mine game intelligence of players that enables end-to-end behavioral analytics.
Player Behavior Analysis: In [16], Clustering is used on game-specific features for online tennis to segment different types of players, which is used to introduce realistic diversity in the bots to play against humans. [19] uses non-negative tensor factorization to identify players who are similar not only by playing patterns and strategies but also by temporal trajectories. Our method precludes the need for game-specific features, and we use model-based profiling instead of clustering for identifying player patterns. In [28], for a game where the actions and their rewards are known, the player’s motivation and reasoning behind actions are learned using inverse reinforcement learning. Our work is orthogonal to [28] because we focus on defining and determining the optimal policy.
The Game of Rummy
Rummy is a game of skill played with 2 to 6 players with the objective of forming valid melds, i.e., groups of sets and sequences with all the cards at hand. A set is a group of cards with the same rank but different suits (e.g.,
 ); a sequence is a group of cards in sequential order of ranks all with the same suit (e.g.,
 . Each meld must be at least 3 cards long. A randomly selected card is designated as joker which the players can use to complete a set or sequence. For example, if
 is drawn as the wild card joker, then 2 of any suit can be used to form melds (a printed joker also plays the same role). A sequence/set that contains a joker is called an impure sequence/set, and otherwise it is a pure sequence/set.
Declaration: The player who declares first with all valid sequences and sets wins the game. It is mandatory to have at least two sequences, one of which must be pure, and the other can be pure or impure. Figure 1 shows an example of a winning declaration. Winner gets 0 points, other players get points equal to sum value of cards (face cards carry 10 points, jokers and pure sequences fetch 0 points). All players aim to minimize their points.
Fig. 1.
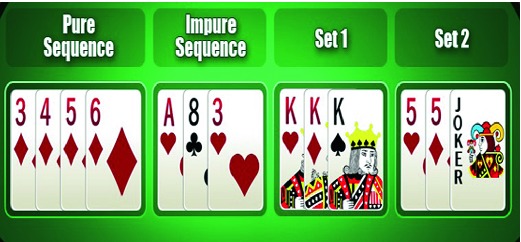
Example of a winning declaration
Drop: At any time during the game, the player has the option of dropping from the game. First drop is one of the most important decisions to be made in the game, because it helps conserve points. If the hand that was dealt was poor, then it is better to drop (and get away with 20 points) rather than end up with a higher score. Learning which hand to drop is an important skill that a good rummy player must acquire.
The quest for a player is to strategize and progressively move towards creating a winning hand before his opponents. For the curious readers, we have summarized the odds and state space involved in a game of rummy in Table 1. It may be noted that, like most of the multi-player card games, Rummy is characterized as an imperfect information, non zero-sum game, where an optimal strategy equilibrium is a hard problem ranging from NP-hard to PPAD-complete [7, 8, 18].
Table 1.
Rummy features for #cards = 13, #decks = 2, #suits = 4. i is the meld length
| Odds | # possibilities | |||||
|---|---|---|---|---|---|---|
| i = 3 | i = 4 | i = 5 | i = 3 | i = 4 | i = 5 | |
| Pure seq(i) | 2.1e−03 | 1.5e−04 | 1.4e−05 | 384 | 704 | 1280 |
| Impure seq(i) | 1.04e−02 | 1.5e−03 | 2.4e−04 | 6112 | 30656 | 127k |
| Pure set(i) | 2.31e−03 | 4.5e−05 | 416 | 208 | ||
| Impure set(i) | 8.47e−03 | 7.2e−04 | 5144 | 17152 | ||
| Win hand(13) | 0.00271 | 3.32e+13 | ||||
GAIM Framework
The objective of the GAIM framework is to analyze player actions during the course of a game, which in turn can be used to enable or enrich other analytical models used for various business objectives. This is illustrated in Fig. 2 where we see that the GAIM layer sits in between the raw databases and the analytical models that consume this data, augmenting the raw data with additional derived information.1
Fig. 2.
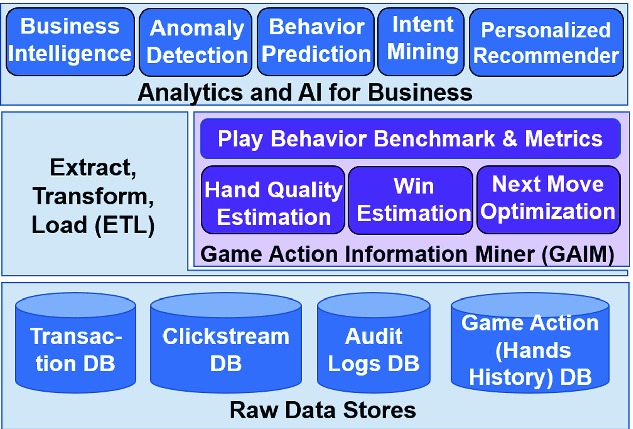
Block diagram of GAIM
Hand Image Representation
We represent a player’s hand as a kx x3 array, for k suits and n ranks. This paper uses 4
  14
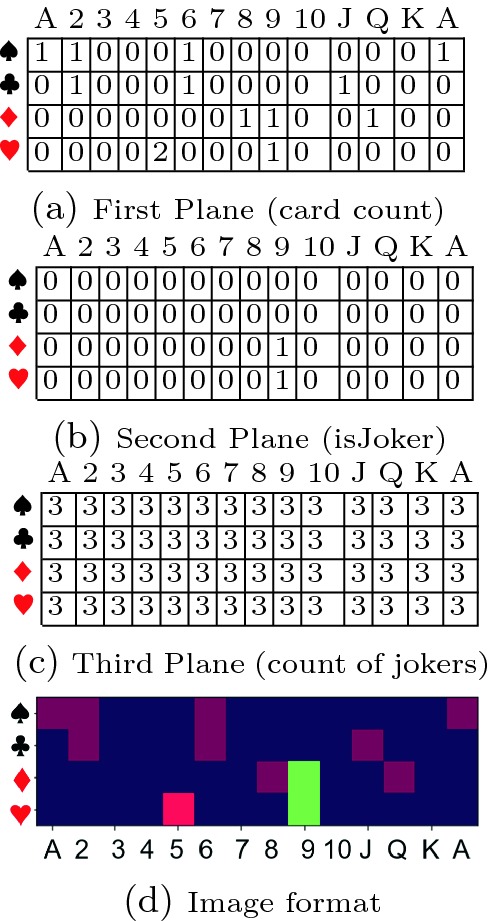
14  3 array where, each of the 4 rows represents a suit; each of 14 columns represents a rank, in the order
  . Ace is repeated because it can be both the lowest or the highest card in a sequence. The first
  plane represents the count of cards in hand. For example, if the player has one 4
 , then the value in the corresponding cell is 1. The second plane is used to represent special properties of individual cards. We use it to denote if the card is a wild card joker. The third plane represents properties that are common to the entire hand. We use it to denote the total number of jokers in hand. This also allows for the printed joker card (which does not have a place in the 4
  14 array) to be counted. As an example, the array representation for the following hand, and the corresponding image format are shown in Fig. 3:
 , and the wild card joker is 9. We can now visualize the hand as an RGB image, wherein pure sequences are seen as horizontal consecutive blocks and sets are seen as vertical blocks; multiple cards of the same rank and suit result in a brighter red block; jokers emerge as a greenish block; the number of jokers reflect as a blue-tinge in the background.
Fig. 3.
Array representation
When mapped to an RGB image, each plane can hold 8 bits of information (values 0 to 255), this image representation is sufficient for games played with up to 256 decks, with 8 card-level states (e.g., isJoker, isOpenCard, isDiscardedByPlayerA, fromClosedStack, etc.) and 8 hand-level states (e.g., total jokers (3 bits), game variant, turn number, time of play etc.). Without loss of generality, more planes can be included (and the depth of the convolution filters changed accordingly), as long as the separation between card-level and hand-level information is preserved. It may also be noted that this representation can be used for any card game, not just Rummy. For instance, in Bridge [7], we can use the first layer to denote the location of the card (with the declarer, the dummy or played in a trick), the second layer to denote all cards in the trump suit, and the third layer to indicate the trick number.
Hand Quality Estimation Model
When the cards are dealt to a player, he needs to respond to the hand depending on whether it is a good, bad or mediocre hand. In case of a clearly strong hand (e.g., with a pure sequence already) or a clearly bad hand (e.g., with no jokers, and cards that are far apart), it is an easy decision to play or drop, respectively. But, with mediocre hands the decision is much more difficult and would depend on the skill, experience and behavioral tendencies of a player. We utilize the significance of the first drop decision to build a supervised convolutional neural network model for HQE (HandNet).
We train HandNet to learn the first-drop decision of highly skilled players from the image representation of hands. The highly skilled are most likely to take the correct first drop decision. Hence, the output of this model, i.e., the probability of first drop given a hand, serves as an effective proxy for hand quality, thereby calibrating a given hand of cards on a continuous scale, in a deterministic manner (a hand always gets the same quality measure) abstracting extraneous factors such as luck, opponent skills and game state.
The architecture of HandNet is shown in Fig. 4, consisting of three convolution layers (with ReLU activation), followed by one average pooling layer (2  2), one drop out layer (
 ), one fully connected dense layer (512 nodes, hyperbolic tangent activation), and finally a softmax layer for binary classification. The kernel size is taken as 4
  4 (with stride 1) because we are interested in an average meld size of 4. We use average pooling because, unlike conventional “image recognition” applications of CNN (where max pooling is preferred to capture the most invariant features), we are more interested in understanding the what blocks are present, and more importantly, not present in a region and its neighborhood. Hence we use average pooling to reduce the loss of information while summarizing the region.
Fig. 4.
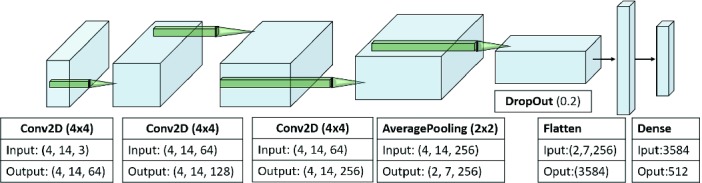
Architecture of HandNet
Dataset and Training: To curate the training dataset, we define skilled player as one who has played at least 500 cash games and has an average differential end score of  (which is 3 standard deviations away from mean), defined as
 . Differential end score is a better measure than the end score because it takes into account the margin of victory. The lower bound on the number of games played ensures that there is no luck involved. These filters resulted in a skilled-player base of 3956 users out of the total player base of 282,102 users. The initial hands of all the games played by these users in two months is taken as input, and the player’s decision of drop (1) or play (0) is taken as the ground truth label. The model was trained for 100 epochs, with a stochastic gradient descent optimizer, 10-fold cross validation and categorical cross entropy as the loss function. The first-drop decision of a player will depend on the number of players in a game - the tendency to drop is higher in a 6-player game than a 2-player game, since there is higher chance of not getting the cards needed. Hence, we trained separate models for 2-, 3-, 4-, 5- and 6-player games, each with about 2.9 million records. The proportion of drops ranged from
  in 2-player to
  in 6-player games (Table 6).
Fig. 6.

Performance of n-player models. The thresholds are 0.35, 0.3, 0.52, 0.61, 0.65 and ground truth drop ratios are 0.12, 0.17, 0.23, 0.30, 0.35, for 2,3,4,5,6p respectively
Evaluation of HQE Model
In this section, we evaluate how well the HQE model learns the ground truth (drop decision), the quality of a given hand, and other game nuances.
Goodness of Architecture: The performance metrics (Area under ROC curve, Area under Precision Recall curve, Accuracy, Precision and Recall at break even point) of the 2-player model on the validation set are shown in Fig. 5. The HQE model is shown to out-perform (i) a Feed Forward neural network (multi-layer perceptron), where the image array is flattened and fed to 3 fully-connected hidden layers with 1024 nodes each, with a softmax layer at the end (FFNN-1) (ii) VGG16 [23], (iii) DenseNet [12] and (iv) ResNet [11]. The reason for our model’s superior performance over other well-known CNN architectures is that our architecture and convolution filter sizes enable the model to detect the features of interest better.2 Figure 7 shows the evolution of training and validation accuracy and loss with each epoch. It may be noted that we use the break even point where precision = recall to optimize the threshold, rather than other metrics such as F1 score because, our objective is to effectively identify the good, bad and intermediate hands, rather than focusing on correctly predicting the drop class alone. The performance metrics of n-player models against the validation set are shown in Fig. 6. For the rest of the evaluation, we use the 2-player model because that is the most frequent scenario, but the conclusions can be extended without loss of generality to n-player games (also verified empirically but omitted due to space constraints).
Fig. 5.

Performance of HandNet
Fig. 7.
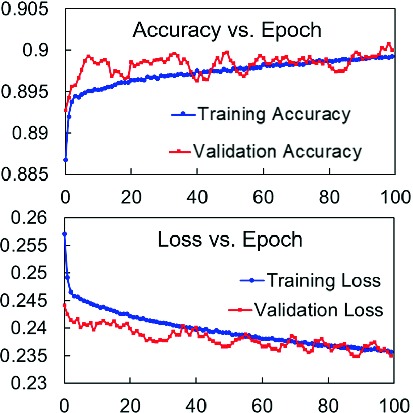
Convergence of accuracy and loss
Goodness of Game State Representation: Next, we use rummy-specific features that can be potentially indicative of the goodness of a hand, and use these features instead of our game state input to train models using (i) Random Forest, (ii) XGBoost and (iii) Feed forward network (FFNN-2). The features used are number of jokers, number of pure sequence of length three and four, number of bits (e.g.,  ,
,  ), number of connected cards (e.g.,
  and
and  ), number of sets of length three and four, number of cards away from a winning hand and hand score (i.e, points). The poor performance of these models (Fig. 5) show that these features are not sufficient to calibrate the hand quality.
Learning the Hand Quality: We now evaluate if the model provides continuous-scale quality estimation of hands as envisioned. Figure 8 shows the hands with highest and lowest drop prob (0.97, 2.76e−07, respectively) in a validation set. We see that the least probability hand is already a winning hand; the maximum probability hand has no jokers, and is at least 2 cards away from a pure sequence and hence is clearly a bad hand. We also compare the end scores of the true negatives TN (i.e., player played when drop prob is high) with the false positives FP, to study how the players fared when they differed from the model. The two groups were significantly different (average p-value of 0.0003), implying that playing a bad hand, as per the model, yields bad score. Next we consider a set of thumb rules for obviously good (Play hands with pure sequence and  joker), obviously bad (Drop hands with 0 joker and 0 pure seq) and other (Not Sure) hands.
Fig. 8.
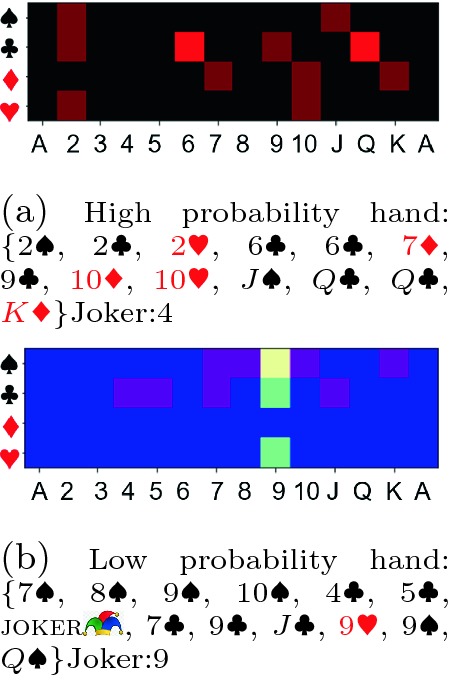
Drop probability reflects hand quality
The objective of this exercise was three fold: (i) to verify the deterministic continuous calibration of our model, (ii) to show why such thumb rules are not sufficient to estimate hand quality and (iii) to understand if and when our model mispredicts.
The average drop probabilities (output by model) for the 3 categories are 0.0065, 0.332 and 0.687, respectively, which are <,  , > threshold 0.35, verifying objective i. Majority of hands (
 ) fall under Not Sure category, indicating thumb rules are insufficient (objective ii). Next, we bucket the samples misclassified during training (which is
  since model accuracy is
  ) into these 3 categories. We see in Fig. 9 that
  of Play mismatches (constitutes
  are FN (i.e., model recommends play but player dropped), implying player mistake;
  of Drop mismatches (4.2%) are FP (i.e., model recommends drop but player plays), again implying player mistake; there is an almost equal split between FP and FN under Not Sure (
 ), with near-threshold drop prob, implying intermediate hand, not necessarily a player mistake nor model’s incompetence.
Fig. 9.

Bucketing of misclassified samples
Learning the Effect of Joker: Next, we assess how well the model learns the importance of the joker. We retrain our model, with (i) second plane always 0, (ii) third plane always 0 and (iii) both set to 0. The precision and recall of the model reduced by  ,
,  and
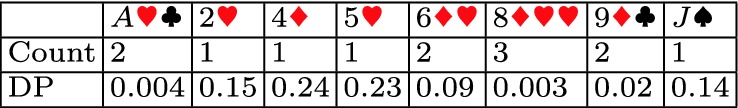
and  , respectively compared to Fig. 5, substantially validating that the model learns value of joker from our input. Next, we took a randomly selected hand
 that does not contain any joker. Its drop probability is 0.549 (not playable). As a rule of thumb, having a joker improves the quality of hand. To validate that, we treated each of these cards as a joker card, and the drop probability reduces in all cases and the hand becomes playable (Table 2).
Table 2.
Drop prob when jokers are introduced
Learning the Advantage of Left-Heavy Hands: Since the objective in a rummy game is to minimize the points, a skilled rummy player drops a hand with too many high value cards. In order to verify that the model has learned this, we selected 50 right-heavy images (i.e., most of the cards are on the right half of the image, implying many high value cards) with no pure sequences or jokers and computed their drop probabilities from the model; next we compared these with that of their left-heavy counterparts (by horizontally flipping each image). A one-tailed, paired two sample t-test shows that the mean drop probability is significantly lower after flipping ( ).
).
Player Behavioral Analyses
How a player reacts to a hand, given its quality, sheds light on various player characteristics and playing tendencies. For instance, Fig. 10 shows the initial hand quality (drop probabilities) of the last few hundred games of two different players. From this figure, we clearly understand that Player A is a very conservative player, dropping most of the hands he could have played, while Player B is a very aggressive player, playing most of the hands he should have dropped. To further aid such analyses, we derive relevant metrics (referred to as HQE Metrics), some of which are listed in Table 3. It may also be noted that the HQE model has been deployed in real time and the data used for the analyses in this section are from production pipeline (deployment details in supplementary material Section S2).
Fig. 10.

Hand quality helps identify different playing styles. The green dots are the correct plays, i.e., true negatives; blue: correct drops (TP); orange: wrong drops (FN); pink: wrong plays (FP).
Table 3.
HQE metrics with definitions

Measuring Player Engagement: The change in playing pattern over time is a precursor to important events in a player’s journey. We use such longitudinal analysis of DA for churn prediction. We have an existing XGBoost model to predict churners (who become disengaged and leave the platform). The features used in this model include number of active days, win amount, deposit amount, etc. We augment this model with DA and its time series features. We observe that the AUC of the model improves by  from 0.634 to 0.706. To understand why DA improved churn prediction, we look into a player who churned and was correctly predicted by HQE-enhanced model, but not baseline churn model. Figure 11 shows his drop action in the last 500 games. We see that in the last 100 games, the player has not dropped a single game (sudden sharp decrease in DA), indicating onset of aggressiveness or disengagement. Similarly, we observed that DA was one of the most important features for predicting if a player will convert from practice to paid player, improving the accuracy of the conversion prediction model from
  to
to  .
.
Fig. 11.

HQE for churn prediction (green:correct plays, blue: correct drops, orange: wrong drops, pink: wrong plays)
Enhancing Game Prudence: One of the biggest responsibilities in providing a real-money gaming platform is ensuring responsible game play among all players. Typical addiction indicators include spending excessive amount of time and money on the platform, and displaying desperate behavior (when they begin to chase losses) [3]. Drop behavior is helpful in observing such desperation. We have an anomaly detection model that identifies players who are on the trajectory of becoming irresponsible or addicted. The flagged players are blocked after verification by a counselor. The coefficient of variation ( ) in DA of blocked players is significantly higher than non-blocked players, per one-tailed Kruskal-Wallis rank hypothesis test (p = 0.017). This is an important revelation, because it implies that the HQE model and DA not only reflect the skill of the player (because, in most cases, the addicted players know the game well), but it also identifies clean, responsible and prudent skill.
Platform-Level KPIs: Within the gaming platform, there are several key performance indicators of players that help in all business decisions. Table 4 shows that there is very high correlation between DA and the KPIs listed. It is of great importance to note that the KPIs consistently increase monotonically with drop adherence. This implies that the playing mindset, propensity to spend, time taken to get engaged with the platform are all correlated with DA. The remarkable implication of this result is two fold. Firstly, we can use drop adherence as a reliable metric for early prediction of these KPIs. Secondly, if the drop adherence of the players can be improved then all these KPIs of interest would also improve organically, along with players win ratio (Table 3). This finding has been folded into several product campaigns, aiming to up-skill players to drop correctly.
Table 4.
Pearson correlation coefficient (r) between DA and KPIs, along with significance value p
| KPI | Definition | r | p |
|---|---|---|---|
| Time to Conversion | Number of days taken to convert from free to paid player | −0.95 |  |
| Conversion Rate | Fraction of newly registered players who convert | 0.98 |  |
| First Deposit | Deposit amount made by a player for the first time | 0.70 | 0.024 |
| D7 Repeat Deposit | Deposit amount made by a player after 7 days of conversion | 0.88 |  |
| D7 ARPU | Average Revenue Per User for all users who converted 7 days ago | 0.90 |  |
| Retention | Fraction of days on which cash games were played | 0.89 | 0.007 |
Player Segmentation and Persona Clustering: Next we observe the drop behavior across different cohorts of players. Table 5 lists the segments considered. The drop metrics for 2000 players in each segment were computed. Figure 12 shows that the HQE metrics are different across different segments, implying that the playing behavior is different across the segments. We see that skilled and PC players are similar; PS and NUNew are similar, as expected intuitively (results from ANOVA and Tukey HSD test [26] are omitted due to space constraints).
Table 5.
Segments of players
| Skilled | Skilled players as defined from our training data set in Sect. 4 |
|---|---|
| PC | Platinum Club players who play cash games in the higher bracket, generate most revenue |
| NUCore | New Users from Core Geos, regions were Rummy is well-known with a large player base |
| PS | Poorly skilled players, in the bottom  in the average differential score Sect. 4 in the average differential score Sect. 4
|
| NUNew | New Users from New Geos, i.e., regions where Rummy is typically not a popular game |
Fig. 12.
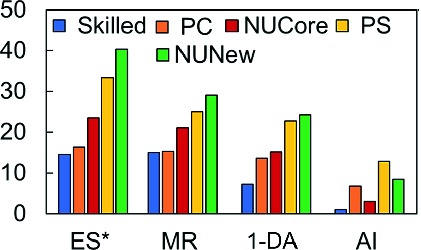
HQE metrics for different player segments
Next we group players based on their game play to identify previously unknown segments or player persona buckets. We randomly selected 10000 players, generated their HQE metrics for games played over 2 months, and then performed k-means clustering ( as per scree plot). The cluster centroids are shown in Fig. 13 (rows 1–5). For retrospective verification, we also present some extraneous meta-data about the players in the clusters (rows 6–9). The observations from these results are given in Fig. 14. We can now use such clustering to predict the persona bucket of new players too.
Fig. 13.
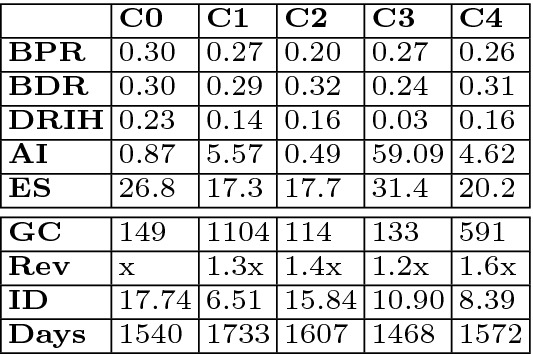
Cluster centroids and meta-data (GC: game count, Rev:revenue generated, Days: days on the system, ID: inactive days.
Fig. 14.
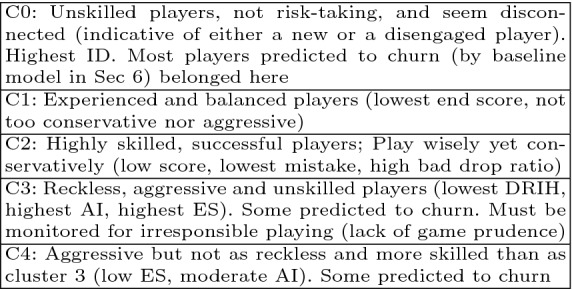
Observation of cluster characteristics
As a summary, we compare the features of HQE-based DA as a skill metric with other metrics - end score (ES), average differential end score (Diff ES, Sect. 4), win ratio (WR), ELO [5], and drop adherence derived from two other indicators of hand quality that we have discussed already - thumbrule (DA Rule) and number of cards away from declaration (DA Dist in Table 6. We see that HQE-based DA is the most robust providing insights that others are unable to in a timely and accurate manner.
Table 6.
Skill metrics. Y: Yes, N: No, E: Eventually
Characteristics 
|
DA | Diff | W | E | DA | DA | E |
|---|---|---|---|---|---|---|---|
Skill Metric 
|
HQE | ES | R | S | Dist | Rule | LO |
| Decoupled from luck | Y | N | N | N | Y | Y | N |
| Deterministic, | Y | N | N | E | N | N | N |
| Continuous HQ | |||||||
| Measure engagement | Y | E | N | N | N | N | Y |
| Correlate with KPIs | Y | E | N | E | N | N | N |
| Reflect game prudence | Y | E | N | N | N | N | N |
| Assess skill within | Y | N | N | N | N | N | N |
| Few games | |||||||
| Catch change quickly | Y | N | N | N | N | N | N |
| Improves win ratio | Y | E | N | N | N | N | E |
Conclusions and Future Directions
We presented GAIM, a deep-learning framework that enables benchmarking and profiling of players. We develop an efficient model for GAIM that uses first drop action of skilled players to calibrate the goodness of the hand. The model is then used to mine game play characteristics of players, by monitoring drop adherence. Future work includes developing persuasion strategies to up-skill the players to improve first drop behavior and to look into more game play actions beyond the first drop so that a more fine-grained assessment of skill can be made.
Electronic supplementary material
Below is the link to the electronic supplementary material.
Footnotes
Please note: All figures in this paper are best viewed in color.
VGG16, ResNet and DenseNet were trained with our dataset from scratch, which performed better than transfer learning of weights. We also tried Inceptionv3 [24] and AlexNet [13] but have only included the best performing networks. .
We thank our colleague Samrat Dattagupta for his contributions to this work.
Contributor Information
Hady W. Lauw, Email: hadywlauw@smu.edu.sg
Raymond Chi-Wing Wong, Email: raywong@cse.ust.hk.
Alexandros Ntoulas, Email: antoulas@di.uoa.gr.
Ee-Peng Lim, Email: eplim@smu.edu.sg.
See-Kiong Ng, Email: seekiong@nus.edu.sg.
Sinno Jialin Pan, Email: sinnopan@ntu.edu.sg.
Sharanya Eswaran, Email: sharanya.eswaran@games24x7.com.
References
- 1.Board games market - global outlook and forecast 2018–2023
- 2.Playing cards and board games market size share and trends analysis 2019–2025
- 3.Braverman J, et al. How do gamblers start gambling: identifying behavioral markers for high-risk internet gambling. Eur. J. Public Health. 2010;22(2):273–278. doi: 10.1093/eurpub/ckp232. [DOI] [PMC free article] [PubMed] [Google Scholar]
- 4.Campbell M, et al. Deep blue. Artif. Intell. 2002;134(1):57. doi: 10.1016/S0004-3702(01)00129-1. [DOI] [Google Scholar]
- 5.Elo A. The Rating of Chessplayers Past and Present. New York: Arco Pub; 1978. [Google Scholar]
- 6.Ferrucci D, et al. Introduction to “this is watson”. IBM J. Res. Dev. 2012;56:1. doi: 10.1147/JRD.2012.2184356. [DOI] [Google Scholar]
- 7.Frank I, et al. Search in games with incomplete information: a case study using bridge card play. Artif. Intell. 1998;100:87. doi: 10.1016/S0004-3702(97)00082-9. [DOI] [Google Scholar]
- 8.Ganzfried, S., et al.: Computing equilibria in multiplayer stochastic games of imperfect information. In: IJCAI (2009)
- 9.Gao, S., et al.: Improved data structure and deep cnn design for haifu data learning in the game of mahjong. In: IPSJ Workshop (2018)
- 10.Guo, X., et al.: Deep learning for real-time Atari game play using offline MCTs planning. In: NIPS (2014)
- 11.He, K., et al.: Deep residual learning for image recognition. In: IEEE CVPR (2016)
- 12.Huang, G., et al.: Densely connected convolutional networks. In: CVPR (2017)
- 13.Krizhevsky, A., et al.: Imagenet classification with deep convolutional neural networks. In: NIPS (2012)
- 14.Mnih V, et al. Human-level control through deep reinforcement learning. Nature. 2015;518:529. doi: 10.1038/nature14236. [DOI] [PubMed] [Google Scholar]
- 15.Moravcik M, et al. DeepStack: expert-level artificial intelligence in heads-up no-limit poker. Science. 2017;356(6337):508. doi: 10.1126/science.aam6960. [DOI] [PubMed] [Google Scholar]
- 16.Mozgovoy, M., et al.: Analyzing user behavior data in a mobile tennis game. In: IEEE GEM (2018)
- 17.Richards, M., et al.: Information set generation in partially observable games. In: AAAI (2012)
- 18.van Rijn, J.N., et al.: The complexity of Rummikub problems. In: BNAIC (2015)
- 19.Sapienza A. Non-negative tensor factorization for behavioral pattern mining in online games. Information. 2017;9(3):66. doi: 10.3390/info9030066. [DOI] [Google Scholar]
- 20.Schaeffer J, et al. Chinook the world man-machine checkers champion. AI Mag. 1996;17(1):21. [Google Scholar]
- 21.Silver D, et al. Mastering the game of go with deep neural networks and tree search. Nature. 2016;529:484. doi: 10.1038/nature16961. [DOI] [PubMed] [Google Scholar]
- 22.Silver D, et al. Mastering the game of go without human knowledge. Nature. 2017;550:354. doi: 10.1038/nature24270. [DOI] [PubMed] [Google Scholar]
- 23.Simonyan, K., et al.: Very deep convolutional networks for large-scale image recognition. In: ICLR (2015)
- 24.Szegedy, C., et al.: Rethinking the inception architecture for computer vision. In: IEEE CVPR (2016)
- 25.Tesauro G. Temporal difference learning and TD-gammon. Commun. ACM. 1995;38(3):58–68. doi: 10.1145/203330.203343. [DOI] [Google Scholar]
- 26.Tukey J. Comparing individual means in analysis of variance. JSTOR Biometr. 1949;5(2):99. doi: 10.2307/3001913. [DOI] [PubMed] [Google Scholar]
- 27.Vinkemeier, D., et al.: Predicting folds in poker using action unit detectors. In: IEEE FDG (2018)
- 28.Wang, B., et al.: Beyond winning and losing: modeling human motivations and behaviors using inverse reinforcement learning. In: AIIDE (2019)
Associated Data
This section collects any data citations, data availability statements, or supplementary materials included in this article.